Author: vitorcherulli

  • Top 4 Flagship Smartphones Under ₹45,000 in 2026: Premium Features Without Breaking the Bank

    Top 4 Flagship Smartphones Under ₹45,000 in 2026: Premium Features Without Breaking the Bank

    Why Flagships Make More Sense Right Now

    The smartphone market has become increasingly challenging as rising memory chip costs push prices upward across nearly every segment. What was once considered a flagship bargain now often falls into premium territory. However, ongoing online discounts and exchange offers are changing the equation, making several high-end smartphones available for less than Rs. 45,000.

    Buyers can stretch their budget slightly and unlock flagship-level performance, better cameras, premium displays, and longer software support. Here are four premium smartphones offering significantly better value than many newly launched mid-range models.

    Four Flagship Phones Worth Considering

    These smartphones are designed to offer a complete flagship experience, making them attractive options for users who plan to keep their devices for several years. Among the top contenders are models from OnePlus, Samsung, Xiaomi, and iQOO, each bringing unique strengths:

    • OnePlus 13T: Offers a powerful Snapdragon processor, a triple-camera system co-developed with Hasselblad, and a 120Hz AMOLED display with lightning-fast charging.
    • Samsung Galaxy S24 FE: Features a vibrant Dynamic AMOLED 2X screen, a reliable Exynos chipset, and Samsung’s industry-leading four-year software update promise.
    • Xiaomi 14T Pro: Provides a MediaTek Dimensity chip, a Leica-tuned camera setup with excellent low-light performance, and a large battery with 120W fast charging.
    • iQOO 12: Delivers a top-tier Snapdragon processor, a dedicated gaming engine, and a high-refresh-rate screen, plus an advanced cooling system for extended gaming sessions.

    Should You Buy Now?

    If your budget is more than Rs. 35,000, this might just be the right time to go for a flagship. Following seasonal sales, exchange schemes, and bank discount offers, the price gap between flagships and mid-range phones has been temporarily bridged. Consumers can get exceptional value for their money with these high-end devices.

    Amazon is providing heavy discounts, exchange offers of up to Rs. 36,000, and No Cost EMI options on select smartphones, making it easy for consumers to buy high-end smartphones at affordable prices. This sale is happening at a time when smartphones are expensive amid increased memory costs, so now is the ideal moment to grab a flagship.

  • Ethereum’s $20K Target Revived as Lido Launches Major Validator Upgrade

    Ethereum’s $20K Target Revived as Lido Launches Major Validator Upgrade

    Ethereum traded above $1,900 as CrediBULL Crypto reiterated a $20,000-plus target and Lido began migrating more than 8 million staked ETH, worth about $16.5 billion, into a new validator structure. The analyst tied his forecast to long-term ETH/USD and ETH/BTC patterns, while Lido expects its upgrade to reduce Ethereum’s validator count and consensus-layer traffic.

    CrediBULL Maps a Route Toward $20,000

    CrediBULL first presented the target three weeks earlier, when ETH traded near $1,500. He later replied ‘$20K+’ to alphatracker’s call for Ethereum above $10,000. In a linked video, he called $10,000 the minimum level and described $20,000 as realistic, though not certain. The case starts with the ETH/BTC chart, which has declined for about four years. He said the pair has entered a long-term accumulation zone that could support a new base. He also pointed to a larger five-wave structure on the ETH/USD chart, noting Ethereum completed its first leg and remains above an invalidation level near $1,385.

    Under that framework, the next advance could carry ETH toward $10,000. A later wave could then lift the token beyond $20,000 if the stated support remains intact. CrediBULL compared the setup with April last year, when Ethereum traded near similar levels, faced widespread doubt, and later broke its previous record within months.

    Other traders remain divided. Saiyan set a $10,000 base case, while Cheds Trading rejected that outcome. Sykodelik said $10,000 would equal roughly twice Ethereum’s all-time high. ETH had gained nearly 4% in 24 hours and about 24% during the month, but still remained 60% below its record, according to CoinGecko figures.

    NoName cited four lower highs as evidence of a possible market floor. Ali Martinez identified a bullish MVRV ratio crossover. Meanwhile, Binance funding rates reached their highest level in six months. CryptoQuant analysts linked the rise to improving sentiment, although ETH remained below last year’s comparable price.

    Lido Starts Major Validator Consolidation

    Alongside the price debate, Lido started migrating more than 8 million staked ETH through its Curated Module v2 upgrade. CMv2 marks Lido’s largest core protocol change since Lido V2 launched in 2023. The system adopts Ethereum’s post-Pectra 0x02 validator format, which lets each validator secure up to 2,048 ETH. The previous effective balance limit stood at 32 ETH, requiring more validators for large staking balances.

    Lido expects consolidation to reduce Ethereum’s validator count from approximately 880,000 to about 628,000. The final total will depend on new validators joining during the transition. The protocol also estimates a 29% decline in consensus-layer attestation messages during each epoch, reducing network overhead without directly changing gas fees or transaction speeds. Lido plans to complete the migration gradually over several months, and stETH holders do not need to take any action.

    A Brief Roundup

    CrediBULL Crypto’s $20,000 outlook rests on long-term ETH/BTC accumulation and an ETH/USD wave structure above $1,385. Traders remain split, while improving funding and MVRV signals support the recovery case. Lido’s validator migration adds a separate network-efficiency development for Ethereum users to watch.

  • Dual Inverter vs Single Inverter AC: Which Model Delivers Better Energy Savings in 2026?

    Dual Inverter vs Single Inverter AC: Which Model Delivers Better Energy Savings in 2026?

    Choosing a new air conditioner can be challenging, as manufacturers promote several technologies and efficiency features. Two of the most common names you will see are Single Inverter AC and Dual Inverter AC. Many people think a dual inverter AC always uses much less electricity, but that is not completely true. The real answer depends on more than one factor.

    If you compare two ACs with the same cooling capacity, such as 1.5 Ton, a dual inverter model usually uses a little less electricity than a single inverter model. However, the BEE star rating and ISEER value matter even more. A 5-Star single inverter AC with a higher ISEER can use less electricity than a 3-Star dual inverter AC. So, one should never choose an AC only because the product is marketed as a Dual Inverter model.

    What is a Single Inverter AC?

    A single inverter AC has one rotary compressor. This compressor changes its speed based on the room temperature. When the room becomes cool, the compressor slows down instead of stopping completely. When the temperature rises again, it speeds up. This system helps the AC avoid constant on and off cycles. As a result, the AC uses less electricity than a normal fixed-speed AC. It also keeps the room temperature more stable and reduces pressure on the compressor.

    What is a Dual Inverter AC?

    A dual inverter AC comes with a twin rotary compressor instead of a single rotary compressor. Some brands also call it a Dual Rotary compressor. The basic idea stays the same. The compressor changes its speed based on the cooling demand, but the twin rotary design allows smoother operation. The second rotary cylinder helps the compressor work more efficiently across different speeds. It also reduces vibration and noise. Because of this design, the AC cools the room faster and maintains the desired temperature with less effort. The advantages of dual inverter technology become more noticeable during extended daily operation, where smoother compressor performance can improve efficiency, reduce noise, and maintain more consistent cooling.

    Which One Uses Less Electricity?

    If buyers compare the dual inverter vs. single inverter AC based on their tonnage and average BEE star rating, it is observed that the dual inverter AC consumes roughly 5% to 10% less energy than the single inverter variant. The reason behind the energy efficiency of the dual inverter AC is because of the twin rotary compressor, which operates quite efficiently under low working conditions. However, that doesn’t make all the models of dual inverter AC superior to the single inverter AC models. For example, a single inverter AC that has a 5-Star energy rating and ISEER of 5.3 may consume fewer units of energy as compared to a dual inverter AC that has a 3-Star energy rating and an ISEER of 4.2. Thus, this example makes it clear that energy ratings are more significant than the type of compressor.

    Why Does a Dual Inverter Save More Power?

    The twin rotary compressor allows smoother movement inside the AC. It keeps the compressor stable and helps it run at lower speeds without extra effort. This design also reduces vibration and friction. Since the compressor does not need sudden speed changes, it avoids unnecessary power use during long cooling sessions. These small improvements add up over time. They become more noticeable when the AC runs for many hours every day.

    Real Electricity Consumption Example

    Consider two 1.5 Ton ACs with similar cooling capacities operating under identical conditions during one cooling season. If each unit runs for approximately eight hours per day, a typical single inverter AC may consume around 850 kWh of electricity over the season. Under the same conditions, a comparable dual inverter model may consume between 780 and 810 kWh. This translates to an estimated saving of 40–70 kWh, although the actual difference varies depending on the BEE star rating, ISEER value, thermostat setting, room insulation, and outdoor temperature.

    Other Benefits of a Dual Inverter AC

    A dual inverter AC typically delivers faster cooling after startup. The twin rotary compressor is designed for smoother operation, which helps reduce noise and vibration. This results in quieter performance and improved comfort during extended use. Many customers also notice better temperature control because the compressor adjusts its speed more smoothly. These features improve comfort, especially during long summer days and nights.

    Which AC Should One Buy in 2026?

    Daily usage should guide the decision. Households that use an AC for six to ten hours every day or keep it running throughout the night may benefit more from a dual inverter AC. The small reduction in electricity use can add up over several years, while quieter operation and faster cooling make daily use more comfortable. For households that use an AC for only two to four hours each day, a single inverter AC can offer better value for money. Comparing the BEE star rating and ISEER value before compressor technology is recommended, as a high-efficiency single inverter AC often proves to be a smarter purchase than a lower-rated dual inverter model.

    Final Verdict

    A dual inverter air conditioning system is generally more energy-efficient than a single inverter system, as it uses a dual rotary compressor that operates more efficiently during prolonged cooling periods. In most instances, its efficiency gains are not excessively great, as one should only expect savings of about 5% to 10% when all other criteria are the same. Buyers looking for an economical AC in 2026 should begin by comparing the BEE star rating and ISEER value of the models under consideration. The compressor type should be evaluated afterward. When two models have the same energy ratings, a dual inverter AC typically offers advantages such as quieter operation and faster cooling. However, if a single inverter AC has a significantly higher ISEER value, it may be the better choice for overall energy efficiency.

    FAQs

    1. Does a dual inverter AC always consume less electricity?
    No. A higher-rated single inverter AC with a better ISEER can consume less electricity than a lower-rated dual inverter model.

    2. How much electricity can a dual inverter AC save?
    Under similar conditions, it can save around 5% to 10% more electricity than a comparable single inverter AC.

    3. What should I check before buying an AC in 2026?
    First compare the BEE Star Rating and ISEER value, then consider whether it uses a single or dual inverter compressor.

    4. Is a dual inverter AC worth the extra cost?
    Yes, if you use your AC for 6–10 hours daily or overnight. The energy savings, quieter operation, and faster cooling can justify the higher price.

    5. Besides saving electricity, what are the benefits of a dual inverter AC?
    It offers faster cooling, quieter operation, lower vibration, smoother temperature control, and improved comfort during extended use.

  • How Continuous Glucose Monitoring Data Enables Personalized Diabetes Care

    How Continuous Glucose Monitoring Data Enables Personalized Diabetes Care

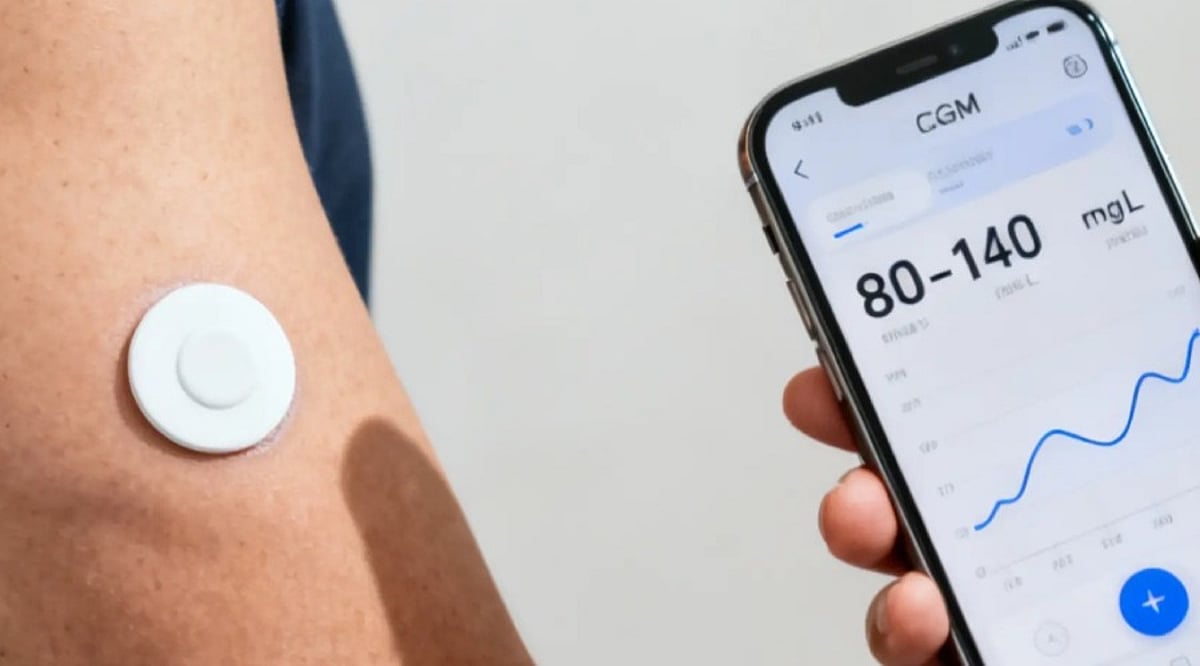
    Continuous glucose monitoring (CGM) is revolutionizing diabetes management by providing real-time glucose data that goes beyond traditional A1C measurements. Clinicians now use metrics such as Time in Range (TIR), Time Below Range (TBR), Time Above Range (TAR), and the Ambulatory Glucose Profile (AGP) to tailor treatments to individual patient needs. AI-powered analytics, electronic health record (EHR) integration, and remote patient monitoring further enhance clinical decision-making and improve patient outcomes.

    Understanding CGM Data Through the Ambulatory Glucose Profile (AGP)

    Rather than sifting through thousands of raw readings, healthcare providers rely on the AGP—a standardized report that condenses two to four weeks of CGM data into a single visual snapshot. The AGP overlays daily glucose curves into percentile bands, making patterns such as overnight dips or afternoon spikes immediately apparent. This format, supported by the ATTD consensus and incorporated into the American Diabetes Association Standards of Care, streamlines interpretation. However, providers first verify sensor wear time and data completeness to ensure the report accurately reflects the patient’s glucose behavior.

    Key CGM Metrics: Time in Range, GMI, and Glucose Trends

    Time in Range—the percentage of time glucose stays between 70 and 180 mg/dL—has become a cornerstone metric alongside A1C. Most adults with diabetes aim for at least 70% of the day within this window, though targets vary based on age, pregnancy, comorbidities, and hypoglycemia risk. Clinicians also examine Time Below Range to catch hypoglycemic episodes that A1C can miss, especially in insulin users, and Time Above Range to identify sustained hyperglycemia that increases long-term complication risk. The Glucose Management Indicator (GMI), a CGM-derived estimate of A1C, provides additional context when it diverges from lab results, prompting further investigation into factors like altered red blood cell turnover or glucose variability.

    Personalizing Treatment Plans with CGM Data

    Once patterns are identified, treatment becomes highly individualized. For example, repeated overnight lows may lead to adjustments in basal insulin dosing rather than a blanket increase. High fasting glucose with stable overnight levels often signals the dawn phenomenon, managed by altering medication timing rather than dosage. Post-meal spikes can be addressed through meal timing, dietary changes, or faster-acting insulin. CGM data also guides medication selection by matching glucose patterns to drug mechanisms. Multidisciplinary teams—including endocrinologists, diabetes educators, pharmacists, and dietitians—collaborate using the same data to craft a cohesive plan around the patient’s unique trends.

    AI, EHR Integration, and Remote Monitoring Enhance CGM Data Management

    The sheer volume of CGM data presents a challenge, but technology offers solutions. EHR integration via FHIR-based device connections pulls CGM data directly into patient charts, allowing providers to view trends without switching platforms. Decision-support software uses pattern recognition to flag issues like nocturnal hypoglycemia before they escalate, and some platforms now send predictive alerts ahead of low events. Population dashboards enable providers to scan entire patient panels and prioritize those needing immediate attention. Remote monitoring shifts care from reactive quarterly visits to proactive outreach—clinicians can review data between appointments and intervene early via phone calls or portal messages when concerning trends emerge.

    Strengthening Patient Engagement and Shared Decision-Making

    CGM data also transforms the patient-provider dialogue. Both parties can view the same AGP and discuss specific events—a glucose spike after lunch or a dip during exercise—making treatment decisions more transparent and collaborative. When patients understand the rationale behind adjustments, they are more likely to adhere to changes and sustain self-management efforts.

    Future Directions: Predictive Alerts and Automated Insulin Delivery

    As CGM technology evolves, it moves beyond passive monitoring to active treatment. Predictive hypoglycemia alerts can warn patients and providers before dangerous lows occur, while automated insulin delivery systems already use CGM data to adjust insulin in real time. AI-powered analytics and digital therapeutics promise to make these systems even smarter. As these technologies become standard in clinical care, diabetes management is shifting from a reactive approach to a proactive, data-driven model that emphasizes continuous, personalized care.

  • 2026 Computer Monitor Buying Guide: From Full HD to 8K Resolutions and Beyond

    2026 Computer Monitor Buying Guide: From Full HD to 8K Resolutions and Beyond

    Choosing the right computer monitor involves more than just picking a high resolution. Factors like display technology, refresh rate, HDR support, color accuracy, and connectivity all play a critical role in determining the best monitor for work, gaming, creative tasks, and entertainment.

    Understanding Screen Resolutions

    Resolution refers to the number of pixels a monitor can display. Higher resolutions deliver sharper images. Here’s a quick breakdown:

    • Full HD (1920 × 1080): 2.07 million pixels – the entry-level standard.
    • QHD / 1440p (2560 × 1440): 3.69 million pixels – about 1.78 times more than Full HD.
    • 4K (3840 × 2160): 8.29 million pixels – exactly four times Full HD.
    • 5K: 14.7 million pixels – roughly seven times Full HD.
    • 8K (7680 × 4320): 33.18 million pixels – 16 times Full HD.

    Beyond Resolution: Key Features Buyers Look For

    Modern buyers evaluate several additional features before making a purchase:

    • Display technology: IPS (color accuracy and wide viewing angles), VA (deep blacks and high contrast), OLED (true blacks, vivid colors, instant response), Mini-LED (excellent HDR brightness with many local dimming zones).
    • HDR certification: Look for DisplayHDR 600, 1000, True Black, or True Black 1400 for superior brightness and contrast.
    • Refresh rate: 60–75 Hz for office work, 100–144 Hz for general use and console gaming, 240–360 Hz for competitive PC gaming, and up to 500 Hz for esports.
    • Color accuracy: 100% sRGB for photography, DCI-P3 for video editing, Adobe RGB for printing. Many monitors now offer factory calibration and built-in calibration tools.
    • Connectivity: HDMI 2.1, DisplayPort 2.1, USB-C with power delivery (65–140W), Thunderbolt 4, USB hubs, and KVM switches. HDMI 2.2 is also emerging for even higher resolutions and refresh rates.
    • Burn-in warranty and ClearMR ratings are also becoming important considerations.

    Choosing the Right Resolution for Your Needs

    • Full HD: Suitable for budget builds and basic office tasks.
    • QHD: The sweet spot for most users – excellent balance of image quality, performance, and price, especially for gamers.
    • 4K: The premium standard for creative professionals and anyone who demands maximum detail.
    • 5K: Ideal for designers, photographers, CAD professionals, and Mac users who work with fine text or graphics.
    • 8K: Best for specialized applications like video production, medical imaging, scientific research, and large-format photography.

    Screen Size Matters

    Match screen size to resolution for the best experience:

    • Full HD: 22–25 inches
    • QHD: 27 inches
    • 4K: 27–32 inches
    • 5K and 8K: 32 inches or larger

    Why Choosing the Right Monitor Matters

    A well-chosen monitor boosts productivity, enhances gaming, and improves entertainment. A poor choice can lead to eye strain, lower efficiency, and wasted money. With rapid advancements in display technology, informed decisions are essential.

    Final Thoughts

    The best monitor is not necessarily the one with the highest resolution. It’s the model that combines the right screen size, display technology, refresh rate, HDR support, color accuracy, and modern connectivity for your specific needs. Full HD remains adequate for basic tasks, QHD is the all-around sweet spot, 4K is the premium mainstream choice, and 5K/8K are best left to professionals with specialized workflows.

    FAQs

    1. Is 4K always better than QHD? Not necessarily. QHD offers an excellent balance of image quality, performance, and affordability, while 4K is ideal for creative professionals and users who want maximum detail.
    2. Which panel type is best in 2026? IPS is great for color accuracy, VA delivers higher contrast, OLED offers the best picture quality, and Mini-LED provides excellent HDR brightness.
    3. What refresh rate should I choose? 60–75Hz is suitable for office work, 100–144Hz is ideal for everyday use and gaming, while competitive gamers benefit from 240Hz or higher.
    4. Why is HDR important? HDR improves brightness, contrast, and color depth, creating a more realistic and immersive viewing experience, especially for movies, games, and HDR content.
    5. Which monitor resolution is best for professionals? Most creative professionals prefer 4K, while photographers, designers, CAD users, and Mac users may benefit from 5K. 8K is best suited for specialized professional workflows.
  • Samsung vs LG Washing Machines: Which Brand Offers Superior Cleaning Performance?

    Samsung vs LG Washing Machines: Which Brand Offers Superior Cleaning Performance?

    When shopping for a new washing machine, Samsung and LG are two of the most popular brands. Both offer modern features, solid build quality, and strong performance. But which one cleans better? Our comparison shows that LG holds a slight edge in cleaning performance, fabric care, and quiet operation, while Samsung excels with smart features and faster cycles.

    Overview

    • LG delivers slightly better cleaning and fabric care with AI Direct Drive and 6 Motion technology.
    • Samsung leads in smart features with SmartThings, AI Wash, and EcoBubble technology.
    • Choose LG for wash quality and durability; choose Samsung for smart convenience and connected living.

    LG Offers Better Cleaning Performance

    LG washing machines use AI Direct Drive technology that studies the fabric type and adjusts drum movement for each load. The 6 Motion Direct Drive technology uses multiple drum movements to remove dirt while protecting delicate fabrics. Expert reviews consistently rank LG among the best for stain removal and overall wash quality.

    Samsung Brings Smart Cleaning Technology

    Samsung’s EcoBubble technology mixes detergent with water to create bubbles that clean effectively, even in cold water. Advanced models include AI Wash, which automatically adjusts washing time, water, and detergent based on load size. Hygiene Steam sanitizes clothes and removes allergens.

    Fabric Care Gives LG Another Advantage

    LG’s AI Direct Drive and 6 Motion technology protect fabrics by adjusting drum movements for different clothing types—cotton, delicates, baby clothes, and sportswear. Samsung’s EcoBubble cleans gently without harsh rubbing, but LG’s adaptive drum movements offer slightly better fabric care overall.

    Speed Stays Close Between Both Brands

    LG’s TurboWash and Samsung’s QuickDrive both reduce wash time while maintaining cleaning quality. Neither brand has a clear advantage in speed.

    Smart Features Help Samsung Stand Out

    Samsung’s SmartThings app lets users control cycles, receive notifications, and monitor energy use. Premium models offer AI Energy features to lower electricity consumption. LG’s ThinQ app provides similar controls, but Samsung’s smart home integration is more complete, especially for users with other Samsung devices.

    LG Wins in Reliability and Quiet Operation

    LG uses Direct Drive technology with fewer moving parts than conventional belt-driven systems, resulting in less wear and tear and quieter operation. Samsung uses Digital Inverter motors that reduce noise and improve efficiency, but many specialists still prefer LG for longevity and silent performance.

    Which Brand Should You Choose?

    If deep cleaning is your priority, choose LG for its AI Direct Drive, 6 Motion, TurboWash, and Steam technologies that ensure effective cleaning without fabric damage. If you value smart features and connected living, Samsung’s EcoBubble, AI Wash, Hygiene Steam, and SmartThings offer excellent convenience.

    FAQs

    1. Which brand cleans clothes better, Samsung or LG? LG has a slight advantage thanks to AI Direct Drive, 6 Motion technology, and excellent stain-removal performance.
    2. Is Samsung better for smart home users? Yes. Samsung’s SmartThings app, AI Wash, and AI Energy features provide a more comprehensive smart home experience.
    3. Which washing machine is quieter? LG generally operates more quietly because of its Direct Drive motor, which has fewer moving parts.
    4. Which brand is better for delicate clothes? LG is often the better choice, as its AI Direct Drive adjusts drum movements based on fabric type for improved garment care.
    5. Are Samsung washing machines good for everyday cleaning? Absolutely. Samsung’s EcoBubble, Hygiene Steam, and AI Wash technologies provide excellent cleaning performance, even in cold water.
  • Indian Stock Market Opens Lower: Nifty 50 Dips 25 Points, Sensex Steady Near 76,830

    Indian Stock Market Opens Lower: Nifty 50 Dips 25 Points, Sensex Steady Near 76,830

    On Tuesday, the Indian stock markets opened on a muted note amid mixed global cues. The Nifty 50 opened at 23,971.25, about 25 points lower than its previous close of 23,995.95. The Bank Nifty started at 56,883.55, down 203.65 points, while the Sensex opened flat at 76,831.75.

    Broader indices ended higher, with the Nifty Midcap 100 rising 1% and the Nifty Smallcap 100 gaining 1.3%. The Indian rupee opened higher by 14 paise at ₹95.75 per dollar compared to the previous close of ₹95.89.

    Foreign institutional investors (FIIs) net sold shares worth ₹1,688 crore, while domestic institutional investors (DIIs) net bought shares worth ₹2,329 crore on July 27.

    Sensex Outlook

    Technically, the Sensex held positive momentum and formed a bullish candle on the daily chart, which is largely positive. “As long as the market is trading above 76,500, the pullback formation is likely to continue. On the higher side, it could retest the 77,000-77,300 level. On the flip side, below 76,500, the selling pressure is likely to accelerate. If it falls below this level, the market could slip to 76,200-76,000,” said Shrikant Chouhan, Head of Equity Research at Kotak Securities.

    Nifty 50 Outlook

    The Nifty 50 formed a bullish candle on the daily chart after snapping its five-session losing streak. The formation of a bullish gap between 23,823 and 23,891 indicates renewed buying interest. As long as the index holds above Monday’s gap area of 23,823-23,891, the ongoing pullback is likely to remain intact.

    “Going ahead, formation of higher high and higher low on a sustained basis and holding above 24,000 levels will signal a pullback towards 24,300-24,350 levels in the coming sessions. On the downside, a move below Monday’s gap area (23,823-23,891) will signal weakness and open downside towards the key support area of 23,500-23,600 being the confluence of the trendline support joining lows of April and June 2026, bullish gap area of 15th June 2026 and 61.8% retracement of the recent up move from 23,070-24,530,” said Bajaj Broking Research.

    Bank Nifty Outlook

    Bank Nifty also ended Monday’s session on a positive note, forming a doji candle and closing above its 50-day exponential moving average (EMA). The banking index continues to consolidate within the 56,500-58,700 range. The immediate hurdle for Bank Nifty is placed at 57,500, while the 58,500-58,700 zone is expected to act as a strong resistance in the coming weeks. A sustained move above these levels could strengthen bullish momentum.

    On the downside, 56,500-56,000 remains a crucial support zone as it coincides with the lower end of the six-week consolidation range, a rising trendline and the 52-week EMA. Bajaj Broking noted that only a decisive breach below this support could accelerate the decline toward the 55,000 level.

    Disclaimer: This article is for informational purposes only and does not constitute investment advice. Readers should conduct their own research before making any investment decisions.

  • Gold Prices Slip 0.48% on MCX to ₹1,41,800 as US Dollar Strengthens; Key Support and Resistance Levels in Focus

    Gold Prices Slip 0.48% on MCX to ₹1,41,800 as US Dollar Strengthens; Key Support and Resistance Levels in Focus

    Gold traded lower on the Multi Commodity Exchange (MCX) on Tuesday, July 28, as a stronger US dollar and anticipation of the Federal Reserve’s monetary policy decision weighed on the precious metal. August gold futures declined by 0.48%, settling at ₹1,41,800 per 10 grams.

    September silver futures also took a hit, falling 1.73% to ₹2,17,343. In the energy sector, Brent crude futures dropped 1.20% to $87.30 per barrel, while US West Texas Intermediate (WTI) edged down 1.16% to $81.65 per barrel.

    The decline comes as the US dollar index hovered near 101.5 ahead of the Fed’s rate decision scheduled for July 29. According to the CME FedWatch Tool, traders now price in an 81% chance of a rate hike in September, adding pressure on gold prices.

    Domestic Gold Prices

    In India, 24K gold fell by ₹169 to ₹1,44,170 per 10 grams, while 22K gold declined by ₹155 to ₹1,32,150. Prices varied slightly across major cities:

    • Mumbai: ₹1,44,170
    • Kolkata: ₹1,44,170
    • Delhi: ₹1,44,320
    • Chennai: ₹1,44,160

    US Gold Prices

    Across the Atlantic, spot gold fell 0.7% to $4,044.81 per ounce, after rising about 1% on Monday. US gold futures for August delivery lost 0.8% to $4,045.40. Other precious metals mirrored the decline: spot silver dropped 1.9% to $57.30, platinum lost 1% to $1,605.14, and palladium slid 1.6% to $1,271.09.

    Key Levels to Watch

    Market analysts remain cautious ahead of the Fed’s decision. Ilya Spivak, Head of Global Macro at Tastylive, commented: “We’re oscillating in this narrow range between $3,950 and $4,200, and I think the market is just waiting for Fed signals.” Spivak added that if the Fed meeting does not set the groundwork for a September rate hike, gold is likely to rally above $4,200 per ounce.

    Key support and resistance levels for traders:

    • International Gold: Support at $4,034 and $4,000; resistance at $4,110 and $4,140 per troy ounce.
    • International Silver: Support at $57.20 and $56.60; resistance at $59.40 and $60 per troy ounce.
    • MCX Gold: Support at ₹1,42,200 and ₹1,41,400; resistance at ₹1,44,000 and ₹1,45,150.
    • MCX Silver: Support at ₹2,19,100 and ₹2,17,000; resistance at ₹2,24,000 and ₹2,26,600.

    As always, investors are advised to monitor global cues, the dollar index, and Fed statements for further direction in gold and silver prices.

  • Tech Roundup: Intel Starfire Space Chip, Nvidia’s $5B AI Bet, Blockchain Analyst Surge & Crypto Slump

    Tech Roundup: Intel Starfire Space Chip, Nvidia’s $5B AI Bet, Blockchain Analyst Surge & Crypto Slump

    Good morning, tech fam — here’s your quick catch-up on the biggest stories making headlines today. From space chips and AI investments to hiring trends and crypto market swings, we’ve got you covered.

    Intel Unveils Starfire Chip for Smarter Space Missions

    Intel has introduced the Starfire space chip, designed to bring faster computing and artificial intelligence processing directly to satellites and spacecraft. Built to withstand harsh space conditions, the processor can handle onboard AI tasks with minimal input from Earth, supporting future government and commercial space missions.

    Nvidia Invests $5 Billion in Safe Superintelligence

    Nvidia is backing Safe Superintelligence, the AI startup co-founded by Ilya Sutskever, with a $5 billion investment. The deal provides the startup with expanded computing power and access to Nvidia’s Vera Rubin hardware. Financial terms were not officially disclosed, but the partnership signals a major push toward next-generation AI development.

    India Skills Report 2025: Blockchain Analysts in High Demand

    The India Skills Report 2025 reveals that graduate employability has reached 54.81%, with fintech talent seeing strong demand. Blockchain Analyst roles are expected to grow as digital finance expands. The report emphasizes skill-based learning, industry-focused education, and India’s increasing role in the global workforce.

    NVIDIA Launches Open Secure AI Alliance

    In response to security concerns raised after an OpenAI testing incident, NVIDIA has formed the Open Secure AI Alliance with more than 35 technology companies. The group aims to develop open AI security tools, helping businesses detect threats faster and strengthen cyber defense through shared technology.

    Crypto Market Tumbles Amid Rising Fear

    Bitcoin, Ethereum, XRP, and Dogecoin have fallen sharply as heavy selling and global uncertainty hurt market confidence. Analysts point to rising fear, whale sell-offs, and weaker risk appetite, warning that Bitcoin could face further pressure if key support levels break.

  • Bitcoin Drops to $63,235 as Ethereum, XRP, and Solana Slide Ahead of Fed Rate Decision

    Bitcoin Drops to $63,235 as Ethereum, XRP, and Solana Slide Ahead of Fed Rate Decision

    Bitcoin fell near $63,235 on Tuesday, extending recent losses as investors adopted a cautious stance ahead of the Federal Reserve’s two-day policy meeting. The broader cryptocurrency market also declined, with Ethereum, XRP, and Solana posting sharper drops than Bitcoin. Rising Treasury yields and a spike in rate hike odds have dampened risk appetite across trading desks.

    Bitcoin Price Today

    Bitcoin is trading at $63,235.23, down 3.15% over the past 24 hours, according to CoinMarketCap. Its market capitalization stands at approximately $1.26 trillion, with 24-hour trading volume of $27.81 billion. Price action remains tied to Fed rate expectations and shifting ETF flow trends.

    Selling Pressure Builds Ahead of FOMC

    Akshat Siddhant, Lead Quant Analyst at Mudrex, noted that Bitcoin came under renewed selling pressure as investors trimmed exposure to risk assets. The US 10-year Treasury yield climbed 14 basis points, lifting demand for fixed income. A dovish tone from the Fed could support a rebound toward $66,000–$68,000, while a hawkish surprise risks a slide toward $61,000.

    Recovery Slows Below Key Resistance

    Vikram Subburaj, CEO of Giottus, placed Bitcoin near $65,000, up more than 12% from its early July low. However, the recovery has slowed below the key $68,000 resistance level. Spot Bitcoin ETFs booked net outflows over the past two sessions after strong mid-July inflows. Ethereum traded near $1,893 and outperformed Bitcoin during the same period.

    BTC and ETH Outperform Equities in July

    The CoinSwitch Markets Desk reported that Bitcoin briefly moved toward $66,000 on easing US-Iran tensions. Elevated Treasury yields continue to limit broader risk appetite. BTC and ETH have still outperformed equities in July, gaining close to 11.6% and 24.6%, respectively. Bitcoin held above its 21- and 50-day moving averages near $64,300 and $63,300. A move above $66,000–$67,000 is needed to confirm stronger buying interest.

    ETF Outflows Highlight Fragile Conviction

    Nischal Shetty, founder of WazirX, said Bitcoin remains under pressure as investors weigh easing tensions against uncertainty around the Fed. Over $465 million in spot Bitcoin ETF outflows late last week point to fragile institutional conviction. Bitcoin trades near $63,050, with immediate support at $62,500–$62,800. Ethereum trades near $1,871, with resistance building between $1,900 and $1,920.

    Leveraged Positions Unwind Sharply

    Riya Sehgal, Research Analyst at Delta Exchange, noted that risk assets fell under pressure ahead of the Fed’s meeting. Bitcoin dropped sharply toward $63,000, triggering a heavy unwinding of leveraged positions. CoinGlass data showed 165,529 traders liquidated over 24 hours, totaling nearly $682 million. The $62,800–$63,000 zone stands as the first key demand area for buyers.

    Crypto Prices Today: Top 10 Coins at a Glance

    Based on live CoinMarketCap data as of today’s session.

    Biggest Losers: HYPE, XRP, SOL

    Hyperliquid led the decline, shedding nearly 7% through the session on heavy volume. XRP followed with a sharp drop, while Solana also slipped well below its weekly range.

    Relative Resilience: USDT, USDC, BNB

    Stablecoins held their pegs, remaining nearly flat amid the broader sell-off. BNB posted the smallest decline among majors, losing just over 1.5%.

    Key Headlines Impacting Prices

    Fed Meeting Kicks Off With Hawkish Undertones

    The Federal Reserve’s two-day policy meeting begins today, with a decision due Wednesday. Rate hike odds have climbed sharply this month under Chair Kevin Warsh, unsettling risk assets. CME’s FedWatch data shows a rising probability of a surprise hike this cycle. Traders across equities and crypto view this meeting as the week’s defining catalyst.

    Bitcoin ETF Streak Breaks After Strong Mid-July Run

    Spot Bitcoin ETFs booked a third straight week of inflows despite late losses near $465 million. BlackRock’s IBIT product accounted for nearly $415 million of those recent outflows. The reversal followed a strong run led by IBIT and Fidelity’s FBTC funds earlier this month. The break in momentum has weakened near-term sentiment across trading desks.

    CLARITY Act Momentum Fades Ahead of Recess

    The crypto market structure bill remains stalled in the Senate over ethics provisions. Republicans hold 53 seats and need seven Democratic votes to clear the required threshold. Prediction markets have cut 2026 passage odds sharply from earlier estimates. The delay keeps regulatory uncertainty elevated for exchanges and institutional desks.

    Investor and Market Outlook

    Bitcoin holds near $63,235 as traders weigh fragile ETF flows against Fed rate uncertainty. A close above $66,000 could open a path toward the $68,000 resistance zone. A slip below $62,500 risks exposing deeper support closer to $61,000 in coming sessions. Ethereum trades near $1,878, holding above key support after a volatile weekly session. Altcoins including Hyperliquid and Solana remain the most sensitive to shifts in risk sentiment.