
Category: Sports

  • 2026 World Cup Data Analysis: Top Three Contenders According to the Numbers

    2026 World Cup Data Analysis: Top Three Contenders According to the Numbers

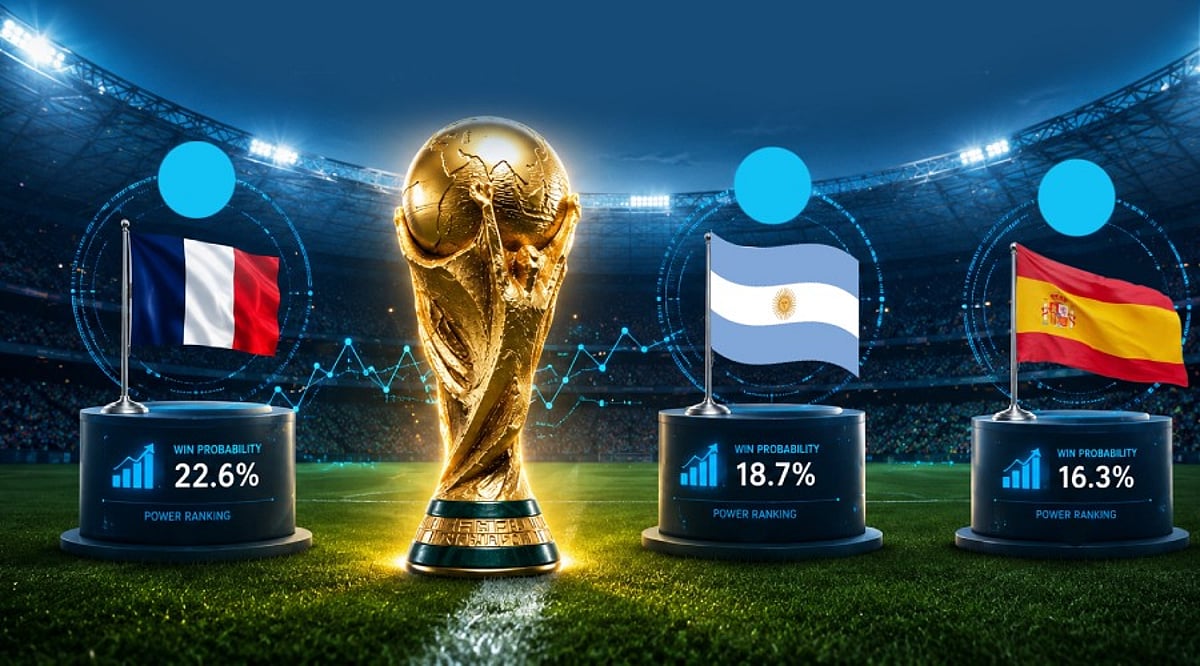
    As the 2026 FIFA World Cup enters its knockout rounds, the eye test and advanced analytics are finally aligning. Betting markets, predictive models, and ratings systems like Silver Bulletin’s PELE model all point to a select group of teams that have separated themselves both statistically and on the pitch. Here is a data-driven breakdown of the three strongest contenders and why the analytics back them.

    1. France — The Model’s Clear Favorite

    Across nearly every data source, France sits at the top. Their case is built not just on reputation but on performance quality. France reached the quarterfinals without conceding a single goal in knockout matches—a defensive record that stands out in an expanded 48-team tournament where fatigue and depth usually surface. Their odds shifted from +500 at the start to as short as +175/+180 by the quarterfinal stage, one of the sharpest market moves of the competition.

    Underlying numbers support the shift. In the round of 32 win over Sweden, France produced a dominant attacking display, and against Morocco in the quarterfinals they recorded 22 shots, nine on target. Predictive models weight such shot volume and quality heavily when projecting knockout success. Squad depth is another structural advantage: France can rotate elite players at nearly every position without a meaningful drop-off, which matters more in a longer, physically demanding tournament.

    Why the data likes them: elite expected-goals output, a defense untouched in knockouts, and depth that absorbs injuries or suspensions without losing quality.

    2. Argentina — Pedigree Meets a Skeptical Model

    Argentina presents a fascinating gap between market sentiment and pure model output. The reigning World Cup and Copa América champions have improved dramatically in betting markets—from around +950 at the start to roughly +400 by the quarterfinals—driven by tournament experience, a settled defensive structure, and Messi’s continued brilliance (he entered the quarterfinals as the tournament’s leading scorer at age 39).

    However, data-driven models are more cautious. Advanced ratings systems flag that Argentina’s underlying performance metrics haven’t matched their results. Back-to-back 3-2 knockout wins, including a dramatic late comeback against Egypt, actually caused some model-based ratings to decline because match control and shot data didn’t fully support the scorelines. That combination—proven knockout pedigree and a defense anchored by Emiliano Martínez, but statistically shakier performances—makes Argentina a dangerous contender, especially skilled at winning ugly even when models aren’t fully convinced.

    Why the data likes (and questions) them: elite goalkeeping and knockout experience, but underlying match metrics suggest more vulnerability than results indicate—a classic tension between clutch performance and sustainability in predictive modeling.

    3. Spain — Efficiency and Squad Balance

    Spain entered the tournament as a co-favorite with France and, despite an early stumble (a 0-0 draw with Cape Verde), rebuilt its case through the knockout rounds, including eliminating Portugal. Betting markets have Spain as a solid second or third choice, and the analytical case rests on similar pillars: two capable options at nearly every position, elite attacking talent, and recent tournament pedigree as reigning European champions.

    What separates Spain analytically is efficiency. Instead of overwhelming shot volume, Spain’s model-friendly profile comes from possession control and conversion quality—squeezing high-value chances out of matches rather than needing high shot counts to win. This trait historically endures across deep World Cup runs, holding up against various opponent styles, from possession-heavy sides to disciplined counter-attacking defenses.

    Why the data likes them: balanced squad depth, elite individual attacking talent, and a possession-efficiency profile that travels well against different tactical setups.

    The Bigger Picture

    What models and markets agree on is that this remains an unusually open World Cup. The expanded 48-team format has widened the field of realistic contenders and increased volatility. Teams like Norway, Morocco, Belgium, and England remain live threats. But when you filter for underlying performance data, squad depth, and tournament experience, France, Argentina, and Spain are the three teams the numbers keep pointing to as the final rounds approach.

    If you want to watch the finish live, check available World Cup 2026 final tickets to see the contenders battle on the biggest stage in football.

    Odds and statistics referenced are current as of early July 2026 and subject to change as the knockout rounds progress.
  • How India’s Top Sports States Built Winning Athlete Ecosystems: From Haryana to Odisha

    How India’s Top Sports States Built Winning Athlete Ecosystems: From Haryana to Odisha

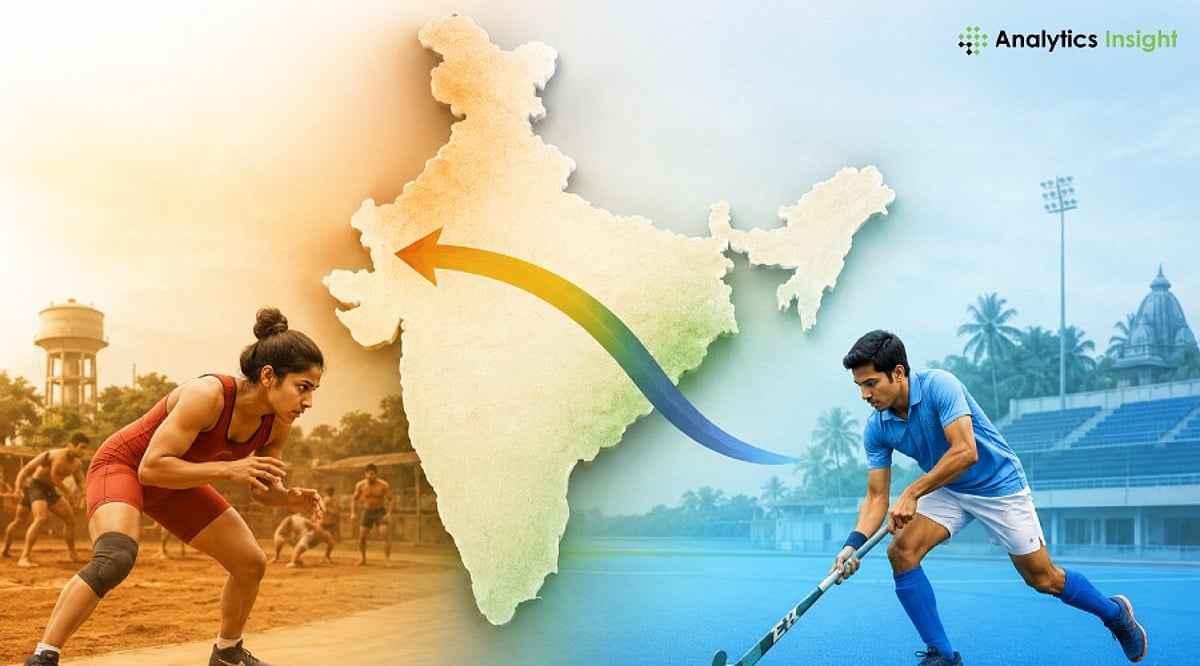
    India’s sporting success has never been spread evenly across the map. Because sports falls under the Constitution’s State List, individual state governments—not the central government—carry primary responsibility for building athletes from the ground up. That structural reality has produced a handful of clear standouts: Haryana, Odisha, Karnataka, Punjab, Maharashtra, Tamil Nadu, and Kerala have each built distinct sporting identities through different combinations of infrastructure, funding, and long-term planning.

    What Actually Defines a Winning Sports Ecosystem

    Every successful state seems to have the same basic components that keep recurring: a dense network of grassroots coaches, stable government support that is not affected by regime change, use of sports science and current training practices, and increasingly private sector participation. Those states that can combine some of these factors do better than those that just have one component, like infrastructure but no grassroots flow into it.

    Comparing India’s Leading Sports States

    Haryana: India’s Medal Factory

    Despite holding barely 2% of India’s population, Haryana consistently produces a disproportionate share of the country’s Olympic medalists, anchored by its wrestling and boxing culture. The state runs thousands of village-level sports nurseries feeding into district academies, backed by cash incentives that reward medal winners directly and a sports quota system that channels athletes toward stable government employment. Names like Neeraj Chopra, Sakshi Malik, Bajrang Punia, and Vinesh Phogat trace back to this same rural training ecosystem, built on the idea that talent identification has to start at the village level rather than in cities.

    Odisha: India’s Hockey Capital

    While Odisha followed a more focused and targeted path by investing heavily in one sport where it could dominate internationally, through the help of Mission Olympic Cells and the Odisha Naval Tata Hockey High Performance Centre, the state developed world-class infrastructure and became the first Indian state government to support a national team in the form of Indian hockey. This proved rewarding, as the result was two Hockey World Cups at Kalinga Stadium in Bhubaneswar and many talented athletes such as Amit Rohidas and Deep Grace Ekka who made India proud on the international front.

    Karnataka, Punjab, and Maharashtra: Different Paths to the Same Goal

    The state of Karnataka has emphasized sports science and private academies, generating all-round talent in badminton, cricket, and athletics through coached techniques and technologies. The state of Punjab is famous for its hockey and athletics tradition, which continues to train its athletes at specialized sports schools even years later, despite having produced players such as Milkha Singh. The state of Maharashtra has developed itself on the back of shooting, cricket, and badminton.

    Tamil Nadu and Kerala: Niche Excellence

    Tamil Nadu has been able to distinguish itself in the world of chess and table tennis due to its well-thought-out strategies to promote these games. In Kerala, athletics and volleyball have been the two main areas where success has come to the fore, thanks to the efforts taken in sports schools and the Kerala Sports Council, which has continued to produce talent since the days of P.T. Usha.

    Common Traits Behind Every Successful State

    Considering all seven states, there are certain trends that persist: sustainable policy-making irrespective of political changes, real investment in the well-being of athletes instead of temporary recognition, and an increasing dependence on private funding. The states that have understood sports as long-term economic and cultural investments instead of temporary prestige projects are the states that consistently produce champions, and the other Indian states trying to develop their sports identity should take lessons from them in the process of India bidding for the Olympics in 2036.

    Why This Matters

    India’s Olympic ambitions depend not only on individual talent but also on strong state-level sports ecosystems. Understanding how leading states consistently develop elite athletes offers valuable lessons for policymakers, sports administrators, and aspiring athletes seeking sustainable pathways to international success.