Tag: 2026 guide

  • The Essential 2026 Crypto App Guide: What to Know Before You Download

    The Essential 2026 Crypto App Guide: What to Know Before You Download

    Choosing the right crypto app can make or break your investment experience. Before you download any app in 2026, take a moment to understand what each platform offers and the common pitfalls to avoid. This guide breaks down the top crypto exchanges and key security practices every investor should follow.

    Top Crypto Apps for 2026

    Coinbase – Ideal for beginners with a simple interface, strong security, and support for hundreds of cryptocurrencies.

    Binance – Perfect for experienced traders offering advanced tools, low fees, and an extensive selection of coins.

    Kraken – One of the most secure crypto exchanges, combining advanced trading features with regulatory compliance.

    Crypto.com – An all-in-one ecosystem for crypto trading, rewards, and Visa cards, designed for comprehensive digital asset management.

    Bybit – Popular among derivatives traders thanks to high liquidity and advanced charting tools.

    Gemini – A security-focused exchange known for regulatory compliance and institutional-grade protection.

    Key Features to Check

    Always compare security protocols, supported coins, transaction fees, customer support quality, and withdrawal options before committing to any app.

    Common Mistakes to Avoid

    Ignoring security settings, using weak passwords, and skipping two-factor authentication are the most frequent errors that lead to serious losses. Take the time to set up proper protections from day one.

    By following this guide, you can avoid costly mistakes and choose the crypto app that best fits your needs in 2026.

  • Best Professional Tripods and Monopods for Content Creators (2026 Guide)

    Best Professional Tripods and Monopods for Content Creators (2026 Guide)

    Why Camera Support Matters

    A great camera won’t deliver professional results on an unstable tripod. The right support determines how steady your footage looks, how quickly you can set up, and how confident you feel on a shoot. Yet many creators spend heavily on cameras and lenses while overlooking the gear that keeps every frame stable.

    This guide compares five professional tripods, each built for a different style of content creation, to help you make an informed choice.

    How to Choose the Best Professional Tripod

    Tripod choice should follow your shooting style, not your budget. Use these criteria to narrow down the options:

    • Height and stability: For interviews and studio work, prioritize a tripod that reaches eye level and doesn’t wobble.
    • Portability: Frequent travelers need a lightweight model with a compact folded size that fits in a carry-on bag.
    • Material: Aluminum tripods are affordable but heavy. Carbon fiber costs more but reduces weight while maintaining strength—ideal for long shooting days.
    • Head type: Ball heads allow quick reframing for photos and general use. Fluid heads provide smooth pans and tilts for video work.
    • Locking mechanism: Twist locks pack tighter for travel; flip locks open and close faster for quick adjustments.
    • Quick-release plate: An Arca-Swiss compatible system offers more flexibility with third-party accessories as your kit grows.
    • Load capacity: Choose a tripod rated to carry at least 1.5–2 times the combined weight of your camera, lens, and accessories. This ensures stability and room for future upgrades.

    Best Professional Tripods Compared

    Manfrotto Befree Advanced – Best Travel Tripod

    Built for frequent travel, this tripod folds to 15.7 inches and weighs only 1.54 kg (3.4 lb). Despite its compact size, it supports up to 9 kg (20 lb), enough for a mirrorless body with a mid-size lens. The 494 ball head has separate controls for sphere lock, friction, and panning, so framing a shot takes seconds.

    Manfrotto MT055XPRO3 – Best Studio Tripod for Video

    This model trades portability for reach and stability. It extends to 66.9 inches (170 cm) and holds 9 kg at 2.5 kg total weight. The 90-degree horizontal column lets you swing the camera into overhead or macro positions without repositioning the whole rig—a real advantage for product reviews and fixed-camera interviews.

    Vanguard VEO 3+ 263AP – Best Hybrid Tripod and Monopod

    Creators who mix formats will appreciate this pick. One leg detaches to become a full monopod in seconds, and the MACC column pivots nearly 360 degrees for angles a fixed center column cannot reach. At 2.63 kg (5.8 lb) with a 6 kg (13.2 lb) load capacity, it suits anyone switching between static talking-head footage and handheld B-roll in the same session.

    Benro C3780TN – Best Carbon Fiber Tripod for Heavy Setups

    Carbon fiber earns its premium here. At 2.1 kg (4.6 lb), this tripod weighs less than many aluminum models despite an 18 kg (40 lb) load capacity—nearly double what the rest of this list supports. Benro’s QLS anti-rotation leg lock prevents legs from twisting out of position, a crucial detail when mounting a full-frame body and telephoto lens.

    Digitek DTR 540 BH – Best Budget Tripod for New Creators

    A premium tripod isn’t required for stable footage. The DTR 540 BH holds 8 kg (17.6 lb), converts into a monopod, and folds to 21 inches at 2.35 kg (5.2 lb)—all at a fraction of the price of the Manfrotto or Vanguard. It may not survive years of heavy professional use, but as a first serious tripod, it covers the essentials without cutting corners on load capacity.

    Final Thoughts

    The best tripod matches your shooting style, not a price tag. The right support improves every frame, extends the working life of your gear, and turns setup time into shooting time.

    Frequently Asked Questions

    What features should I look for in a professional tripod?

    Look for a stable build, sufficient load capacity, suitable maximum height, a reliable head, and a compact folded size if you travel frequently. These features improve both usability and shooting stability.

    Is a carbon fiber tripod better than an aluminum one?

    Carbon fiber tripods are lighter, absorb vibrations better, and are easier to carry for long shoots. Aluminum tripods are more affordable and offer excellent stability for studio and indoor content creation.

    Should content creators choose a tripod or a monopod?

    Tripods are ideal for interviews, product videos, and long recording sessions where maximum stability is needed. Monopods are better for events, sports, and fast-moving shoots where mobility is more important.

    Can a professional tripod support both smartphones and cameras?

    Yes. Most professional tripods use a standard 1/4-inch mounting screw, allowing them to support cameras as well as smartphones with a compatible phone mount adapter.

    How much load capacity does a content creator need?

    Choose a tripod with a load capacity at least 1.5 to 2 times the combined weight of your camera, lens, and accessories. This provides better stability and allows room for future gear upgrades.

  • Top 10 Data Visualization Interview Questions for 2026: Expert Answers & Tips

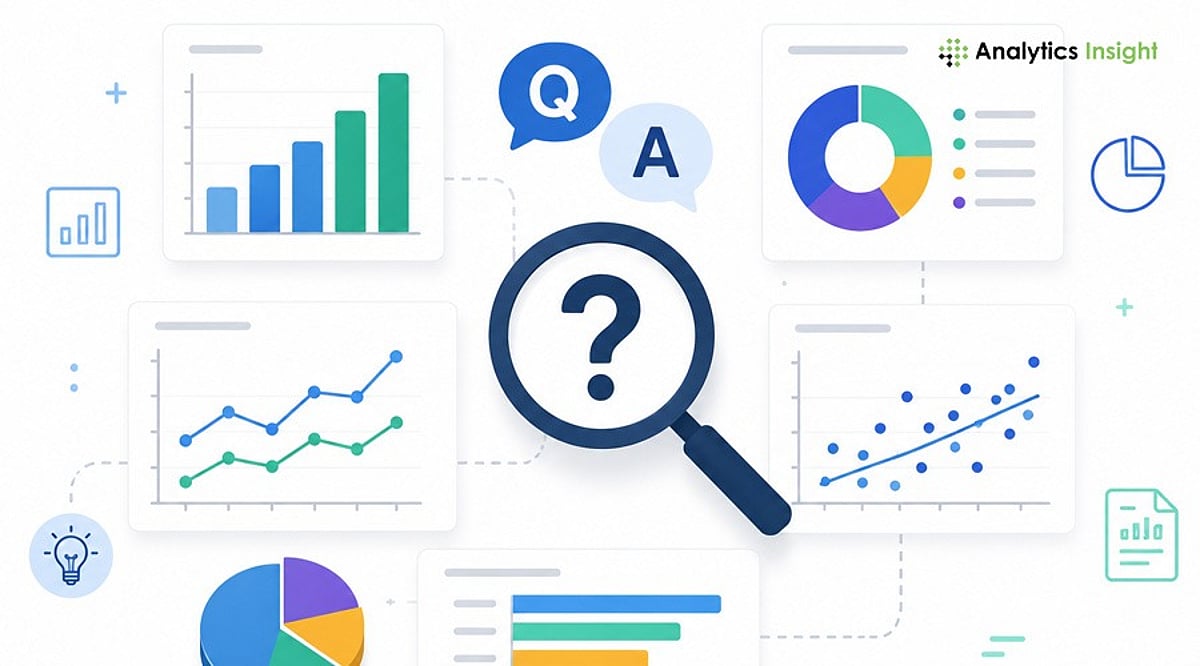
    Top 10 Data Visualization Interview Questions for 2026: Expert Answers & Tips

    Introduction

    Data visualization has evolved beyond simple chart creation. Recruiters now look for candidates who can transform complex data into actionable business insights. Whether you’re a Data Analyst, Business Intelligence professional, or Product Analyst, this guide covers the most common interview questions, sample answers, and preparation tips to help you stand out.

    1. What Is Data Visualization?

    Sample Answer: Data visualization is the graphical representation of information using charts, maps, graphs, and dashboards. It helps users quickly identify patterns, trends, and outliers that might go unnoticed in raw data, enabling faster and more informed decision-making.

    2. Which Data Visualization Tools Have You Used?

    Sample Answer: I have hands-on experience with Microsoft Power BI, Tableau, Excel, Google Looker Studio, and Python libraries such as Matplotlib, Seaborn, and Plotly. My choice of tool depends on project requirements—Power BI for enterprise reporting, Tableau for exploratory analysis, and Python for custom visualizations.

    3. How Do You Choose the Right Chart?

    Sample Answer: The chart type should match the story the data tells. Bar charts compare categories; line charts show trends over time; pie charts display simple proportions; scatter plots reveal relationships between variables; and maps visualize geographic data. I always prioritize clarity and ease of interpretation.

    4. What Makes a Good Dashboard?

    Sample Answer: A good dashboard is simple, organized, and aligned with business objectives. It highlights key performance indicators (KPIs), avoids unnecessary clutter, uses consistent colors, and allows users to find information quickly. Every element should serve a decision-making purpose.

    5. What KPIs Have You Displayed in Dashboards?

    Sample Answer: KPIs vary by industry. Common examples include revenue, sales growth, customer acquisition cost, conversion rate, customer retention, profit margin, inventory levels, and website traffic. The dashboard should always show metrics that directly support stakeholder decisions.

    6. How Do You Handle Large Datasets?

    Sample Answer: I clean data by removing redundant fields, apply data modeling, create summary tables, and use filters. To boost performance, I implement incremental refresh, optimized SQL queries, and efficient calculations. Pre-aggregation and indexing also help maintain speed.

    7. What Are Common Data Visualization Mistakes?

    Sample Answer: Frequent mistakes include using too many colors, choosing the wrong chart type, displaying unnecessary information, poor labeling, overcrowded dashboards, ignoring accessibility, and misleading scales or axes. Keeping visuals simple and purposeful improves readability and trust.

    8. How Do You Ensure Data Accuracy?

    Sample Answer: I cross-check dashboard values against original data sources, validate calculations, and test filters and business logic with stakeholders. Before publishing, I conduct user testing to confirm numbers meet business expectations and that no errors exist.

    9. Can You Explain a Dashboard You Built?

    Sample Answer: I built a sales performance dashboard that integrated data from multiple regions. It displayed revenues, profits, monthly sales trends, and product performance. Filters allowed drill-down by region, product category, and sales representative, enabling regional managers to identify opportunities quickly.

    10. How Do You Present Insights to Non-Technical Stakeholders?

    Sample Answer: I avoid technical jargon and focus on business implications. Instead of explaining how I calculated the numbers, I discuss what the data shows, why it matters, and what actions should be taken. Clear, story-driven communication turns data into decision fuel.

    Tips to Perform Better in Data Visualization Interviews

    • Build two or three dashboard projects for your portfolio.
    • Practice explaining dashboards in simple, non-technical language.
    • Learn when to use different chart types and why.
    • Understand basic data modeling concepts (star schema, measures, dimensions).
    • Review common KPIs for your target industry.
    • Be ready to discuss design decisions, not just technical features.

    Real project experience often makes a stronger impression than theoretical knowledge.

    Final Thoughts

    Data visualization interviews go beyond technical proficiency. Employers want candidates who understand the business context, communicate insights effectively, and empower decision-makers. By preparing these common questions and practicing with real dashboards, you can demonstrate both your technical skills and business mindset.

    FAQs

    What are the most common data visualization interview questions?

    Most interviews cover chart selection, dashboard design, KPI tracking, data storytelling, visualization tools, handling large datasets, ensuring data accuracy, and explaining insights to stakeholders. Both technical knowledge and communication skills are assessed.

    Which tools should I learn before an interview?

    Power BI, Tableau, Excel, Google Looker Studio, and Python libraries (Matplotlib, Seaborn, Plotly) are widely used. Mastering at least one enterprise BI tool and understanding dashboard fundamentals significantly improves readiness.

    How should I answer questions about dashboard design?

    Focus on simplicity, business relevance, and usability. Explain how you prioritize KPIs, maintain consistent formatting, avoid clutter, and design for quick trend identification and informed decision-making.

    How can I explain technical insights to non-technical stakeholders?

    Avoid jargon and emphasize business outcomes. Explain what the data shows, why it matters, and what action to take. Clear communication is as important as technical expertise in analytics roles.

    Do I need a portfolio for a data visualization interview?

    Yes. A portfolio with dashboards, reports, and real-world projects demonstrates practical skills. Recruiters value hands-on experience and problem-solving ability more than certifications alone.