
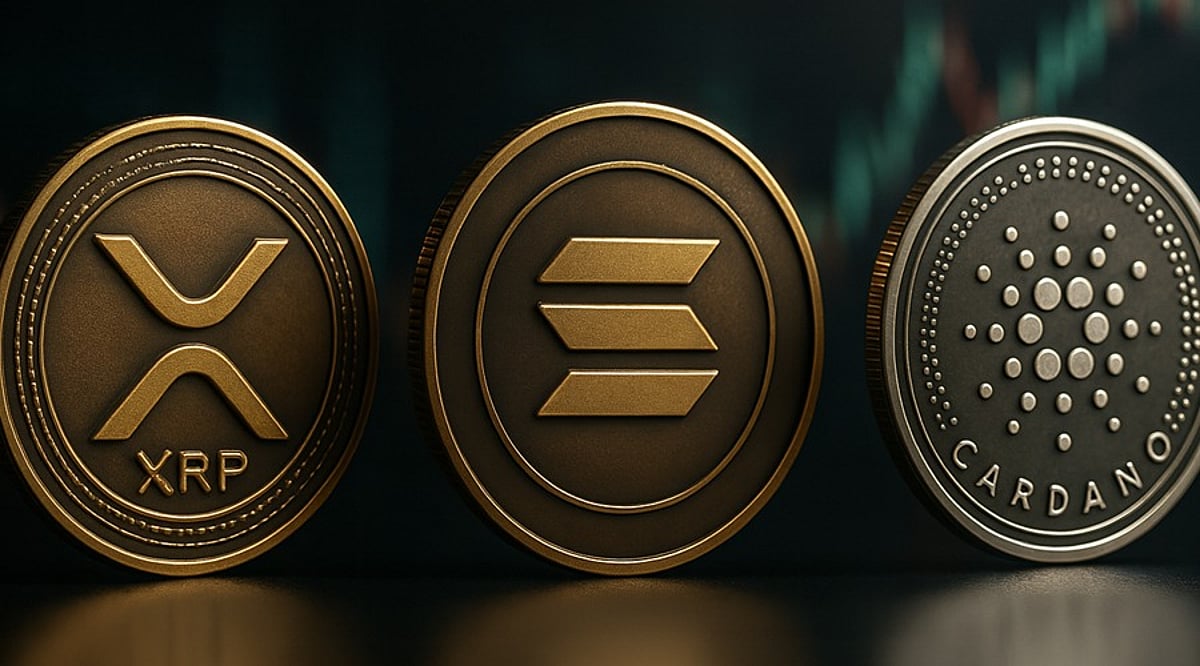
Major altcoins including Ripple (XRP), Cardano (ADA), and Solana (SOL) are under increasing pressure amid broader market volatility. All three tokens are trading near critical support levels, and a breakdown below these thresholds could trigger deeper losses, according to technical indicators.
Altcoins Face Risk of Further Declines
XRP: Downtrend Persists Below Key Moving Average
XRP remains in a downtrend, trading below its 50-day Exponential Moving Average (EMA) at $1.1300. At press time, XRP is at $1.0839, recovering slightly from a low of $1.0428 on July 6. Over the past seven days, XRP has declined 3.63%.
Technically, XRP is holding just above the 23.6% Fibonacci retracement level at $1.0757 (measured from $1.2935 to $1.009). The next major support lies at the Fibonacci anchor of $1.009. The Relative Strength Index (RSI) stands at 45.44, below the neutral 50 mark, while the Moving Average Convergence Divergence (MACD) sits marginally below its signal line in negative territory. These indicators suggest fading bullish momentum.
On the upside, initial resistance is near $1.0935, followed by the 50-day EMA around $1.1337 and the 50% retracement level at $1.1513.
Cardano: Bearish Breakout Targets Lower Lows
Cardano continues its downtrend, staying below its 50-day EMA at $0.1739 as the broader market remains bearish. Recent bounces appear to be corrective attempts within a dominant downtrend, extending the decline below the broken rising support trendline near $0.1654.
The bearish breakout in ADA could target the June 6 low at $0.1486, followed by the June 26 swing low at $0.1385. The RSI is near 49.41, just at the neutral line, while the MACD and signal line have slipped into negative territory, indicating sellers still hold the upper hand.
Immediate resistance appears around the downward trendline at $0.1693. A sustained break above this area would bring the 50-day EMA at $0.1739 into focus as the next hurdle.
Solana: Weak Momentum Below Key Averages
Solana trades below $74.34, maintaining a bearish near-term bias beneath the 50-day EMA at $76.17 and well below the 200-day EMA at $92.13.
Momentum reinforces this weak tone, with the RSI at approximately 45.59, indicating low demand, while the MACD remains in negative territory and below its signal line, suggesting continued downside pressure.
A decline could target the February 6 low at $67.50, followed by the June 6 low at $60.13. On the upside, immediate resistance is at the 50-day EMA near $76.32. A sustained break above that zone would expose the 200-day EMA at $92.59 as the next key barrier.
XRP, Cardano, and Solana continue to experience bearish momentum as they trade below key moving averages with weak RSI and MACD signals. Unless buyers reclaim major resistance levels, the risk of further downside remains elevated, making the upcoming support zones critical for determining the next market direction.
FAQs
- Why are XRP, Cardano, and Solana showing bearish momentum? All three altcoins are trading below their respective 50-day EMAs, while momentum indicators such as the RSI and MACD continue to reflect weakening buying pressure and a cautious market outlook.
- What are the important support levels for XRP? XRP is holding just above the 23.6% Fibonacci retracement level near $1.0757. If this support fails, the next major level to watch is around $1.009, which serves as the broader Fibonacci anchor.
- What price levels should Cardano traders monitor? Cardano’s immediate resistance lies near the descending trendline around $0.1693, followed by the 50-day EMA at $0.1739. On the downside, support is located near $0.1486 and then $0.1385.
- What does Solana’s technical setup indicate? Solana remains below both its 50-day and 200-day EMAs, indicating continued bearish sentiment. A break below current levels could lead to declines toward $67.50 and potentially $60.13 if selling pressure intensifies.
- What do the RSI and MACD indicators suggest for these altcoins? Across XRP, ADA, and SOL, the RSI remains below the neutral 50 level while the MACD stays in negative territory. Together, these indicators suggest that bearish momentum continues to outweigh buying interest in the short term.