
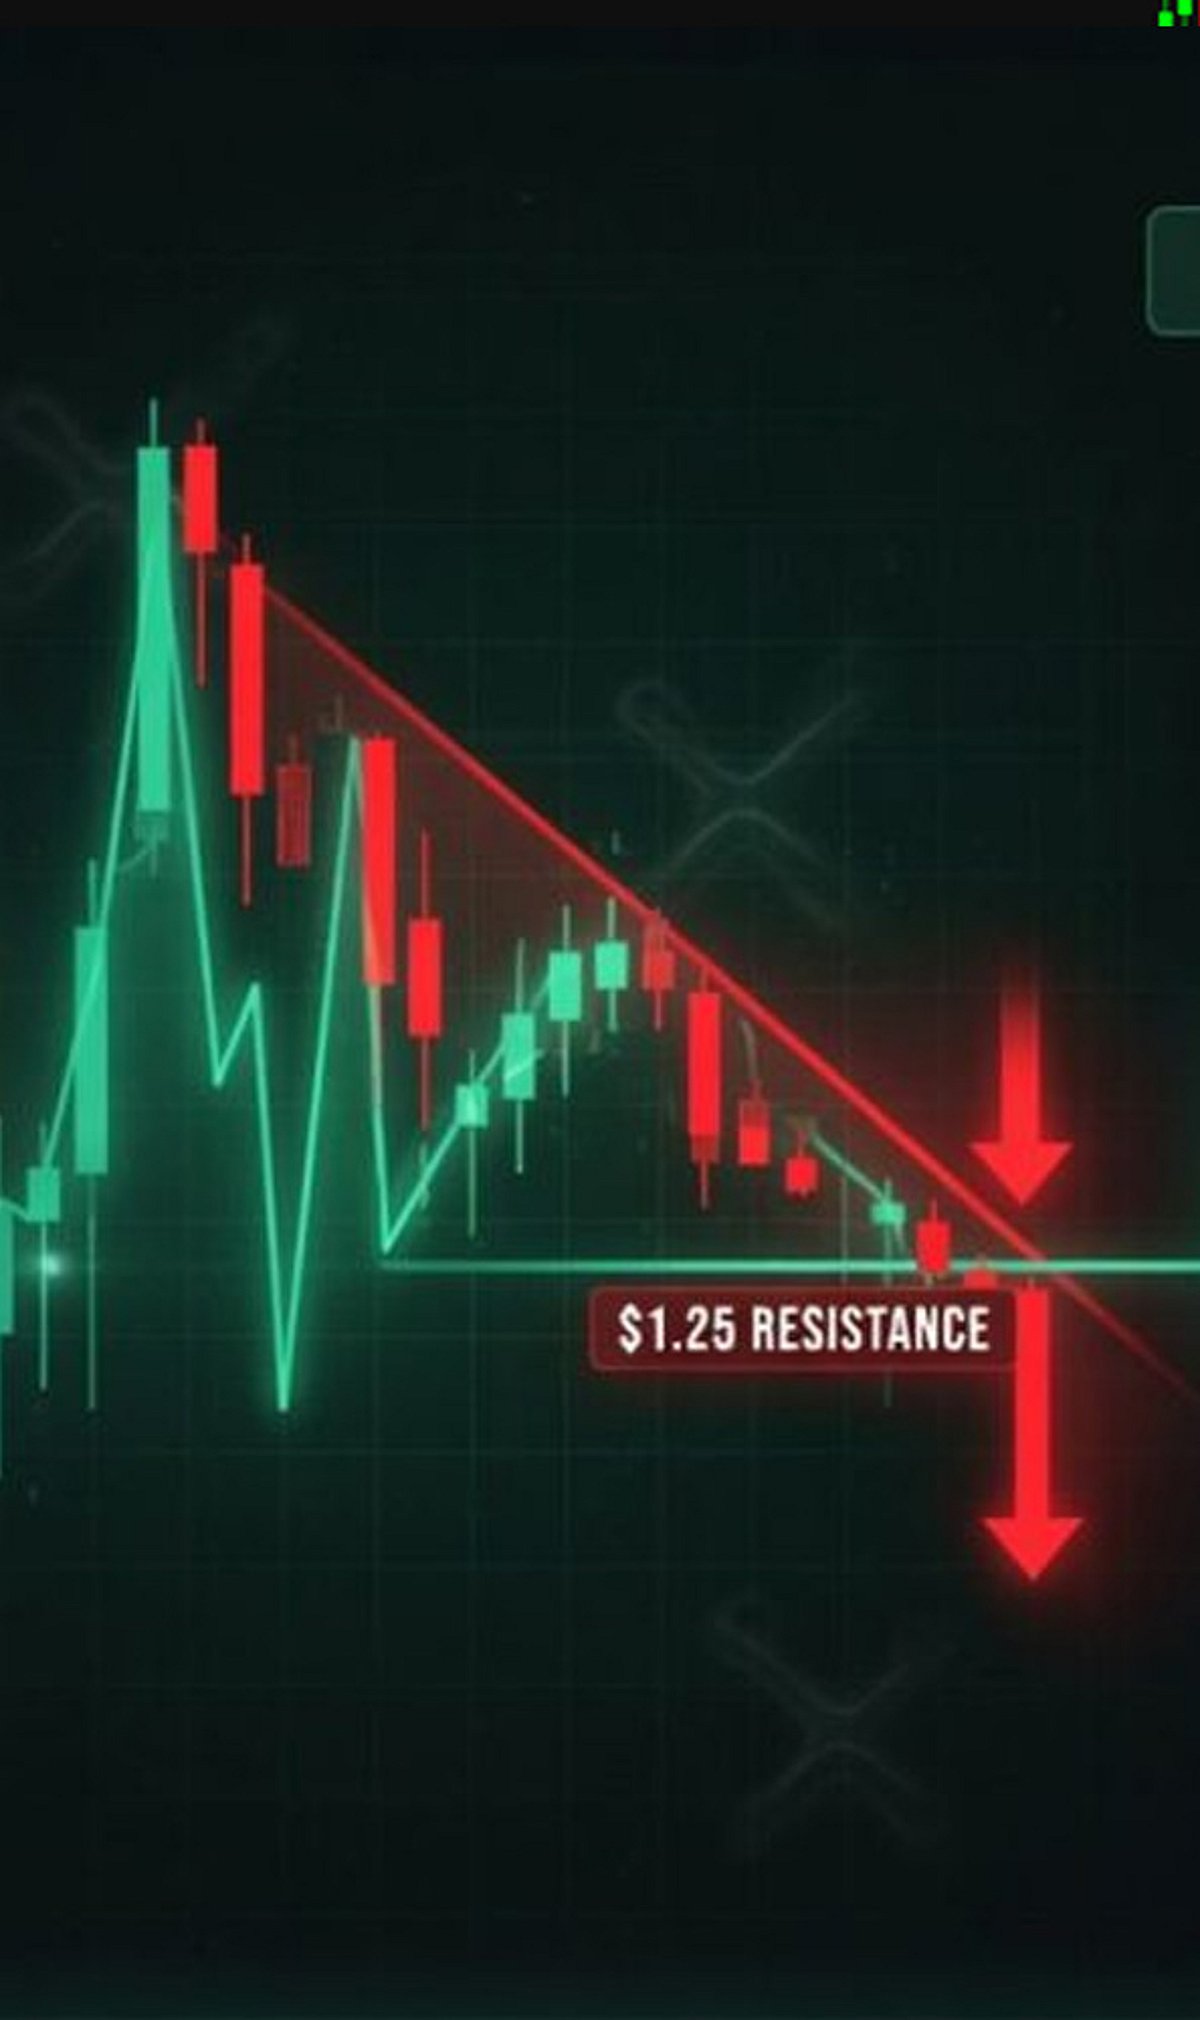
XRP’s price action is approaching a critical juncture, with several technical and on-chain indicators offering clues about its next major move. Traders should keep a close watch on these key levels and signals to navigate potential volatility.
Major Support Zone
Strong buying interest has been observed near recent support levels, which may help prevent deeper declines. However, losing this zone could trigger increased selling pressure and heightened volatility.
Key Resistance Level
A decisive close above resistance, accompanied by rising trading volume, could confirm renewed bullish momentum and attract additional institutional and retail participation.
Trading Volume
Higher trading volumes during price moves typically validate breakouts, while weak volume often indicates false moves and short-lived momentum. Always confirm breakouts with volume.
Moving Averages
Watch the 50-day and 200-day moving averages closely. Crossovers often signal trend changes and provide important dynamic support or resistance levels.
Relative Strength Index (RSI)
The RSI helps identify overbought and oversold conditions, enabling traders to anticipate possible trend reversals or continuation before major price movements.
Market Sentiment
Regulatory developments, ETF expectations, and broader cryptocurrency sentiment significantly influence XRP’s price direction and short-term trading opportunities.
Whale Activity
Large wallet transactions and exchange inflows often precede significant price swings, making on-chain monitoring essential for active XRP traders.
Bitcoin Correlation
XRP frequently follows Bitcoin’s broader market trend. Strong Bitcoin rallies or corrections can quickly impact XRP’s momentum and investor confidence.
Breakout Confirmation
Traders should wait for sustained price action above resistance or below support, supported by strong volume, before confirming a new trend.