Tag: breakout

  • Why Ethereum’s Price Breakout Is Generating Trader Optimism

    Why Ethereum’s Price Breakout Is Generating Trader Optimism

    Ethereum has recently staged a strong price breakout, moving above key resistance levels and signaling renewed bullish momentum. This development has attracted increased attention from traders worldwide, as the cryptocurrency shows signs of a sustained upward trend.

    Rising trading volumes indicate growing market participation, reinforcing confidence that the latest Ethereum rally is backed by substantial buying support. Furthermore, continued institutional investment in Ethereum has strengthened market sentiment, encouraging investors to anticipate long-term growth potential.

    Positive expectations surrounding Ethereum exchange-traded funds (ETFs) have also boosted investor confidence, contributing to stronger buying activity across the market. Meanwhile, on-chain activity growth—including increasing wallet activity, transactions, and network usage—highlights healthy blockchain adoption, supporting Ethereum’s recent price appreciation.

    Bullish chart patterns and favorable technical indicators suggest that Ethereum may continue its upward trajectory if buying momentum remains consistent. The rally has also lifted sentiment across the broader altcoin market, encouraging investors to explore additional cryptocurrency opportunities. Improving macroeconomic conditions and stronger risk appetite have further increased investor interest in digital assets, including Ethereum.

    Despite the bullish momentum, traders should remain cautious about potential risks, including market volatility, profit booking, and regulatory developments that could influence Ethereum’s direction.

  • Dogecoin Accumulation Hits Maximum Score as Breakout Pressure Intensifies

    Dogecoin Accumulation Hits Maximum Score as Breakout Pressure Intensifies

    Dogecoin holds near $0.07 as its accumulation score reaches 100. Whale purchases and futures activity are rising. A confirmed range breakout could revive targets near $0.65 and eventually above $1.25 if market participation strengthens further.

    Dogecoin remains near $0.07, while improving momentum, whale buying, and rising derivatives activity suggest pressure may be building inside its narrow trading range. Analyst Javon Marks also sees a wider cycle structure targeting $0.653 before a possible extension above $1.25. However, DOGE must hold support and escape its current range before those projections gain confirmation.

    Sideways Trading Builds a Wider Base

    DOGE is trading between about $0.0719 and $0.0730 as volatility stays unusually low. The narrow range shows that buyers and sellers have not gained firm control. Even so, the chart gives Dogecoin a maximum accumulation score of 100. This reading suggests buyers may be adding positions while price movement remains limited.

    At the same time, the relative strength index has moved toward its midpoint. Price has barely changed, which indicates that selling pressure has started to ease. The MACD histogram has also improved during the consolidation. However, volume remains weak, and the ADX still points to a ranging market.

    A clear move above $0.0730 could open the path toward $0.075 and $0.076. By contrast, a break below $0.0719 would weaken the accumulation setup.

    Cycle Pattern Revives Higher Price Targets

    Javon Marks views the current phase as post-breakout consolidation. His chart compares it with structures that appeared before Dogecoin’s major rallies in 2017 and 2021. Each earlier cycle followed a similar sequence. DOGE broke a descending trend, traded sideways for an extended period, and later entered a sharp expansion phase.

    The first major projection now sits near $0.653. This level stands close to Dogecoin’s previous cycle high and could place $0.70 within reach. A stronger advance could then support a projection above $1.25. However, the pattern still depends on DOGE holding long-term support and clearing its present range.

    Could the quiet price action mark another accumulation phase before volatility returns? For now, the setup remains a historical comparison rather than a confirmed breakout.

    Whale Buying and Leverage Increase

    Large Dogecoin holders acquired 200 million DOGE through Robinhood, according to an X post. The purchase carried an estimated value of about $14 million. The transaction added to evidence of large-wallet demand while DOGE traded sideways. Its impact will depend on whether those coins remain off exchanges or return for sale.

    Meanwhile, Dogecoin futures volume rose 114% to about $739.56 million. Open interest also increased 3.74% to roughly $1.08 billion. Rising volume and open interest show that traders added new exposure. CoinGlass data also shows liquidation clusters above and below the current price.

    These clusters could increase volatility if the price reaches either side. Broader market conditions offered some support, with Bitcoin above $64,000 and Ethereum above $1,870. XRP remained below $1.10, showing uneven performance among major cryptocurrencies. DOGE still needs stronger spot participation before its developing setup becomes more reliable.

  • XRP Aims for Top 5 Crypto Spot as Breakout Potential Builds

    XRP Aims for Top 5 Crypto Spot as Breakout Potential Builds

    XRP is gaining momentum through higher trading volume, institutional interest, whale accumulation, and Ripple ecosystem growth. Analysts watch the $1.45 resistance while stronger adoption could support higher long-term valuations.

    Key Takeaways

    • Trading volume and institutional demand are strengthening XRP’s bullish momentum.
    • The $1.45 resistance level remains the key trigger for a potential breakout.
    • Long-term growth depends on wider adoption, favorable regulations, and overall market sentiment.

    Valued among the top five largest cryptocurrencies, XRP trades at approximately $1.11 following a 4.1% daily gain. This recent upward movement pushes its 24-hour trading volume near $1.5 billion, while its total market capitalization scales to roughly $87 billion.

    Higher Trading Activity Builds Confidence

    One of the biggest reasons behind the recent optimism is the sharp rise in trading activity. A trading volume of nearly $1.5 billion in one day shows that buyers and sellers remain highly active. Large trading volume often reflects stronger market interest and can support price movement when demand continues to rise.

    Market experts believe that healthy trading activity usually creates better price stability and attracts even more investors. As fresh money enters the market, confidence often grows across the crypto sector. XRP has benefited from this trend over the past few weeks.

    Institutional Interest Supports the Market

    Another major factor behind XRP’s recent strength is growing institutional interest. Large investment firms have shown greater interest in digital assets after new developments around crypto investment products.

    Several reports point to fresh inflows linked to XRP exchange-traded funds in some markets. These products allow investors to gain exposure to XRP through traditional investment channels. This type of access often attracts large financial institutions that prefer regulated investment products.

    Apart from ETF activity, trading data also shows stronger participation from major Asian crypto exchanges. This wider market support has helped XRP maintain positive momentum even during periods of market volatility.

    Whale Activity Adds More Optimism

    Blockchain data also shows continued accumulation by large XRP holders, often called whales. These investors control significant amounts of XRP and usually make decisions after detailed market research.

    When whales continue to buy instead of sell, many traders view this as a positive signal. Historical market data has shown that similar accumulation phases have often appeared before large price movements.

    Ripple also continues its scheduled escrow releases. Despite these regular token releases, the market has remained stable, and the additional supply has not created major selling pressure. This balance has helped maintain positive market sentiment.

    Technical Picture Points to a Possible Breakout

    Technical analysts continue to watch XRP very closely. At present, the important resistance level remains near $1.45. A successful move above this level could open the door for another strong rally.

    On the downside, analysts identify the $1.05 to $1.10 area as an important support zone. As long as XRP remains above this range, many experts believe the overall trend stays positive.

    The price chart also shows a narrow consolidation pattern. Such patterns often appear before larger price moves. Combined with rising trading volume, this setup has increased expectations of a possible breakout if buying pressure continues.

    Can XRP Climb Even Higher?

    XRP already ranks among the largest cryptocurrencies in the world. However, stronger demand could help the coin increase its market value even further.

    Based on its current circulating supply, a market capitalization of $100 billion would place the XRP price near $1.62. If the market cap reaches $200 billion, the price could rise to around $3.24. A $400 billion market value would place XRP close to $6.47, while a $500 billion market cap would result in a price of roughly $8.09.

    Ripple’s Growth Adds More Support

    Ripple continues to expand its business across the global payment industry. The company focuses on cross-border payment solutions that help financial institutions move money faster and at lower cost.

    Positive regulatory developments have also improved investor confidence. Greater legal clarity has reduced uncertainty that affected XRP for several years. Many analysts believe this change has created a healthier environment for long-term growth.

    At the same time, development across the XRP Ledger ecosystem continues. New projects, business partnerships, and network improvements have added more value to the overall ecosystem. These developments have strengthened confidence among both retail and institutional investors.

    Risks Still Remain

    Although the recent outlook appears positive, some risks still deserve attention. The cryptocurrency market remains highly volatile, and prices can change quickly.

    A weaker crypto market could slow XRP’s momentum. Large investors may also decide to book profits after recent gains, which could create temporary selling pressure. Failure to move above the important $1.45 resistance level may also delay the next major rally.

    Slower institutional adoption or weaker investor sentiment could reduce demand in the coming months. These factors remain important for future price performance.

    Outlook Remains Positive

    A price of around $1.11, a market capitalization of roughly $87 billion, and a daily trading volume of nearly $1.5 billion.

    Increased institutional buying, whale accumulation, positive regulatory developments, and the continued growth of the Ripple ecosystem have provided much-needed support for the cryptocurrency.

    Getting to significantly higher prices requires a major expansion in market cap and broader adoption in global finance. For example, XRP would need to trade at around $20 per coin to reach a market capitalization of approximately $1.2 trillion, which remains far above its current valuation.

    FAQs

    1. Why is XRP attracting attention again? Rising prices, increased trading volume, institutional interest, and positive Ripple developments have renewed investor confidence.
    2. What is XRP’s key resistance level? Analysts are closely watching the $1.45 level, which could signal a stronger rally if broken.
    3. Why is whale accumulation important? Large investors buying XRP often indicates confidence and has historically preceded significant price movements.
    4. Can XRP reach higher price targets? Higher prices are possible if market capitalization grows through increased demand, broader adoption, and favorable market conditions.
    5. What are the biggest risks for XRP? Crypto market volatility, profit-taking, weak investor sentiment, slower institutional adoption, and failure to break key resistance levels could limit gains.

    Disclaimer: This article is provided for informational purposes and does not constitute investment advice. You are responsible for conducting your own research (DYOR) before making any investments.


  • XRP Price Today: Breakout Setup Strengthens as SEC and CFTC Classify It as a Digital Commodity

    XRP Price Today: Breakout Setup Strengthens as SEC and CFTC Classify It as a Digital Commodity

    XRP traded near $1.08 after a difficult first half of 2026, while technical indicators pointed to a possible breakout and U.S. regulators formally classified the token as a digital commodity. The token lost 27.1% in the first quarter and another 22.4% in the second quarter, yet analysts now identify a rare alignment of chart signals and seasonal trends that could support a recovery. At the same time, a joint SEC-CFTC interpretive release removed long-running uncertainty over XRP’s status under U.S. law.

    Technical Setup Points to a Breakout Attempt

    On the daily TradingView chart, XRP remains inside a descending broadening wedge. Traders often view that pattern as a late-stage accumulation formation. The Relative Strength Index has also formed a bullish divergence. Meanwhile, buyers continue to defend the local bottom near $1.05.

    Historical data from CryptoRank shows that XRP has not posted a negative third-quarter close in the past seven years. July has gained 4.19% so far, and previous summer reversals produced sharp rebounds after weak June performance. In July 2023, XRP rallied 47.6% after an early-summer decline. Likewise, a similar reversal in July 2025 produced a 35% return.

    To confirm a breakout from the wedge, buyers must push the price above the $1.12-$1.18 resistance zone. A successful move could open a path toward medium-term targets between $1.45 and $1.60, representing a projected upside of about 50%.

    Nevertheless, broader market weakness and slower inflows into U.S. spot XRP ETFs could limit short-term gains. Even so, the current consolidation continues to build a base ahead of the next directional move.

    The SEC and CFTC Formally Classify XRP as a Commodity

    On March 17, 2026, the Securities and Exchange Commission and the Commodity Futures Trading Commission published a joint interpretive release that named XRP as a digital commodity. The agencies issued the document under Release Numbers 33-11412 and 34-105020.

    The 68-page release divides crypto assets into five categories: digital commodities, digital collectibles, digital tools, payment stablecoins, and digital securities. Only digital securities fall fully under SEC jurisdiction, while the CFTC oversees digital commodities.

    The release also listed Bitcoin, Ether, Solana, Dogecoin, Cardano, Avalanche, Chainlink, Polkadot, Hedera, Litecoin, Bitcoin Cash, Shiba Inu, Stellar, Tezos, and Aptos in the digital commodity category. Reports counted either 16 or 18 named assets, depending on how examples in the document were interpreted.

    According to the release, a digital commodity derives its value from the programmatic operation of a functional crypto system and from supply and demand dynamics rather than from expectations tied to managerial efforts. The agencies applied that standard to XRP since the XRP Ledger operates independently of Ripple’s managerial control.

    Read More: XRP Slips to $1.10 Despite XRPL Crossing 8 Million Accounts

    A Broader Policy Shift Takes Shape

    The release also addressed when a non-security crypto asset may become part of an investment contract and when that status may end. In addition, it discussed airdrops, protocol mining, protocol staking, and wrapped versions of non-security assets.

    The guidance followed the SEC’s creation of the Crypto Task Force in January 2025 and the launch of Project Crypto as a joint SEC-CFTC initiative in January 2026. The agencies also announced a memorandum of understanding shortly before issuing the release.

    SEC Chair Atkins stated at the DC Blockchain Summit that the agency is not the ‘securities and everything commission anymore.’ CFTC Chair Selig said the wait was over and pledged to establish rules that would allow the crypto industry to operate onshore.

    What’s Next?

    XRP continues to trade within a key technical pattern as buyers target a breakout above the $1.12–$1.18 resistance zone. At the same time, the SEC and CFTC have officially classified XRP as a digital commodity, removing a major regulatory uncertainty while market participants watch for the next price move.

    Join our WhatsApp Channel to get the latest news, exclusives and videos on WhatsApp

  • Dogecoin Holds Critical Support Level as Traders Await Next Breakout Signal

    Dogecoin Holds Critical Support Level as Traders Await Next Breakout Signal

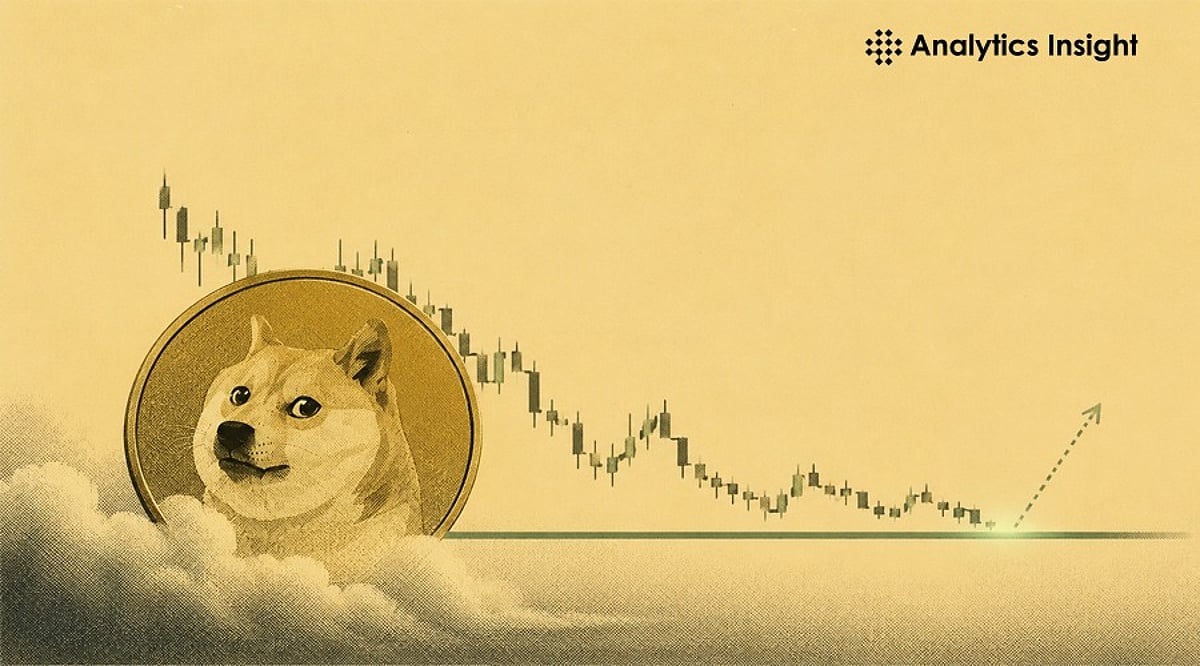
    Dogecoin is currently trading at a key support zone, with buyers and sellers locked in a tug-of-war that will determine whether the meme coin rallies or slides further. Instead of a sharp decline, DOGE has pulled back into a familiar safety area, giving bulls a clear line to defend. However, the market lacks decisive breakout momentum, leaving traders focused on volume and price action for confirmation.

    Support Zone Keeps Buyers Engaged

    Dogecoin remains above a known support level, allowing buyers to stay active despite recent cooling. The pullback has not triggered widespread selling, keeping the price within a range that traders continue to monitor closely. Without a clear breakout, the market is debating whether this range represents accumulation or a temporary pause before another decline.

    Dogecoin has historically recorded sharp moves after consolidation periods, drawing attention to the current setup. Yet momentum has not delivered the clear signal many participants are waiting for.

    Volume Remains the Critical Factor

    Despite holding support, Dogecoin risks weakening momentum if trading activity does not pick up. Meme-based cryptocurrencies rely on sustained market participation, making fresh volume essential for any recovery attempt. Without stronger buying interest, a rebound from support could quickly lose steam. Traders are treating the current structure as a level-driven setup rather than confirmation of a sustained rally.

    Traders Focus on Verifiable Market Signals

    Beyond price action, market participants are evaluating developments through measurable activity rather than headline-driven speculation. Traders are monitoring confirmed filings, integrations, regulatory updates, wallet activity, and other verifiable data before adjusting their outlook. The broader crypto market is responding to multiple catalysts—exchange listings, ETF flows, legal developments, protocol upgrades, and changing liquidity conditions—rather than a single dominant narrative.

    Each confirmed development provides another data point instead of guaranteeing an immediate price reaction. Traders are watching whether follow-up information supports the initial signal or weakens the narrative.

    What’s Next?

    Dogecoin continues to trade above a key support level as traders monitor resistance, volume, and momentum for confirmation of the next move. While the current range has not produced a breakout, verified market signals and price action remain the primary indicators to watch in the coming sessions.

  • Solana (SOL) Bounces Off $60 Support: Oversold Signals and ETF Hopes Fuel Breakout Prospects

    Solana (SOL) Bounces Off $60 Support: Oversold Signals and ETF Hopes Fuel Breakout Prospects

    Solana’s native token, SOL, has staged a notable recovery after dipping near the critical $60 support level during a broad market correction. Strong buying pressure at this zone halted further declines, reigniting trader confidence and speculation about a potential breakout.

    At press time, SOL is trading around $66–$68, having touched lows close to $61 during the recent sell-off driven by Bitcoin’s brief drop near $60,000. Despite the broader weakness, Solana held one of its strongest support levels, signaling resilient demand.

    Technical Indicators Point to Oversold Reversal

    The Relative Strength Index (RSI) recently entered oversold territory, a historical precursor to short-term rebounds for SOL. Past data shows that similar oversold readings often preceded swift recoveries, and the bounce from $60 reinforces this pattern. Analysts now watch whether this rebound matures into a sustained uptrend or fades as a dead cat bounce.

    Correction Erased Earlier Gains, but Network Fundamentals Remain Strong

    Earlier this year, SOL traded above $90 before losing nearly 25% due to weak market sentiment, global economic uncertainty, and Bitcoin’s decline. However, the defense of $60 demonstrated strong buying interest at lower levels. Meanwhile, Solana’s blockchain continues to thrive: the network processed 25.3 billion transactions in Q1 2026, active addresses are near record highs, and stablecoin usage is rising. This divergence between price weakness and on-chain strength underpins long-term optimism.

    ETF Speculation and Rising Volume Lift Sentiment

    Renewed discussions around a potential spot Solana ETF have improved market sentiment. Although no official approval has been granted, the prospect of institutional inflows keeps traders hopeful. Additionally, 24-hour trading volume has surged past $3.8 billion, indicating renewed participation after panic selling subsided.

    Key Resistance at $70 in Focus

    Traders now eye the $70 resistance level. A decisive break above could trigger buying toward the $78–$80 range, where SOL traded before the correction. Failure to clear $70 might lead to a retest of $60. The coming sessions will be critical in determining the token’s short-term direction.

    Network Upgrade and Long-Term Outlook

    Solana’s development team continues advancing the Alpenglow upgrade, which aims to reduce transaction finality to ~150 milliseconds and boost validator performance. This technical improvement could strengthen Solana’s position in DeFi, gaming, and asset tokenization, adding to the positive long-term narrative.

    For now, SOL stands at a crossroads. Oversold signals, robust network activity, rising volume, and ETF hopes have revived breakout hopes, but the market awaits confirmation above $70 to validate a sustained recovery.

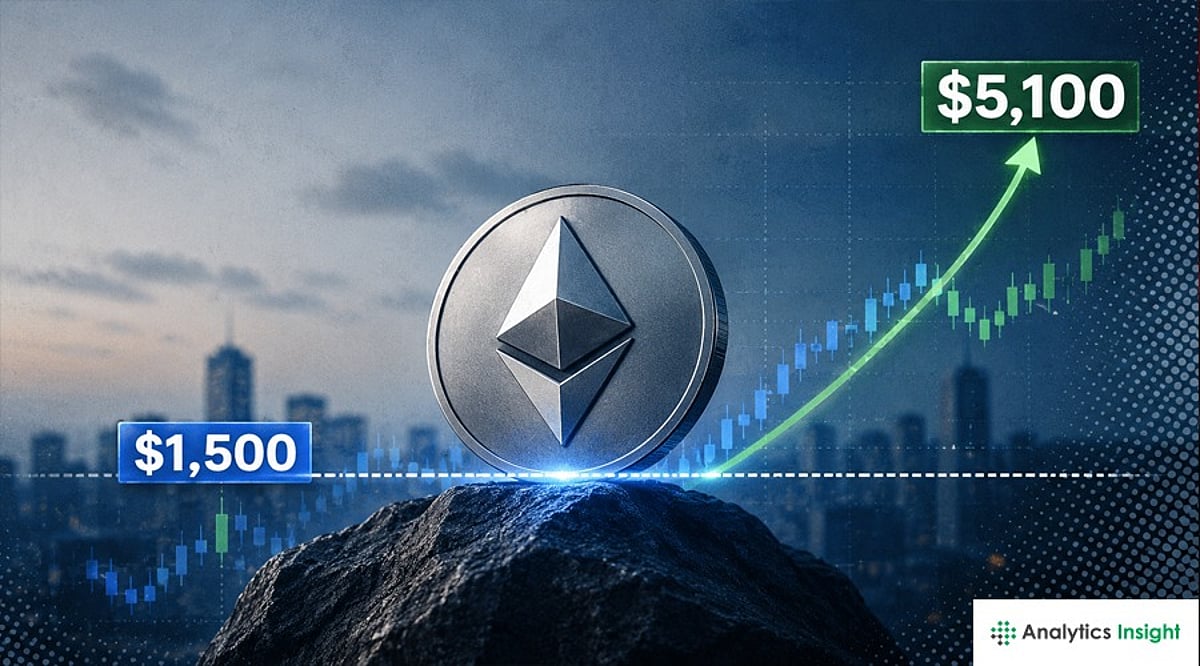
  • Ethereum Holds Key $1,500 Support; $5,100 Breakout Target Remains in Focus

    Ethereum Holds Key $1,500 Support; $5,100 Breakout Target Remains in Focus

    Ethereum traded near a critical support zone on June 24 as ETF outflows, weak momentum, and a break below the 200-day simple moving average kept pressure on the asset. The token stood at about $1,670, below $1,700 and near a level that has shaped its wider recovery since 2022.

    Key Support Defines the Near-Term Setup

    Ethereum has repeatedly bounced from the $1,500 to $1,650 area since the 2022 bear-market bottom. The zone protected every major low during the past several years. It also notes that Ethereum reached about $1,618 on the weekly chart. Earlier rebounds from this area came in 2023, late 2023, and 2025.

    According to analyst Ardi, weekly closes below $1,500 would mark a clear structural breakdown. He said that holding above that level would keep the broader support pattern intact.

    Chart Traders Compare ETH With the Russell 2000

    A separate chart view compares Ethereum with the Russell 2000. Both assets formed rounded bases after major declines, then recovered toward long-standing resistance. The Russell 2000 has already moved above its horizontal resistance near 2,500. That breakout strengthened its broader bullish structure.

    Ethereum has not matched that move. It still trades below a resistance band ranging from $4,300 to $5,100 and remains within a short-term descending channel. James Easton said the Russell 2000 pattern could offer a roadmap for Ethereum.

    If ETH breaks above the falling channel, traders would first watch the previous all-time-high region. A confirmed move above roughly $5,100 could place Ethereum in price discovery.

    The data also points to a speculative long-term path toward five-figure levels, including prices above $10,000. Even so, the outcome remains unconfirmed.

    ETF Outflows Add Pressure on Price

    Ethereum’s weakness also comes from continued ETF outflows. On June 23, Ethereum ETFs recorded $82 million in net outflows, their fourth straight day of withdrawals. Market caution has grown amid uncertainty tied to Iran and the outlook for U.S. interest rates. ETH also fell below its 200-day simple moving average, which signals short-term weakness.

    Analysts say some bulls want to see ETH break above $1,800 before momentum returns. Others point to the broader support near $1,500 as the key line to defend.

    The asset traded at an all-time high of $4,953.73 on August 24 of last year. For now, the market continues to watch whether Ethereum can reclaim nearby resistance around $1,900 to $2,000.

    What’s Next?

    Ethereum remains under pressure as ETF outflows persist and the price trades below key resistance levels. At the same time, the $1,500 support zone continues to hold, preserving the broader recovery structure. Traders now focus on whether ETH can defend support and regain momentum above $1,800 while keeping longer-term targets in view.