Tag: business intelligence

  • Top AI Skills Employers Will Demand Most in 2026

    Top AI Skills Employers Will Demand Most in 2026

    The artificial intelligence job market is heating up, and employers are already signaling which skills will be most valuable in 2026. From engineering robust AI systems to ensuring ethical governance, professionals who master these competencies will stand out. Here are the top AI skills that will shape career opportunities in the near future.

    AI Engineering

    Employers are prioritizing professionals who can build, deploy, optimize, and maintain scalable AI systems. Expertise in modern frameworks, cloud platforms, and automation tools is essential for this role.

    Prompt Engineering

    Crafting accurate prompts for generative AI models dramatically improves productivity, workflow automation, content quality, and enterprise AI application performance. This skill is becoming a cornerstone of efficient AI use.

    Machine Learning

    Strong machine learning expertise remains critical for developing predictive models, improving algorithms, handling large datasets, and solving complex business challenges effectively.

    Data Engineering

    Organizations are seeking experts who can manage data pipelines, ensure data quality, handle storage, integrate systems, and process information reliably to support AI model training and deployment.

    AI Governance

    As AI adoption grows, businesses increasingly value professionals who can ensure ethical AI practices, regulatory compliance, transparency, risk management, and responsible deployment across enterprise environments.

    Python Programming

    Python continues to be the preferred language for AI development, enabling automation, model building, data analysis, and seamless integration with AI frameworks efficiently.

    Cloud AI Platforms

    Experience with cloud-based AI services helps professionals deploy scalable applications, optimize infrastructure costs, and accelerate enterprise AI implementation across industries.

    Natural Language Processing (NLP)

    NLP expertise enables organizations to create advanced chatbots, language models, intelligent search systems, and multilingual customer engagement solutions successfully.

    Business Intelligence

    Employers favor professionals who combine AI knowledge with business intelligence to transform analytics into strategic decisions, operational improvements, and measurable organizational growth.

  • 7 Key Business Intelligence Strategies for Data-Driven Executives in 2026

    7 Key Business Intelligence Strategies for Data-Driven Executives in 2026

    Key Takeaways

    • A strong data-driven culture leads to faster and more confident business decisions.
    • Self-service BI and standardized KPIs improve efficiency across every department.
    • Trusted data governance forms the foundation for successful AI and business intelligence initiatives.

    Business intelligence delivers the highest value when it becomes part of daily business decisions instead of an occasional reporting tool. Many companies spend large amounts on dashboards, software, and analytics platforms, but real success depends on how often leaders use data before they make important choices. A company with a strong data culture does not rely on opinions alone. Sales numbers, customer behavior, operational performance, and financial reports all help shape every decision.

    Even today, many organizations have not reached this level. Research from IBM shows that only 29% of employees actively use analytics and business intelligence tools, even though companies continue to invest in them. This gap means valuable business data often remains unused. Research from Forrester also found that only about 20% of enterprise decision-makers regularly perform self-service analytics. Most business users still depend on IT teams or data specialists for reports, which slows down important decisions. Modern executives who encourage wider use of business intelligence often gain a stronger competitive position as faster access to information supports faster action.

    Give Business Teams Direct Access to Insights

    Business intelligence should not stay limited to analysts or technical experts. Sales managers, finance teams, marketing professionals, and operations leaders all need quick access to reliable information. Self-service business intelligence allows employees to explore dashboards, review reports, and answer business questions without waiting for another department. Industry research shows that around 70% of organizations consider self-service business intelligence essential for better performance. Companies that provide self-service analytics generate more than twice the business value from their analytics investments compared with organizations that do not. Research also reports that a typical business intelligence implementation can deliver approximately 127% return on investment within three years. These numbers show that faster access to information does more than save time—it creates measurable financial value and improves the speed of business decisions across the organization.

    Build Strong Data Governance Before AI Expansion

    The increasing importance of artificial intelligence technology in companies is notable; however, the success of this technology depends heavily on the data. Poor-quality data often produces unreliable results, regardless of the technology. Before implementing AI projects, businesses need to have a clear definition of data quality, data security, data ownership, and data consistency. According to academic research, effective practices in data governance, metadata management, data discoverability, and data literacy support successful business intelligence and data democratization. Moreover, industry experts claim that AI project implementation can be effective only if trusted business intelligence practices associated with data quality, data governance, and data lineage have been established beforehand. Failure to adopt these practices can result in unreliable business intelligence processes, duplicate reports, inaccurate data, and poor business decisions.

    Improve Data Literacy Across Leadership

    Business intelligence software alone cannot improve decisions. Leaders also need the ability to understand charts, compare trends, question unusual results, and identify important business patterns. Data literacy has become an essential leadership skill as executives now face larger amounts of information than ever before. Current research highlights a significant knowledge gap. Only 24% of executives hold data literacy certification, while just 32% of executives report confidence in making meaningful use of data. These numbers show that many business leaders still struggle to convert information into practical decisions. Organizations that invest in executive education often improve both decision quality and confidence as leaders better understand the numbers that guide business strategy.

    Measure Business Results Instead of Dashboard Activity

    Many companies judge business intelligence success by the number of reports they produce or dashboards they launch. However, these measurements rarely show real business value. Better indicators include higher revenue, lower operating costs, stronger customer retention, improved productivity, and faster decision-making. Research from Boston Consulting Group shows a clear difference between high-performing organizations and others. Companies that lead in data and artificial intelligence have successfully scaled four times more business use cases than slower competitors. These leading organizations also generate five times greater financial impact from their investments in data and AI. These results demonstrate that successful business intelligence creates measurable business outcomes rather than larger collections of reports.

    Combine Artificial Intelligence with Business Intelligence

    Modern business intelligence platforms now include artificial intelligence features that help leaders discover trends, identify risks, and ask questions through natural language instead of complex technical queries. AI does not replace business intelligence. Instead, it expands its value by making data easier to understand and faster to analyze. Executive adoption continues to rise. McKinsey reports that 53% of C-level executives regularly use generative AI at work, compared with 44% of middle managers. This trend shows that senior leadership increasingly views AI as an important business tool. McKinsey also estimates that artificial intelligence could contribute $4.4 trillion in long-term productivity gains across enterprise use cases. Organizations that combine trusted business intelligence with responsible AI place themselves in a stronger position to improve efficiency and support future growth.

    Create Common Business Metrics Across Every Department

    Different departments often calculate business performance in different ways. Sales may define revenue differently from finance, while marketing may track customer acquisition through separate methods. These differences create confusion during executive meetings and reduce confidence in business reports. A common set of key performance indicators helps every department measure success through the same standards. Revenue, profitability, customer growth, operating costs, and employee productivity should follow consistent definitions across the organization. IBM research continues to identify inconsistent business metrics and low business intelligence adoption as major barriers to better decision-making. Standardized KPIs solve this problem since every leader works from the same trusted source of information.

    Expand Business Intelligence Across the Organization

    When more individuals use legitimate information, business intelligence provides greater value. Information should inform and support decision-making in such areas as sales, customer service, financial management, marketing, operations, supply chain management, and human resources, rather than being available to analysts alone. Current global industry data indicates that 67% of the global workforce has some access to business intelligence tools, but the overall rate of adoption of BI worldwide is at about 26%. The gap shows that many employees have access but do not use these systems frequently in their daily work. Organizations that motivate employees to use BI regularly in different departments have positive outcomes in such business areas as collaboration improvement and performance strengthening. In today’s competitive environment, adoption of business intelligence will continue being one of the most significant advantages for the executives of modern companies.

  • Agentic Analytics vs. Text-to-SQL: Choosing the Right AI Data Analysis Approach

    Agentic Analytics vs. Text-to-SQL: Choosing the Right AI Data Analysis Approach

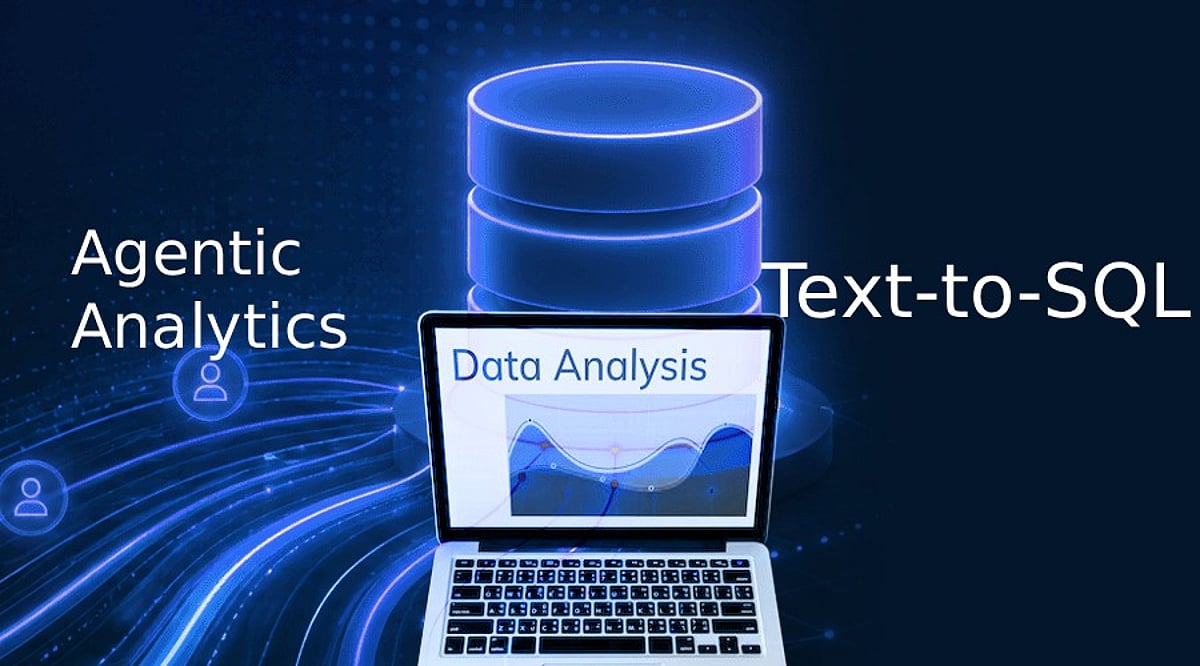
    Artificial intelligence has transformed how organizations analyze data. Instead of relying solely on data analysts to write SQL queries and generate reports, users can now ask questions in natural language and get answers in seconds. Two key technologies driving this shift are Text-to-SQL and Agentic Analytics, but they serve very different purposes.

    What is Text-to-SQL?

    Text-to-SQL uses language models to convert natural language questions into SQL statements. For example, a user might ask, “Which products sold best in June?” The AI generates the appropriate SQL query, runs it against the database, and returns results. This approach makes database interaction easier for non-technical users, reduces dependence on analysts for simple queries, and speeds up reporting. However, the process ends once the query is executed.

    What is Agentic Analytics?

    Agentic Analytics goes far beyond query generation. It employs AI agents that understand business objectives, break them into multiple tasks, retrieve data from various systems, perform calculations, validate outputs, generate charts, and explain findings in plain language. Instead of just answering the question asked, an agent can identify trends, detect anomalies, investigate root causes, and suggest next steps. This makes Agentic Analytics ideal for organizations dealing with large, complex, and dynamic datasets.

    Agentic Analytics vs. Text-to-SQL: Key Differences

    • Scope: Text-to-SQL focuses on translating questions into database queries. Agentic Analytics covers the entire analytical workflow, from planning to recommendation.
    • Automation: Text-to-SQL requires manual query initiation. Agentic Analytics can work autonomously once a goal is set.
    • Output: Text-to-SQL returns raw query results. Agentic Analytics delivers insights, visualizations, and actionable recommendations.
    • Complexity: Text-to-SQL is simpler to deploy for structured databases. Agentic Analytics handles multi-source, multi-step analyses.

    Which One Should Businesses Choose?

    Text-to-SQL remains valuable for organizations that need faster access to structured databases. It allows employees to extract data without SQL knowledge and lightens the load on data teams. It is easy to implement and works well for standard reporting.

    However, for advanced analytics requirements, Agentic Analytics is the better fit. Companies that work with data from multiple departments need more than SQL capabilities—they need an AI system that can gather data, apply business rules, produce visualizations, and make recommendations. Agentic Analytics also excels in automation: users can state a high-level goal, such as analyzing declining sales or understanding customer churn, and let the AI agent handle the rest.

    The Future of AI-Powered Analytics

    It is unlikely that one approach will dominate. Most organizations will use both: Text-to-SQL for quick database queries and Agentic Analytics for deeper analysis and forecasting. As AI algorithms improve, the focus shifts from simply accessing information to generating actionable intelligence. Agentic Analytics represents the future of enterprise analytics, while Text-to-SQL remains a powerful tool for efficient database exploration.

    Frequently Asked Questions

    What is Agentic Analytics?
    Agentic Analytics uses AI agents to perform complete analytical workflows, generate insights, validate results, and recommend business actions automatically.
    What does Text-to-SQL do?
    Text-to-SQL converts natural language questions into SQL queries, enabling users to retrieve database information without writing SQL manually.
    Which is better for enterprise data analysis?
    Agentic Analytics suits enterprises needing automation, reasoning, and multi-source analysis, while Text-to-SQL excels at straightforward database querying.
    Can Agentic Analytics replace Text-to-SQL?
    Not entirely. Many organizations use both together: Text-to-SQL for queries and Agentic Analytics for deeper insights and automated decision-making.
    Is Text-to-SQL suitable for non-technical users?
    Yes. Text-to-SQL enables business users to access database information using everyday language instead of complex SQL syntax.
  • 10 Must-Use Microsoft Copilot Capabilities in Power BI for Faster Data Insights

    10 Must-Use Microsoft Copilot Capabilities in Power BI for Faster Data Insights

    Businesses generate more data than ever before. The real challenge is not collecting information but understanding it quickly. Microsoft Copilot in Power BI makes this process much easier. It uses artificial intelligence to help users build reports, analyze data, write DAX formulas, and find useful insights with simple text commands.

    Instead of spending hours creating dashboards or hunting for critical numbers, users can ask Copilot questions in everyday language. It understands the request and delivers useful answers within seconds. Microsoft continues to enhance Copilot with new features that make Power BI more accessible for beginners and more productive for experienced professionals.

    Here are ten Microsoft Copilot features that can help you get more value from Power BI.

    1. Create Reports with Simple Instructions

    Building a report usually takes time because users need to select charts, arrange visuals, and organize information. Copilot makes this task much easier. You only need to type a request like, “Create a sales report that shows monthly revenue, profit, and regional performance.” Copilot understands the request and creates a report with suitable charts and layouts. This feature saves time and helps users who have little experience with Power BI. It also produces reports with a clean, professional design.

    2. Write DAX Formulas Easily

    Many Power BI users find DAX formulas difficult because they require special syntax and functions. Copilot removes much of this difficulty. Instead of writing formulas from scratch, users can explain what they need in plain English. For example, they can ask Copilot to calculate yearly sales growth or total profit. Copilot creates the DAX formula and also explains what it does. This speeds up report development and helps users learn DAX more easily.

    3. Get Quick Data Summaries

    Large reports often contain many charts and tables. Finding the most important information can take time. Copilot reads the report and creates a simple summary of the main insights. It points out important trends, top-performing products, changes in sales, and unusual results. This helps managers and business leaders understand reports without having to study every chart.

    4. Ask Questions in Everyday Language

    Another key selling point of Copilot is its natural language capability. Instead of drilling down through filters or creating new charts, you can type a request like, “What product has sold the most in the last quarter?” or “Show Europe revenue.” Copilot understands what you need and provides the appropriate data via the best-matched visual. This makes understanding data much easier for those less familiar with technology.

    5. Explain Charts and Business Numbers

    Sometimes a report shows numbers without explaining what they mean. Copilot helps by describing charts, business metrics, and key performance indicators in simple language. It explains why a value changed and what the result may mean for the business. This helps everyone understand reports more clearly and supports better business decisions.

    6. Improve Semantic Models

    A semantic model is the foundation of every Power BI report. A well-organized model makes reports faster and easier to manage. Copilot helps developers improve these models by suggesting better relationships between tables, recommending useful measures, organizing fields, and improving names. These improvements reduce mistakes and make future report development much easier.

    7. Create Measure Descriptions Automatically

    Good documentation helps teams understand reports long after they are created. However, many developers skip this step because it takes extra time. Copilot can automatically create descriptions for measures, calculated columns, and important business metrics. These descriptions explain what each item does in clear language. This makes reports easier to maintain and helps new team members understand the data model more quickly.

    8. Make Existing Reports Better

    Many organizations already have Power BI reports, but not all of them provide the best user experience. Copilot reviews existing reports and suggests useful improvements. It may recommend better chart types, clearer layouts, improved readability, or additional business metrics that can provide more value. Microsoft has also improved Copilot so it first studies the report before checking the data model, providing more accurate recommendations and answers.

    9. Find Business Trends Faster

    Business data often contains important patterns that are easy to miss. Copilot automatically looks for major changes such as sales growth, revenue decline, seasonal trends, customer behavior, and unusual values. It highlights these findings without requiring users to search through every report page. This helps businesses react faster to opportunities and potential problems.

    10. Use AI to Build Better Reports

    Microsoft continues to expand Copilot with AI-powered report authoring. This feature helps users throughout the report creation process. Copilot suggests report structures, recommends suitable visuals, checks report quality, and supports the publishing process. Instead of creating everything manually, users receive intelligent guidance throughout report development. This makes report creation faster, easier, and more consistent for both new and experienced Power BI users.

    Latest Microsoft Copilot Updates for Power BI

    Microsoft continues to add new capabilities to Copilot in Power BI and Microsoft Fabric. Recent updates make Copilot more accurate by allowing it to understand the report before it analyzes the data model. Microsoft has also expanded AI support for semantic model editing, which allows users to create measures, relationships, and model changes through natural language. It is also improving AI-powered report authoring to help users plan, validate, and publish reports more efficiently.

    Final Thoughts

    Copilot reshapes your experience of working in Power BI. It simplifies tasks, accelerates report creation, and makes business data easy to grasp. Whether you’re generating a report, crafting a DAX query, identifying trends, refining a semantic model, or explaining business results to a broader audience — Copilot helps you at every stage. As new capabilities are added, the power of Copilot in the context of data-driven decision-making will only increase. Organizations that invest in these AI capabilities now can boost productivity, produce higher-quality reports, and accelerate better decisions with Power BI.

  • 10 Essential Data Science Concepts to Master in 2026

    10 Essential Data Science Concepts to Master in 2026

    Data science has evolved rapidly, and professionals who want to stay ahead must master a blend of foundational skills and emerging technologies. Here are the ten most important concepts to learn in 2026, covering Python, statistics, SQL, machine learning, generative AI, data engineering, cloud computing, MLOps, and business intelligence.

    1. Python

    Python remains the dominant language for data science due to its readability and extensive library ecosystem. Key skills include functions, classes, object-oriented programming, error handling, decorators, and context managers. Essential libraries: NumPy, Pandas, Polars, Matplotlib, Seaborn, Plotly, Scikit-learn, PyTorch, TensorFlow, and JAX.

    2. Mathematics

    Mathematics underpins every machine learning model. Focus on linear algebra (vectors, matrices, PCA), calculus (derivatives, gradient descent), probability (Bayes’ theorem, distributions), and statistics (hypothesis testing, A/B testing, ANOVA).

    3. SQL

    SQL is critical for querying databases. Beyond basic SELECT statements, learn CTEs, window functions, indexes, and views. Modern cloud data warehouses like Snowflake, BigQuery, and Redshift, plus lakehouse technologies like Delta Lake, are increasingly important.

    4. Machine Learning

    Machine learning enables pattern recognition and prediction. Supervised methods include linear regression, random forests, and gradient boosting. Unsupervised techniques include K-Means, PCA, and t-SNE. Model evaluation metrics like precision, recall, F1 score, and cross-validation are essential.

    5. Deep Learning

    Deep learning powers modern AI with architectures like CNNs for images, RNNs and LSTMs for sequences, and Transformers for language and generation. Mastering these enables advanced pattern detection and classification.

    6. Generative AI

    Generative AI builds on deep learning to create content. Key techniques include Retrieval-Augmented Generation (RAG), fine-tuning, LoRA, PEFT, and RLHF. AI agents and function calling allow models to perform autonomous tasks, making them central to business AI applications.

    7. MLOps

    MLOps ensures models are deployable and maintainable. Tools like Git, MLflow, Docker, Kubernetes, and CI/CD pipelines are vital. Cloud platforms (AWS, Azure, GCP) enable scalable deployment and monitoring for drift and performance issues.

    8. Cloud Computing

    Cloud platforms provide the infrastructure for data processing, storage, and AI at scale. Familiarity with AWS, Azure, or Google Cloud, along with services like S3, Lambda, and BigQuery, is increasingly required for data science roles.

    9. Business Intelligence

    Visualization and communication turn data into actionable insights. Tools like Tableau, Power BI, Looker, and Apache Superset help create dashboards that convey key metrics. Clear reporting supports better decision-making.

    10. Emerging Concepts

    Stay ahead with emerging fields like Responsible AI, Synthetic Data, Causal AI, Time Series AI, Multimodal AI, and AI agents. Combining these with strong fundamentals in Python, mathematics, and SQL will provide the best career opportunities in 2026.


    FAQs:

    1. Why learn data science in 2026? These skills align with current industry demands and future AI roles.
    2. Is Python still the best language? Yes, due to its simplicity and powerful libraries.
    3. Do I need math? Yes, for understanding model mechanics.
    4. What new skills matter? Generative AI, RAG, and MLOps are key.
    5. Can beginners start? Yes, begin with Python, SQL, and statistics, then progress to more advanced topics.
  • Top 10 Data Analytics Certifications to Boost Your Career in 2026

    Top 10 Data Analytics Certifications to Boost Your Career in 2026

    In 2026, data analytics certifications remain a powerful tool for professionals aiming to validate their skills and stand out in a competitive job market. Whether you’re a beginner or an experienced analyst, the right certification can sharpen your expertise in SQL, visualization, reporting, and business intelligence—while signaling to employers that you can solve real-world problems with data.

    Below, we break down the ten most valuable data analytics certifications for 2026, covering everything from entry-level credentials to advanced, cloud-focused designations. Each certification is chosen for its relevance, industry recognition, and practical, hands-on focus.

    1. Google Data Analytics Professional Certificate

    An excellent starting point for beginners, this certification covers the fundamentals: cleaning data in spreadsheets, writing SQL queries, creating basic visualizations, and translating numbers into actionable business insights. No prior technical background is required, making it a solid first step toward a career in analytics.

    2. Microsoft Power BI Data Analyst Associate

    Ideal for business intelligence professionals, this certification focuses on data preparation, modeling, dashboard creation, and DAX (Data Analysis Expressions). It’s a perfect fit for organizations already using Microsoft products and needing skilled report creators.

    3. CompTIA Data+

    A vendor-neutral certification that covers data governance, reporting, and interpretation. It’s great for beginners who want a broad, foundational understanding of analytics without being tied to a specific platform. Data+ is especially useful for analysts who value versatility.

    4. IBM Data Analyst Professional Certificate

    This project-based certificate teaches Excel, SQL, Python, and dashboard creation. It’s designed to build practical skills and a portfolio—ideal for those who want to demonstrate hands-on ability to employers.

    5. Certified Analytics Professional (CAP)

    An advanced certification for seasoned analysts, CAP validates end-to-end analytical skills: problem formulation, methodology selection, data analysis, and business impact assessment. It’s best for professionals seeking strategic recognition in analytics.

    6. aCAP (Associate Certified Analytics Professional)

    Targeted at early-career professionals, aCAP introduces core principles, standards, and professional requirements. It’s a stepping stone for those not yet ready for the full CAP certification.

    7. Tableau Certified Data Analyst

    Focused on visualization and dashboarding, this certification proves you can connect to data, prepare it, analyze it, and communicate insights using Tableau. It’s particularly valuable for roles that require clear data storytelling.

    8. AWS Certified Data Analytics – Specialty

    For cloud-focused roles, this certification covers data pipelines, storage, analytics services, and large-scale workflow management on AWS. It’s suited for engineers and data professionals working in cloud-based environments.

    9. SAS Advanced Analytics Professional

    Essential for industries heavily reliant on SAS, this certification demonstrates advanced statistical and analytical abilities. It’s highly relevant for sectors like healthcare, finance, and insurance where SAS is a standard tool.

    10. Cloudera Certified Associate Data Analyst

    Relevant for big data environments, this certification validates SQL analysis and querying on Cloudera platforms. It’s ideal for analysts working with large datasets who need to prove their competence in handling massive data volumes.

    The Road Ahead

    In 2026, data analytics certifications are valued for their practical, hands-on focus. Employers prioritize credentials that prove real skill in SQL, dashboards, cloud tools, and business thinking. While certifications alone won’t guarantee a job, they give candidates a strong edge when combined with portfolio projects and real-world experience. The best strategy: choose one focused certification, build a portfolio, and demonstrate you can solve actual business problems with data.

    FAQs

    Which data analytics certification is best for beginners?
    Google Data Analytics Professional Certificate and IBM Data Analyst Professional Certificate are excellent beginner-friendly choices because they cover SQL, spreadsheets, visualization, and practical analytics skills through hands-on projects.

    Do employers value data analytics certifications in 2026?
    Yes. Certifications remain valuable because they demonstrate verified technical skills, especially when combined with practical experience, portfolio projects, and the ability to solve real business problems using data.

    Which certification is best for Power BI professionals?
    The Microsoft Power BI Data Analyst Associate certification is ideal for professionals working with dashboards, data modeling, DAX, reporting, and business intelligence using Microsoft’s analytics ecosystem.

    Is AWS Data Analytics certification suitable for beginners?
    No. AWS Certified Data Analytics – Specialty is better suited for professionals with cloud analytics experience and knowledge of AWS services, data pipelines, and large-scale data processing environments.

    Are certifications enough to get a data analytics job?
    Certifications improve your resume, but employers also expect practical projects, SQL knowledge, visualization skills, problem-solving ability, and experience demonstrating how you analyze and communicate business insights effectively.

  • Best Data Mining Courses and Certifications to Master in 2026

    Best Data Mining Courses and Certifications to Master in 2026

    Data mining is growing fast as companies look for better ways to turn large volumes of data into useful decisions. Market estimates by Mordor put it at $1.66 billion in 2026, rising to $2.82 billion by 2031, which reflects an 11.25% CAGR. A different prediction suggests that the tools will be worth $1.2 billion by 2026, rising from $634.7 million in 2020, at a CAGR of 11.1%. Consistent growth proves high demand for skills like data cleaning, pattern detection, and predictive analysis.

    With data driving decisions across industries, the right training can help you build the skills needed to stay relevant, practical, and job-ready.

    Top 10 Courses to Build Data Mining Skills

    Professional Certificate in Data Mining: Coursera (University Specialization)

    A hands-on concentration that addresses preprocessing, association rules, clustering, classification, and modeling evaluation through Python and R. This degree involves a capstone project in which you apply what you have learned from real data sets and receive guidance from instructors.

    Data Mining and Business Intelligence: Indian Statistical Institute Certificate

    This course emphasizes statistical foundations and pattern discovery, with a strong focus on business workflows and decision support. It’s suited to analysts who want rigorous theory combined with applied business intelligence techniques.

    Advanced Data Mining Bootcamp: Simplilearn ProTrack

    A bootcamp course focused on scaling mining techniques, feature engineering, and deployment through the use of Spark and MLlib in the cloud.

    Data Mining with Python: DataMites Professional Course

    A brief, hands-on course focused on applying Python tools and packages like pandas and scikit-learn. This is an ideal choice for quick upskilling and preparation for technical interviews.

    Applied Data Mining: University Capstone on Coursera

    Hands-on project-based learning course taking students through the full process of working with raw data: cleansing, discovering patterns, making predictions, and presenting results.

    Certificate in Data Mining & NLP with R: Online Provider

    This combined course covers structured data mining plus text mining and NLP in R, including preprocessing, topic modeling, and sentiment analysis methods for unstructured datasets common in industry projects.

    Postgraduate Diploma in Big Data Science: University Programs (IIT-level)

    A diploma integrating data mining with big-data engineering and distributed algorithms. It’s tailored for professionals aiming to move into scalable analytics or data engineering roles that require both theory and systems knowledge.

    Data Mining Professional: Vendor-Neutral Certification

    A recognized credential focused on algorithmic understanding, evaluation metrics, and cross-industry case studies. This certification helps validate conceptual mastery independent of specific vendor tools.

    Full-Stack Data Science with Data Mining Specialization: Scaler / InterviewBit

    A curriculum combining software engineering best practices with mining tasks: production ML pipelines, feature stores, experiment tracking, and deployment. It’s ideal for engineers building end-to-end machine learning systems.

    Data Mining Essentials: Short Course (Knowledge Academy)

    A concise course on the basics of association rules, clustering, and classification. This will be a good starting point for those who want to go further into projects and more advanced courses.

    Choosing the Right Course

    Data mining is an essential skill for careers in data science, analytics, and machine learning. Whether you’re just starting out or looking to advance your expertise, choosing a course with hands-on projects, industry-relevant tools, and a recognized certification can help you stay competitive and prepare for real-world data challenges.

    FAQs

    Q1. What is a data mining course?

    A data mining course teaches techniques for collecting, cleaning, analyzing, and interpreting large datasets using statistical methods, machine learning, and programming tools like Python to uncover meaningful patterns and support decision-making.

    Q2. Who should enroll in a data mining certification?

    Data mining certifications are suitable for students, data analysts, software developers, business intelligence professionals, and anyone looking to build practical data analytics skills or transition into data science careers.

    Q3. Which programming language is best for learning data mining?

    Python is the most widely recommended language for data mining because of its extensive libraries, ease of use, and strong support for data analysis, visualization, machine learning, and automation.

    Q4. Are online data mining courses recognized by employers?

    Yes, reputable online courses from universities and established learning platforms are valued by many employers, especially when they include hands-on projects, industry-relevant tools, and recognized certification credentials.

    Q5. How do I choose the right data mining course?

    Choose a course based on your experience level, career goals, curriculum, practical projects, instructor expertise, certification value, and coverage of essential tools like Python, SQL, and machine learning frameworks.

  • Your Complete Data Analytics Cheat Sheet: Excel, SQL, Python, and Power BI

    Your Complete Data Analytics Cheat Sheet: Excel, SQL, Python, and Power BI

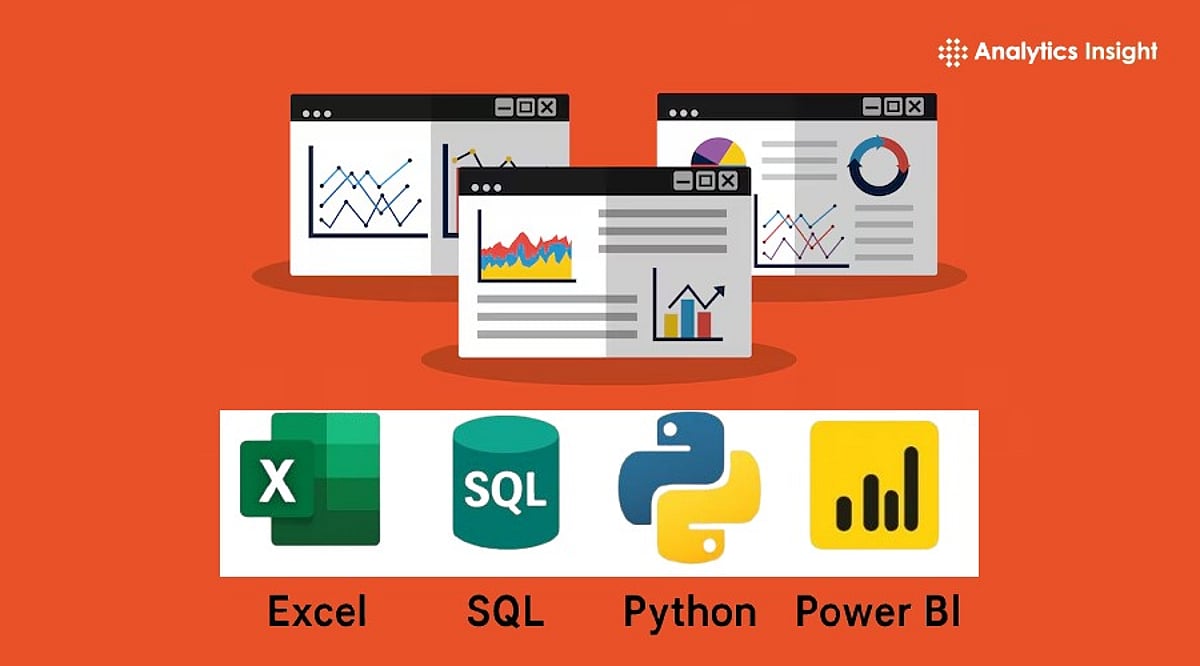
    Data analytics is the process of examining data to uncover useful insights. Every organization collects vast amounts of information daily—sales figures, customer feedback, website traffic, and growth metrics. Companies leverage this data to make smarter decisions and plan ahead. Mastering data analytics is a highly sought-after skill, and employers increasingly value professionals who can work across multiple tools. The four most popular tools in this domain are Excel, SQL, Python, and Power BI. Each serves a distinct purpose: Excel handles calculations and reporting; SQL retrieves data from databases; Power BI transforms data into visual dashboards; and Python manages large datasets and complex analyses. This guide provides a concise cheat sheet covering essential formulas, commands, and functions for these tools.

    Excel Cheat Sheet

    Excel remains a staple for everyday data analysis due to its simplicity and versatility. It is widely used for creating reports, analyzing numbers, and organizing information. Key formulas include SUM, AVERAGE, COUNT, MIN, and MAX for basic calculations; IF for conditional logic; XLOOKUP and VLOOKUP for searching large tables; and INDEX and MATCH for advanced lookups. Essential features include Pivot Tables to summarize data, Conditional Formatting to highlight key values, Power Query for data cleaning, and Data Validation to prevent input errors. Industry surveys indicate that over 75% of data professionals still use Excel daily.

    SQL Cheat Sheet

    SQL (Structured Query Language) is the standard for working with relational databases. Most businesses store critical data in databases, and SQL enables quick and efficient retrieval. Core commands include SELECT, FROM, WHERE, ORDER BY, GROUP BY, HAVING, DISTINCT, and LIMIT. Joins are crucial: INNER JOIN returns matching records; LEFT JOIN returns all records from the left table; RIGHT JOIN returns all from the right; and FULL OUTER JOIN returns all from both. Advanced features include Common Table Expressions (CTEs), CASE statements, subqueries, window functions (ROW_NUMBER, RANK, DENSE_RANK, LEAD, LAG). SQL remains indispensable because most business data resides in databases.

    Python Cheat Sheet

    Python is a powerful programming language for data analysis, valued for its readability and extensive library ecosystem. The top five libraries are Pandas (data manipulation), NumPy (numerical operations), Matplotlib and Plotly (visualization), and Scikit-learn (machine learning). Key Pandas commands include read_csv(), head(), info(), describe(), shape, columns, groupby(), merge(), sort_values(), drop_duplicates(), and fillna(). Python excels at data cleansing, automation, statistical analysis, and building AI models.

    Power BI Cheat Sheet

    Power BI, a Microsoft business intelligence tool, converts raw data into interactive charts, reports, and dashboards. Core components include Power Query (data preparation), Data Model (table relationships), DAX (formulas), Visualizations (charts), Dashboards, and Power BI Service (cloud sharing). Common chart types are bar, line, column, pie, maps, KPI cards, matrix tables, and slicers. According to Microsoft, Power BI is used by over 375,000 organizations and has more than 30 million monthly active users, reflecting its widespread adoption.

    Latest Trends in Data Analytics

    Data analytics continues to evolve with emerging technologies. Artificial intelligence accelerates analysis, enabling tools to answer business questions via natural language instead of code. Cloud technology facilitates storage and processing of massive datasets. Real-time reporting is increasingly common as organizations demand up-to-the-minute insights. Enhanced data security and self-service analytics are also top priorities. Industry experts highlight AI-powered analytics, robust data governance, and accessible business intelligence as the biggest current trends.

    Final Thoughts

    A comprehensive data analytics cheat sheet saves time and streamlines workflows. Excel handles numerical tasks and reporting; SQL retrieves database information; Python manages large-scale and advanced analysis; Power BI creates clear visual dashboards. Together, these four tools cover every essential aspect of data analytics. Mastering them builds a solid foundation for a successful career in today’s data-driven world.

    Frequently Asked Questions

    1. What is a data analytics cheat sheet? A quick reference guide summarizing important formulas, commands, and functions for popular analytics tools.
    2. Why is Excel important for data analytics? It helps organize data, perform calculations, create reports, and identify trends using simple formulas and built-in features.
    3. Why should SQL be part of data analytics skills? SQL enables access, filtering, and analysis of data stored in databases, which most businesses rely on daily.
    4. What is Python used for in data analytics? Python is used for data cleaning, task automation, visualization, statistical analysis, and building machine learning models.
    5. Why do companies use Power BI? Power BI transforms raw data into clear dashboards and reports, helping businesses understand information and make better decisions.
  • Top 10 Data Visualization Interview Questions for 2026: Expert Answers & Tips

    Top 10 Data Visualization Interview Questions for 2026: Expert Answers & Tips

    Introduction

    Data visualization has evolved beyond simple chart creation. Recruiters now look for candidates who can transform complex data into actionable business insights. Whether you’re a Data Analyst, Business Intelligence professional, or Product Analyst, this guide covers the most common interview questions, sample answers, and preparation tips to help you stand out.

    1. What Is Data Visualization?

    Sample Answer: Data visualization is the graphical representation of information using charts, maps, graphs, and dashboards. It helps users quickly identify patterns, trends, and outliers that might go unnoticed in raw data, enabling faster and more informed decision-making.

    2. Which Data Visualization Tools Have You Used?

    Sample Answer: I have hands-on experience with Microsoft Power BI, Tableau, Excel, Google Looker Studio, and Python libraries such as Matplotlib, Seaborn, and Plotly. My choice of tool depends on project requirements—Power BI for enterprise reporting, Tableau for exploratory analysis, and Python for custom visualizations.

    3. How Do You Choose the Right Chart?

    Sample Answer: The chart type should match the story the data tells. Bar charts compare categories; line charts show trends over time; pie charts display simple proportions; scatter plots reveal relationships between variables; and maps visualize geographic data. I always prioritize clarity and ease of interpretation.

    4. What Makes a Good Dashboard?

    Sample Answer: A good dashboard is simple, organized, and aligned with business objectives. It highlights key performance indicators (KPIs), avoids unnecessary clutter, uses consistent colors, and allows users to find information quickly. Every element should serve a decision-making purpose.

    5. What KPIs Have You Displayed in Dashboards?

    Sample Answer: KPIs vary by industry. Common examples include revenue, sales growth, customer acquisition cost, conversion rate, customer retention, profit margin, inventory levels, and website traffic. The dashboard should always show metrics that directly support stakeholder decisions.

    6. How Do You Handle Large Datasets?

    Sample Answer: I clean data by removing redundant fields, apply data modeling, create summary tables, and use filters. To boost performance, I implement incremental refresh, optimized SQL queries, and efficient calculations. Pre-aggregation and indexing also help maintain speed.

    7. What Are Common Data Visualization Mistakes?

    Sample Answer: Frequent mistakes include using too many colors, choosing the wrong chart type, displaying unnecessary information, poor labeling, overcrowded dashboards, ignoring accessibility, and misleading scales or axes. Keeping visuals simple and purposeful improves readability and trust.

    8. How Do You Ensure Data Accuracy?

    Sample Answer: I cross-check dashboard values against original data sources, validate calculations, and test filters and business logic with stakeholders. Before publishing, I conduct user testing to confirm numbers meet business expectations and that no errors exist.

    9. Can You Explain a Dashboard You Built?

    Sample Answer: I built a sales performance dashboard that integrated data from multiple regions. It displayed revenues, profits, monthly sales trends, and product performance. Filters allowed drill-down by region, product category, and sales representative, enabling regional managers to identify opportunities quickly.

    10. How Do You Present Insights to Non-Technical Stakeholders?

    Sample Answer: I avoid technical jargon and focus on business implications. Instead of explaining how I calculated the numbers, I discuss what the data shows, why it matters, and what actions should be taken. Clear, story-driven communication turns data into decision fuel.

    Tips to Perform Better in Data Visualization Interviews

    • Build two or three dashboard projects for your portfolio.
    • Practice explaining dashboards in simple, non-technical language.
    • Learn when to use different chart types and why.
    • Understand basic data modeling concepts (star schema, measures, dimensions).
    • Review common KPIs for your target industry.
    • Be ready to discuss design decisions, not just technical features.

    Real project experience often makes a stronger impression than theoretical knowledge.

    Final Thoughts

    Data visualization interviews go beyond technical proficiency. Employers want candidates who understand the business context, communicate insights effectively, and empower decision-makers. By preparing these common questions and practicing with real dashboards, you can demonstrate both your technical skills and business mindset.

    FAQs

    What are the most common data visualization interview questions?

    Most interviews cover chart selection, dashboard design, KPI tracking, data storytelling, visualization tools, handling large datasets, ensuring data accuracy, and explaining insights to stakeholders. Both technical knowledge and communication skills are assessed.

    Which tools should I learn before an interview?

    Power BI, Tableau, Excel, Google Looker Studio, and Python libraries (Matplotlib, Seaborn, Plotly) are widely used. Mastering at least one enterprise BI tool and understanding dashboard fundamentals significantly improves readiness.

    How should I answer questions about dashboard design?

    Focus on simplicity, business relevance, and usability. Explain how you prioritize KPIs, maintain consistent formatting, avoid clutter, and design for quick trend identification and informed decision-making.

    How can I explain technical insights to non-technical stakeholders?

    Avoid jargon and emphasize business outcomes. Explain what the data shows, why it matters, and what action to take. Clear communication is as important as technical expertise in analytics roles.

    Do I need a portfolio for a data visualization interview?

    Yes. A portfolio with dashboards, reports, and real-world projects demonstrates practical skills. Recruiters value hands-on experience and problem-solving ability more than certifications alone.

  • Top 10 Business Intelligence Dashboard Tools for 2026: Power BI, Tableau, and More

    Top 10 Business Intelligence Dashboard Tools for 2026: Power BI, Tableau, and More

    Data is one of the most valuable assets for modern businesses, but its true worth lies in how effectively it is analyzed and presented. Dashboard tools enable companies to transform large datasets into visual insights, driving faster and smarter decisions. Whether tracking sales trends, monitoring operations, or analyzing financial performance, Business Intelligence (BI) platforms have become essential for organizations of all sizes.

    With the growing volume of data generated daily, dashboard applications have evolved from simple reporting tools into powerful decision-making engines. Here are the top 10 BI dashboard tools to consider in 2026.

    1. Microsoft Power BI

    Microsoft Power BI remains a top choice for businesses seeking a balance of cost efficiency, flexibility, and analytics. Its deep integration with Microsoft products like Excel, Azure, and Dynamics 365 makes it especially valuable for organizations already in the Microsoft ecosystem.

    2. Tableau

    Tableau is renowned for its robust data visualization capabilities. Users can create interactive dashboards without coding skills, making it a favorite among analysts and executives who need deep insights from complex data.

    3. Looker

    Looker, a Google Cloud platform, focuses on reliable reporting through a semantic layer that centralizes metric definitions. This eliminates inconsistencies and is ideal for organizations with cloud-based infrastructure.

    4. Qlik Sense

    Qlik Sense uses an associative engine to explore relationships between data points, allowing users to navigate data freely without being limited by predefined queries.

    5. ThoughtSpot

    ThoughtSpot is a pioneer in AI-driven analytics, enabling users to type business questions in plain language and receive instant answers through dashboards and reports.

    6. Sisense

    Sisense specializes in embedded analytics, helping organizations integrate dashboard functionality into their own applications and digital products, sharing insights with customers and employees seamlessly.

    7. Domo

    Domo is designed for real-time insights, pulling data from multiple sources into interactive dashboards that provide up-to-the-minute performance metrics via its cloud platform.

    8. SAP Analytics Cloud

    SAP Analytics Cloud combines BI, planning, and predictive analytics, particularly for companies already using SAP software. Its strong data integration capabilities keep everything aligned.

    9. IBM Cognos Analytics

    IBM Cognos Analytics remains a reliable choice for large-scale, multi-tenant reporting. It offers solid governance, automation, and consistent performance even under heavy workloads.

    10. Zoho Analytics

    Zoho Analytics has gained popularity among cost-conscious businesses for its affordability, AI-powered reporting, and rich integrations. Its user-friendly dashboards make it an excellent starting point for companies new to data analytics.

    Choosing the Right Dashboard Tool

    The best tool depends on company size, budget, and IT architecture. Power BI excels in versatility, Tableau leads in visualization, Looker integrates well with Google Cloud, and ThoughtSpot is ideal for AI-driven insights. Sisense is perfect for embedded analytics, while Zoho Analytics is a sensible choice for small businesses.

    BI dashboards have evolved far beyond simple charts. Today, they help predict future trends and enable quick, informed actions based on real-time data.