Tag: cryptocurrency

  • Hyperliquid Open Interest Hits $11.51B as HIP-3 and RWA Perpetuals Surge; HYPE Falls Below $60 on Unstaking Pressure

    Hyperliquid Open Interest Hits $11.51B as HIP-3 and RWA Perpetuals Surge; HYPE Falls Below $60 on Unstaking Pressure

    Hyperliquid’s open interest has surged to $11.51 billion, marking its highest level this year, even as broader crypto leverage remains sharply below levels seen in October 2025. The platform’s growth is driven by HIP-3 markets and real-world asset (RWA) perpetuals, which now dominate activity. Meanwhile, HYPE has fallen below $60 after major unstaking moves by Multicoin Capital and Selini Capital, adding downward pressure during a broader market weakness.

    HIP-3 Markets Reshape Hyperliquid Activity

    According to Coinglass, total crypto market open interest stands at $116.66 billion, still 47% below the October 10 level. In contrast, Hyperliquid has expanded its open interest to $11.51 billion, the highest since the crash when Bitcoin traded near $100,000. The platform’s HIP-3 framework, launched on October 13, 2025, enables anyone staking 500,000 HYPE to deploy perpetual markets without approval from the core team. This has led to a surge in RWA perpetuals, which now account for $3.61 billion in daily open interest, making them Hyperliquid’s largest single category. RWA perpetuals have overtaken Bitcoin, HYPE, and other layer-one tokens, and now generate half of daily perpetual volume, up from just 3% at the start of the year.

    Market Share Grows as Rivals Contract

    Hyperliquid’s share of perpetual open interest relative to major centralized exchanges has reached a record 9.5%, according to Hypeflows data, up from 6.9% in late May. However, its open interest remains about 23% below its October 2025 peak of nearly $15 billion. Binance, Bybit, and Gate.io have contracted more sharply during the post-crash deleveraging, so the market-share increase reflects a smaller contraction rather than a direct migration of traders. Notably, TradeXYZ, built by Hyperunit, controls more than 90% of HIP-3 open interest, meaning one venue carries close to one-third of Hyperliquid’s total open interest. HIP-3 markets sit outside Hyperliquid’s native liquidity pool, with deployers controlling oracle quality, margin settings, and liquidity provision. This concentration raises questions about stability as competing exchanges enter the same category.

    CEX Competition and Unstaking Pressure on HYPE

    Binance has entered the space with a SpaceX pre-IPO perpetual contract on May 21 and added seven U.S. equity and ETF perpetuals on July 9, offering leverage up to 25x. These contracts bring centralized-exchange liquidity into a category Hyperliquid previously dominated. Meanwhile, HYPE fell below $60 to $58, dropping 7.31% in 24 hours, approaching a key support level. On-chain data shows Multicoin Capital unstaked 1.96 million HYPE worth about $120 million from three wallets after nearly two months of staking. The wallets involved are 0x57c6d4bd52f592a265f59b595a905b04c848174b, 0xab319403e72c5e97c65ef70031bab8827efc5297, and 0xd4d56a30a4a745f8ba732e8b453b7066260fbc10. While unstaking does not confirm a sale, it makes tokens transferable and available for exchange deposits or reallocations. Selini Capital also recently unstaked about 504,000 HYPE, worth roughly $31 million, adding another large withdrawal.

    Conclusion

    Hyperliquid open interest reached $11.51 billion as HIP-3 markets and RWA perpetuals drove stronger platform activity. Meanwhile, HYPE fell below $60 after major unstaking moves by Multicoin Capital and Selini Capital. Market participants should watch support levels, liquidity concentration, and further large-holder activity.
  • Bitcoin, Ethereum, and XRP Price Outlook: Key Breakout Levels to Watch

    Bitcoin, Ethereum, and XRP Price Outlook: Key Breakout Levels to Watch

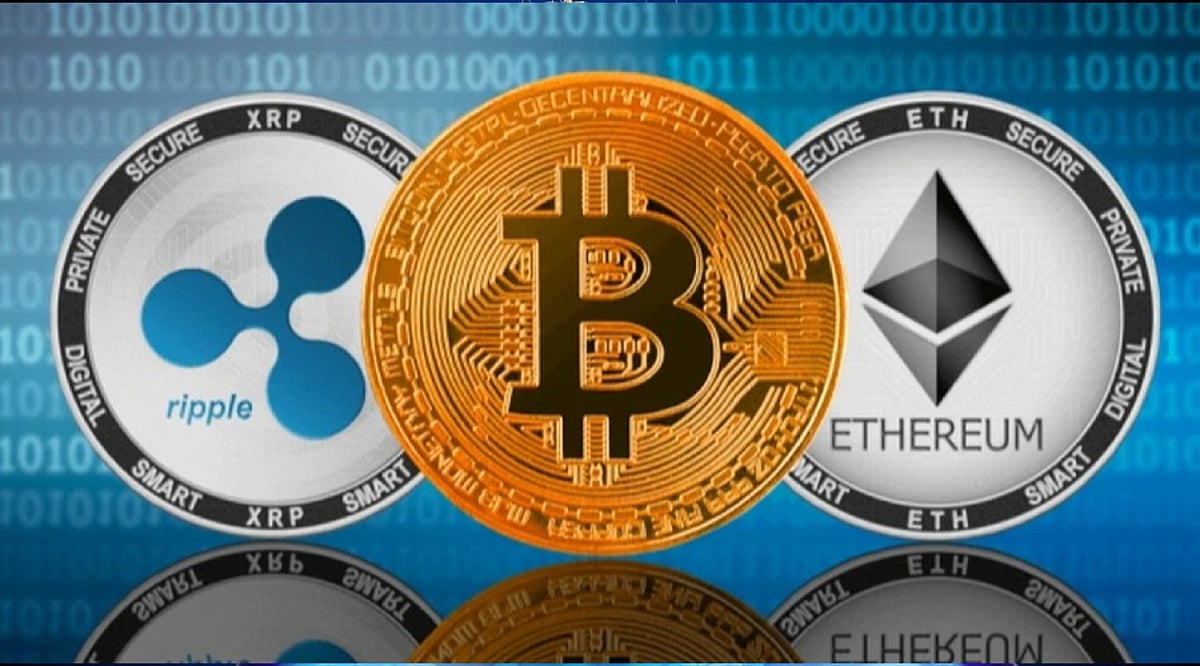
    Bitcoin (BTC), Ethereum (ETH), and Ripple (XRP) are all trading in the red today, with BTC leading the decline by 1%. The CoinMarketCap Fear and Greed Index stands at 39, well below neutral territory, indicating that sellers remain dominant in the market.

    Bitcoin Moves Closer to 50-Day EMA

    BTC is currently trading at $65,591.55, down 1.01% in the last 24 hours, though it remains up 1.42% over the past seven days. With a second consecutive day of decline, Bitcoin is edging lower toward the 50-day Exponential Moving Average (EMA) at $65,108. Technically, BTC is capped below the key resistance at $67,253. A decisive close above this level could push the asset toward the 100-day EMA at $67,525 in the near term, followed by the 200-day EMA at $73,780.

    Momentum indicators continue to show an uptrend. The Relative Strength Index (RSI) stands at 57.35, while the Moving Average Convergence Divergence (MACD) and its signal line remain above their zero line, suggesting ongoing bullish pressure. On the downside, immediate support is seen at $65,108. As long as BTC remains above this level, the bullish structure remains intact. However, a break below would expose a deeper correction toward the psychologically important $60,000 level.

    Ethereum Holds Near-Term Bullish Bias

    ETH continues to trade above the $1,900 level, maintaining a near-term bullish bias as it stays above the 50-day EMA at $1,830.2. The asset is moving toward the 100-day EMA at $1,936.5 and the psychologically crucial $2,000 level, which form successive resistance barriers followed by the 200-day EMA at $2,192.

    The RSI stands at 63.45, indicating bullish momentum without overbought conditions, while the MACD remains in positive territory, suggesting buyers remain in control. On the downside, immediate support is at the 50-day EMA ($1,830.2), and a deeper correction could take the asset toward $1,531.1.

    XRP Just Below the 50-Day EMA

    XRP is trading at $1.13 on Thursday with a corrective bias below the 50-day EMA at $1.1448, and remains well below the 200-day EMA at $1.4343. The asset has bounced from last week’s low of $1.06, but breakout attempts are capped by the overhead moving-average structure.

    Momentum indicators show improving conditions: RSI at 54.94 (bullish bias, not overbought), while MACD and signal line are moving upward with the histogram expanding positively. Immediate resistance is at the 50-day EMA ($1.1448), followed by $1.15. On the downside, initial support is at $1.11, then $1.06, and if selling accelerates, the psychologically important $1 level could be tested.

    Why This Matters

    Persistent seller dominance and a Fear and Greed Index of 39 keep major cryptocurrencies under pressure. Holding key 50-day EMAs across Bitcoin, Ethereum, and XRP is critical to preventing a broader market breakdown toward deeper support levels.

    FAQs

    1. Why is Bitcoin testing its 50-day EMA important?

    The 50-day EMA often acts as a key dynamic support during an uptrend. Holding above this level could preserve Bitcoin’s bullish structure, while a breakdown may trigger a deeper correction toward the $60,000 psychological support.

    2. What are the key resistance levels for Ethereum?

    Ethereum faces immediate resistance near the 100-day EMA at $1,936.5, followed by the $2,000 psychological level. A sustained move above these levels could pave the way toward the 200-day EMA near $2,192.

    3. What does the Fear & Greed Index of 39 indicate?

    A reading of 39 suggests the market is in the “Fear” zone. This typically reflects cautious investor sentiment, although prolonged fear has historically preceded potential buying opportunities in crypto markets.

    4. What should traders watch for in XRP?

    XRP is trading just below its 50-day EMA at $1.1448, making this the immediate resistance level. A successful breakout above it could strengthen bullish momentum, while failure may see the token revisit support around $1.11 and $1.06.

    5. Which technical indicators support the current outlook?

    The Relative Strength Index (RSI) for BTC, ETH, and XRP remains above 50, indicating positive momentum. Meanwhile, the MACD stays in positive territory across all three cryptocurrencies, suggesting buyers continue to retain medium-term control despite recent price weakness.

  • Solana Rebounds to $78: Can SOL Break the $80 Resistance Level?

    Solana Rebounds to $78: Can SOL Break the $80 Resistance Level?

    Solana (SOL) has recovered to the $78 price level, drawing renewed attention from cryptocurrency investors. After a brief period of weak price action, buyers have returned with increased confidence, and traders are now watching the critical $80 resistance level. The recovery reflects not only improved market sentiment but also sustained belief in Solana’s long-term potential, aided by gains in Bitcoin and Ethereum.

    Why the $80 Level Matters

    The $80 mark is the key short-term target for SOL. A decisive break above this level could trigger fresh buying interest, with analysts eyeing the next resistance zone between $85 and $90. However, if buyers fail to push the price above $80, SOL may retest support in the $72–$75 range before another attempt. Rising trading volume during the recovery indicates growing market participation.

    Solana’s Network Growth Continues

    Beyond price, Solana’s blockchain is experiencing robust growth. More developers are building projects on the network, and user adoption is increasing across payments, decentralized finance (DeFi), token creation, and digital assets. The Solana Foundation continues to enhance developer tools, network security, and scalability, enabling the blockchain to handle higher activity without sacrificing speed.

    Stablecoin Growth Shows Real Demand

    Stablecoins are a vital part of Solana’s ecosystem, with the network now hosting over $15 billion in stablecoin supply, led by USDC. This large asset base demonstrates user trust for real transactions, powering lending platforms, decentralized exchanges, and payment systems.

    DeFi Continues to Expand

    Solana ranks among the largest blockchains by decentralized exchange trading volume and supports billions in total value locked (TVL). Low transaction fees and fast settlement attract both individual users and businesses seeking quick, affordable financial operations.

    Real-World Asset Tokenization Gains Traction

    Financial companies are exploring Solana for tokenizing real-world assets (RWAs) such as government securities and private credit. The network’s speed and low costs make it an attractive platform for traditional finance moving into digital assets.

    Institutional Interest Rises

    Large investors are increasingly including SOL in crypto investment products and blockchain indexes. Financial institutions study Solana for payment systems and asset tokenization, valuing its technology beyond token price. This institutional interest adds long-term support.

    Fast Transactions Give Solana an Edge

    Solana processes hundreds of transactions per second with minimal fees, making it ideal for decentralized exchanges, payments, gaming, and consumer apps. Ongoing infrastructure upgrades improve validator software, developer tools, and network reliability.

    Can SOL Move Above $80?

    Multiple catalysts could help SOL break the $80 resistance: continued Bitcoin strength, increasing blockchain activity, higher stablecoin inflows, growing institutional interest, and rising DeFi adoption. However, investors should monitor potential profit-taking near resistance, market volatility, and regulatory developments.

    Why This Matters

    Solana’s price recovery reflects more than short-term excitement. Strong ecosystem growth, rising stablecoin activity, and higher institutional interest point to real adoption. If these trends persist, SOL could attract more investors, strengthen its position among leading blockchains, and boost broader crypto market confidence.

    Final Thoughts

    Solana continues to attract users and financial interest. With over $15 billion in stablecoins, expanding DeFi, and growing real-world asset tokenization, the blockchain’s fundamentals are solid. If buyers push SOL higher and ecosystem growth keeps pace, Solana may gain enough momentum for a sustained rally.

    FAQs

    1. Why is the $80 level important for Solana?
    The $80 level is a major resistance zone. A breakout above it could trigger stronger buying momentum.
    2. What supports Solana’s recent recovery?
    Growing ecosystem activity, higher stablecoin supply, stronger DeFi usage, and improving market sentiment.
    3. How much stablecoin supply does Solana hold?
    Solana currently hosts more than $15 billion in stablecoin supply, led by USDC.
    4. Why are institutions interested in Solana?
    Institutions value Solana for its fast transaction speeds, low fees, and growing role in tokenization and blockchain finance.
    5. Can SOL reach higher prices after $80?
    If SOL breaks and holds above $80, analysts believe the next resistance area could fall between $85 and $90, though market conditions remain important.
  • Bitcoin Drops to $65,390 Amid Intense Selling Pressure; $65,000 Becomes Crucial Support

    Bitcoin Drops to $65,390 Amid Intense Selling Pressure; $65,000 Becomes Crucial Support

    Bitcoin Breaks Below $65,500 Support

    Bitcoin experienced a sharp sell-off on July 23, falling below the critical $65,500 support level. The price currently sits at $65,390, signaling a bearish shift in short-term momentum. Sellers regained control after buyers failed to sustain an earlier recovery, pushing the cryptocurrency lower on heavy volume.

    Technical Breakdown Confirms Bearish Momentum

    The daily chart shows Bitcoin trading in a narrow range between $65,600 and $65,750 before a long red candle broke below support. This breakdown occurred on above-average volume, confirming the move’s strength. The price now sits below all major short-term moving averages, a classic sign that sellers hold the upper hand.

    RSI Signals Oversold Conditions

    The Relative Strength Index (RSI) has dropped to 28.6, placing Bitcoin in oversold territory. While this suggests selling pressure may be exhausted, it does not guarantee an immediate rebound. In strong downtrends, the RSI can remain below 30 for extended periods. Buyers must demonstrate the ability to reclaim key resistance levels before any recovery gains traction.

    Key Price Levels to Watch

    • Resistance: $65,620 (short-term moving average), $65,760 (consolidation zone), $65,860 (long-term moving average convergence).
    • Support: $65,300 (immediate), $65,000 (psychological level), $64,800 (next downside target).

    If Bitcoin fails to hold above $65,300, the market may quickly test $65,000. A break below that could open the door to $64,800. Conversely, reclaiming $65,620 would improve sentiment, and a move above $65,860 could signal a return to the $66,000–$66,300 range.

    Market Sentiment and Institutional Flows

    Today’s decline has made traders cautious. Despite Bitcoin’s relative strength compared to altcoins in recent weeks, this sell-off raises fresh concerns. Investors continue to monitor US economic data, inflation numbers, and Federal Reserve policy, which remain key drivers for both crypto and traditional markets.

    On the positive side, US spot Bitcoin ETFs have recorded consecutive net inflows after a period of heavy withdrawals. However, these inflows are still modest compared to outflows earlier this year, indicating that institutional investors are returning cautiously.

    Volume Confirms Selling Conviction

    Trading volume spiked during the decline, confirming that the sell-off was driven by genuine selling pressure rather than noise. Volume will be a critical signal going forward: strong buying volume near $65,300 or $65,000 could support a recovery, while another wave of heavy selling may extend the decline.

    Short-Term Outlook

    Bitcoin’s short-term trend favors sellers. A recovery is possible, but buyers must first reclaim $65,620. Until then, the market remains vulnerable to further downside. Key events such as ETF flow data, regulatory news, or macroeconomic surprises could trigger the next major move.

  • Bitget Expands to New Zealand With Financial Services Provider Registration

    Bitget Expands to New Zealand With Financial Services Provider Registration

    Bitget, the world’s largest Universal Exchange (UEX), has officially entered the New Zealand market by registering as a Financial Services Provider on the country’s Financial Service Providers Register (FSPR).

    The registration strengthens Bitget’s financial services framework, covering key service categories such as foreign currency exchange, domestic and cross-border money transfers, client asset custody, portfolio and money management, and the execution of financial product or foreign exchange transactions on behalf of clients.

    In addition to the FSPR registration, Bitget has joined the New Zealand Insurance and Financial Services Ombudsman (IFSO) Dispute Resolution Scheme. This independent scheme provides eligible customers with an external channel to raise and resolve disputes related to participating financial service providers.

    This move is part of Bitget’s broader strategy to build the operational and compliance infrastructure required for its expanding range of financial products, including traditional market instruments, foreign exchange services, and tokenized real-world assets.

    “Financial platforms need compliance structures that can support a wider mix of assets and services,” said Gracy Chen, CEO of Bitget. “The registration adds another layer to our international financial services framework as the platform continues connecting digital assets with established markets.”

    The Universal Exchange model brings crypto assets, tokenized stocks, commodities, foreign exchange, and other financial products into a single trading platform. Bitget continues to develop its services through registered entities and qualified partners across different jurisdictions.

    Disclaimer: Product availability remains subject to applicable laws, local requirements, and regional eligibility. Registration on the FSPR does not constitute an endorsement, approval, or guarantee by the New Zealand Government, the Financial Markets Authority (FMA), or the Registrar of Financial Service Providers.

  • Ethereum Staking Hits Record 39 Million ETH, Tightening Supply and Boosting Network Security

    Ethereum Staking Hits Record 39 Million ETH, Tightening Supply and Boosting Network Security

    Ethereum has reached a historic milestone as the amount of ETH locked in staking hits an all-time high. Fresh on-chain data reveals that nearly 39 million ETH — over 32% of the total circulating supply — is now securing the network. This surge in staking activity reflects growing investor confidence and is creating a significant supply squeeze that could support future price gains.

    Key Takeaways

    • More than 39 million ETH (over 32% of total supply) is now staked.
    • Lower exchange reserves and ongoing token burning continue to tighten Ethereum’s available supply.
    • Rising institutional participation signals strong long-term confidence in Ethereum.

    Record Staking Levels

    Just a few months ago, the staking ratio stood near 30%. Since then, millions of additional ETH have entered validator contracts. The steady climb shows that long-term investors view Ethereum as an asset with future growth potential rather than a short-term trade. Despite price volatility across the broader crypto market, commitment to staking remains high.

    Supply Squeeze Intensifies

    Once ETH is staked, it leaves the active market and cannot be freely traded unless the owner exits the validator system. As more coins move into staking, the amount available on exchanges shrinks. This lower supply could become a critical factor if buying demand increases. Many market analysts believe this supply shortage could support Ethereum’s price over time, especially if investor interest continues to grow.

    Strong Validator Demand

    The demand to join Ethereum’s validator network remains robust. More than 3 million ETH is currently waiting in the validator entry queue, meaning thousands of investors are willing to stake despite a waiting period of several weeks. At the same time, the exit queue is very small, indicating that most participants are committed to staking rather than moving their ETH back to the market.

    Institutional Adoption Accelerates

    Large financial institutions are a key driver behind this record. Investment firms, digital asset management companies, crypto treasury firms, and professional staking providers continue to expand their Ethereum reserves. Rather than simply holding ETH, many institutions now stake their coins to earn rewards while awaiting long-term price appreciation. This influx of institutional funds further reduces the amount of liquid ETH available for trading.

    EIP-1559 Burn Mechanism Adds Pressure

    Ethereum’s fee-burning mechanism, introduced with EIP-1559, permanently removes a portion of every transaction fee from circulation. During periods of high network activity, the amount of ETH burned can match or exceed the number of newly minted coins. When record staking combines with ongoing token burning, the available supply becomes even tighter.

    Exchange Balances Keep Falling

    The amount of ETH held on exchanges has continued to decline as investors move coins into staking platforms or private wallets. Lower exchange balances generally reduce immediate selling pressure, since fewer coins are ready for quick sales. While this alone doesn’t guarantee higher prices, it strengthens the overall supply squeeze. If demand rises while exchange reserves remain low, price movements could become much more pronounced.

    Liquid Staking Makes Participation Easier

    The introduction of liquid staking technology has been a major catalyst for the surge in staking. Liquid staking services allow investors to stake ETH without losing access to their funds. After staking, they receive liquid staked tokens that represent their original ETH, enabling continued use in DeFi and other applications.

    Network Upgrades Improve Efficiency

    Recent Ethereum upgrades, including the Pectra upgrade, have introduced technical improvements that simplify validator operations and allow larger validator balances. These changes reduce operational complexity for large staking providers while maintaining network security. Better infrastructure makes Ethereum more attractive for institutions managing significant capital, supporting further growth in staking participation.

    What This Means for Ethereum’s Future

    With over 32% of Ethereum’s total supply locked in staking, liquid ETH on exchanges is hitting historic lows. As institutional adoption and tokenization demand grow, this structural supply squeeze could significantly amplify future upward price movements. Short-term prices will still depend on broader economic conditions and overall crypto sentiment, but the long-term supply picture continues to tighten. If demand rises through exchange-traded funds, decentralized finance, tokenization projects, or corporate treasury purchases, the limited supply of available ETH could place additional upward pressure on prices.

    Ethereum now stands in a stronger position than at any previous point in its proof-of-stake era. Record staking participation not only improves network security but also removes millions of coins from active circulation. As this trend continues, Ethereum’s shrinking liquid supply may become one of the most important factors shaping its future market performance.

    Frequently Asked Questions

    How much ETH is currently staked?

    Nearly 39 million ETH, representing more than 32% of Ethereum’s circulating supply, is currently staked.

    What is an Ethereum supply squeeze?

    A supply squeeze happens when less ETH remains available for trading as more coins are locked in staking or removed from circulation.

    Why are institutions staking Ethereum?

    Institutions stake ETH to earn staking rewards while holding the asset for potential long-term price appreciation.

    How does Ethereum reduce its supply?

    Ethereum burns a portion of every transaction fee through the EIP-1559 mechanism, permanently removing ETH from circulation.

    Could higher staking affect ETH prices?

    If demand continues to increase while available supply remains limited, the supply squeeze could support higher ETH prices over time.

    Disclaimer: This article is for informational purposes only and does not constitute financial advice. Cryptocurrency investments carry risk. Always do your own research before making investment decisions.

  • XRP Stays Below $1.20 Despite 70M Token Whale Buy: What’s Next for Ripple?

    XRP Stays Below $1.20 Despite 70M Token Whale Buy: What’s Next for Ripple?

    XRP remains under the $1.20 price mark even after large investors purchased around 70 million XRP tokens in the past week. This strong buying activity typically signals confidence from major holders, but the token has not yet broken through this resistance level.

    The price recently recovered from lows near $1.05 and now trades around $1.10 to $1.12. Even with this recovery, XRP faces pressure near the $1.20 zone. Many traders are watching to see whether the token can finally move above this level or continue trading within its current range.

    Whale Buying Shows Confidence

    Blockchain data from Santiment shows that addresses holding between 1 million and 10 million XRP accumulated nearly 70 million tokens during the week. After this buying spree, the total XRP held by these wallets rose to 3.83 billion units.

    Large investors, often called whales, typically accumulate cryptocurrencies when prices are stable rather than waiting for major price increases. This behavior raises interest because it implies a positive outlook on the coin.

    A further positive development comes from Binance. According to CryptoQuant, the exchange’s XRP reserves have dropped to a five-month low. A decline in exchange-held tokens can reduce immediate selling pressure because fewer assets are available for trading.

    Price Still Faces Resistance

    Despite increased whale buying, XRP has not broken through the resistance zone between $1.12 and $1.20.

    The nearest support area sits between $1.05 and $1.08. As long as the price stays above this zone, the market structure remains stable. A fall below this level could put more pressure on the token.

    Technical indicators present a balanced picture. The Relative Strength Index (RSI) remains close to 50, indicating that buyers and sellers have nearly equal control. At the same time, the MACD indicator has turned positive, which may suggest improving momentum but does not confirm a strong rally yet.

    Market analysts also note that XRP has formed a series of higher lows above $1.00. This pattern often appears before a larger price move if buying demand continues to grow.

    Futures Market Shows More Interest

    Data from CoinGlass shows that XRP futures open interest has reached about $2.5 billion, indicating increased activity in the derivatives market. Higher open interest usually means fresh money has entered the market rather than traders simply closing old positions.

    Market data also highlights a large number of short positions between $1.12 and $1.14. If XRP moves above this range, many short sellers may close their trades, potentially pushing the price even higher in a short period.

    Ripple Continues to Expand Its Ecosystem

    The company remains focused on cross-border payments, blockchain technology, and financial partnerships. These efforts support the long-term use of XRP across the payment industry.

    Ripple’s stablecoin, RLUSD, has also received more attention. Binance recently introduced an XRP rewards campaign connected to RLUSD, helping more users learn about Ripple’s growing ecosystem.

    Market Conditions Matter

    Recent inflation data from the United States has raised hopes that central banks may reduce pressure on financial markets. This outlook has helped improve confidence across digital assets. Bitcoin has also stayed relatively stable, which often supports large altcoins such as XRP.

    Even so, overall trading volume remains lower than levels seen during previous bull markets. Many investors are waiting for a stronger reason before committing more money.

    Why This Matters

    Accumulation of 70 million XRP by major whales signals strong institutional conviction despite immediate price resistance. Lower exchange supply and surging futures activity suggest an impending volatility expansion that could trigger a significant trend shift.

    What Could Happen Next

    A strong move above this resistance could open the path toward $1.30 to $1.40 if the broader crypto market also stays positive. If the price fails to move above $1.20, XRP may continue to trade between $1.05 and $1.20 for some time.

    The recent purchase of 70 million XRP by whale wallets, lower exchange reserves, higher futures activity, and steady technical signals all point toward better market confidence. However, a clear breakout above $1.20 remains necessary before the next major rally can begin. Until that happens, XRP is likely to remain in a phase of consolidation while investors watch for the next big move.

  • Bitcoin Surpasses $65,000 as ETF Inflows Surge and Market Sentiment Recovers

    Bitcoin Surpasses $65,000 as ETF Inflows Surge and Market Sentiment Recovers

    Bitcoin climbed above the key $65,000 resistance level on Wednesday as ETF inflows increased and market sentiment moved out of fear. BTC traded near $66,267, almost 15% above its lowest level this year. The move placed Bitcoin near its highest level since June 16. It also brought the $70,000 mark back into focus as the price approached the upper boundary of an ascending channel.

    ETF Inflows Support Bitcoin’s Recovery

    United States spot Bitcoin ETFs recorded $203 million in inflows on Tuesday. That marked the sixth consecutive day of net inflows across the funds. Over the six days, the ETFs attracted more than $928 million. Monthly inflows reached over $628 million and could exceed $1 billion if the current pace continues.

    The latest activity follows two difficult months for the products. The funds lost more than $4.5 billion last month and another $2.4 billion one month earlier. Demand also spread across several altcoin ETFs. Ethereum ETFs added more than $37 million on Tuesday, lifting their monthly total to $309 million.

    Meanwhile, XRP ETFs gained $12.3 million this month. Solana ETFs recorded about $13 million over the same period. Investors have returned after Bitcoin’s steep decline from its previous peak. At this year’s low, the cryptocurrency had fallen 55% from its October high.

    Fear and Greed Index Moves Toward Neutral

    The Crypto Fear and Greed Index rose from 17 to 40. That shift moved the market from extreme fear into neutral territory. The gauge tracks price momentum among the ten largest cryptocurrencies. It also measures implied volatility, put-and-call activity, and social media trends.

    Historically, Bitcoin has often recovered after the index entered extreme fear. It has also weakened when the gauge reached greed or extreme greed. Can Bitcoin maintain its rebound as sentiment improves and ETF demand continues?

    Several major institutions have issued bullish forecasts. Standard Chartered expects Bitcoin to reach $100,000, while Bernstein has set a $150,000 target. Strategy has also avoided further Bitcoin sales after selling more than $200 million earlier this month. The company has made no additional sales since then.

    Technical Pattern Puts $70,000 in Focus

    Bitcoin has moved higher within an ascending channel on the four-hour chart. The price now trades near the channel’s upper boundary. BTC also moved slightly above the 50-period exponential moving average. In addition, the chart formed an inverted head-and-shoulders-like pattern.

    That pattern often appears before further price gains. Still, recent market action shows that Bitcoin’s rebound has started to lose momentum. Further gains would require a clear move above the channel’s upper boundary. Such a breakout would place the psychological $70,000 level next on the chart.

    Conclusion

    Bitcoin’s move above $65,000 reflects renewed ETF demand, improving market sentiment, and stronger technical positioning. However, momentum remains near a key channel boundary, making $70,000 the next major test. Investors should monitor ETF flows and wait for a confirmed breakout before assessing further gains.

  • Ethereum Supply Tightens as ETF Inflows and Staking Demand Surge

    Ethereum Supply Tightens as ETF Inflows and Staking Demand Surge

    Ethereum traded near $1,915 on July 22 as staking demand, spot ETF inflows, and network activity contrasted with continued price weakness. ETH remains about 60% below its August 2025 record near $4,950. However, more than one-third of its supply now supports network validation. Can tightening supply and renewed institutional demand offset Ethereum’s prolonged market weakness?

    Validator Demand Locks More ETH from Circulation

    Ethereum’s validator exit queue has fallen to zero, with almost no waiting period for participants seeking to withdraw staked ETH. The queue previously reached about 2.67 million ETH in September 2025.

    By contrast, the entry queue holds approximately 2.49 million ETH. New validators face waiting periods of about 43 days before joining the network. The gap reflects stronger demand to stake ETH than to leave.

    Ethereum now has about 885,000 active validators securing more than 40.9 million ETH. That amount represents nearly 33.56% of the circulating supply. The staking annual percentage rate stands near 2.64%.

    As more ETH enters staking, less supply remains immediately available for exchange activity. Ethereum also removes transaction fees from circulation through its EIP-1559 burning system during periods of stronger network use.

    Corporate treasuries and staking-focused institutions have also increased deposits into the entry queue. Their participation reduces liquid supply while allowing holders to receive staking income during uncertain market conditions.

    Spot Ethereum ETFs Record Renewed July Inflows

    US spot Ethereum ETFs returned to positive flows during July after earlier losses and eight consecutive weeks of outflows. SoSoValue recorded about $38.09 million in inflows on July 20. The products received another $37.47 million on July 21, followed by further positive sessions. BlackRock’s ETHA fund frequently accounted for a large share of the renewed demand.

    Cumulative net inflows into US spot Ethereum ETFs have reached about $10.48 billion since launch. Meanwhile, total assets across the products recently exceeded $13 billion. These products provide regulated ETH exposure for institutions, advisers, and retirement portfolios. Several funds also offer staking-linked yields, which allow investors to combine asset exposure with recurring returns.

    ETF issuers often purchase and hold ETH to support their products. Therefore, sustained inflows can remove more tokens from open markets and add steady demand during periods of limited supply.

    Builders Remain Active as Retail Sentiment Weakens

    Retail sentiment has remained cautious throughout 2026 as Ethereum lagged Bitcoin and faced competition from faster blockchain networks. Social data has also shown low visibility and high levels of negative commentary.

    However, Ethereum’s active-address and network-use figures remain close to levels recorded during earlier expansion periods. Stablecoins and decentralized finance applications continue to generate activity across Ethereum and its Layer-2 networks.

    Developer participation also remains among the industry’s strongest. Teams continue working on upgrades that target higher capacity, lower costs, improved efficiency, and stronger network security.

    Ethereum also retains deep liquidity, established development tools, and broad application compatibility. Its network supports decentralized markets, stablecoins, and tokenized real-world assets across several financial sectors. ETH recovered after falling near $1,566 in late June. The asset has posted double-digit gains during July, although it continues to underperform Bitcoin and remains far below its record price.

    The $1,936 to $2,000 region now forms the nearest resistance zone. A sustained break could improve the technical structure, while the $1,800 level remains the main support area for buyers.

    Conclusion

    Ethereum’s rising staking demand, zero validator exit queue, renewed ETF inflows, and steady network activity point to strong underlying fundamentals. Although ETH remains far below its record high, tightening supply and institutional participation could support recovery. Investors should monitor ETF flows and the key $2,000 resistance level.

  • Dogecoin Trading Volume Spikes as Rare Buy Signals Appear on Weekly and Monthly Charts

    Dogecoin Trading Volume Spikes as Rare Buy Signals Appear on Weekly and Monthly Charts

    Dogecoin traded near $0.0734 on Tuesday as the broader cryptocurrency market staged a modest rebound. Rising volume, increased futures activity, and repeated buy signals from technical indicators suggested stronger participation despite still-bearish price conditions.

    Volume and Futures Open Interest Climb

    Daily trading volume surged above $1.02 billion on Tuesday, up sharply from $438 million on Monday and $336 million on Sunday. The jump indicates that more market participants entered Dogecoin positions during the latest bounce. Greater volume can provide stronger support for substantial price movements.

    Dogecoin futures open interest also rose to 15.45 billion DOGE, compared with 14.64 billion a day earlier and 12.01 billion on June 11. While open interest reflects increased activity in the derivatives market, it does not signal whether traders are betting on higher or lower prices.

    Despite the uptick in activity, overall sentiment remained weak. The Fear and Greed Index fell to 25 on Tuesday from 29 on Monday, firmly in the Extreme Fear zone. Investors continue to exercise caution even as trading volume climbs.

    Technical Indicators Suggest Stabilization

    Dogecoin’s Relative Strength Index (RSI) stands near 43, indicating weak momentum but staying above levels typically associated with deeply oversold conditions. The Moving Average Convergence Divergence (MACD) indicator shows slightly positive readings. Together, these metrics point to possible stabilization rather than a confirmed bullish reversal.

    Key support remains near $0.0709, where DOGE previously broke through a trendline. A daily close below that level could expose the token to further downside. Resistance sits near the 50-day exponential moving average (EMA) at $0.0798, with stronger barriers at the 100-day EMA ($0.0877) and 200-day EMA ($0.1047).

    A firm move above $0.075 could signal improving bullish momentum, but DOGE must overcome several technical hurdles before a broader trend reversal is confirmed.

    Rare Buy Signals on Weekly and Monthly Charts

    Crypto analyst Ali Charts reported that Dogecoin continues to generate buy signals on its weekly chart via the TD Sequential indicator. Multiple consecutive signals have appeared, forming an uncommon technical pattern that has preceded major upward moves in the past.

    On the monthly chart, trader Tardigrade noted that the Stochastic RSI entered oversold territory for the first time since the 2022 bear market. Dogecoin later recorded a substantial rally after a similar reading in 2022. The Stochastic RSI helps measure momentum and can indicate potential directional changes when combined with price action and volume.

    Dogecoin’s performance is still closely tied to Bitcoin and the broader crypto market. Exchange liquidity, retail interest, and community activity remain key drivers.

    Outlook

    Dogecoin holds near $0.0734 as rising trading volume and futures open interest suggest growing participation, while technical indicators hint at stabilization. However, the token remains below key moving averages and faces resistance around $0.075. Traders should watch the $0.0709 support level closely and monitor upcoming buy-signal confirmations.