Tag: cryptocurrency

  • Bitcoin Rebounds to $60,700, Solana Surges Past $78 as Fed Chair Warsh Eases Inflation Concerns

    Bitcoin Rebounds to $60,700, Solana Surges Past $78 as Fed Chair Warsh Eases Inflation Concerns

    Bitcoin is stabilizing above the crucial $60,000 level as long-term holders absorb heavy ETF outflows, while the upcoming US jobs report and shifting dollar strength are expected to shape the crypto market’s next major move.

    Bitcoin Price Today: $60,677

    Bitcoin is trading near $60,677, up 2.63% over the past 24 hours and holding above the $60,000 mark. The token slid to a 21-month low of $57,950 earlier this week but has since clawed back above $60,000, a level that dominated traders’ conversation through most of June.

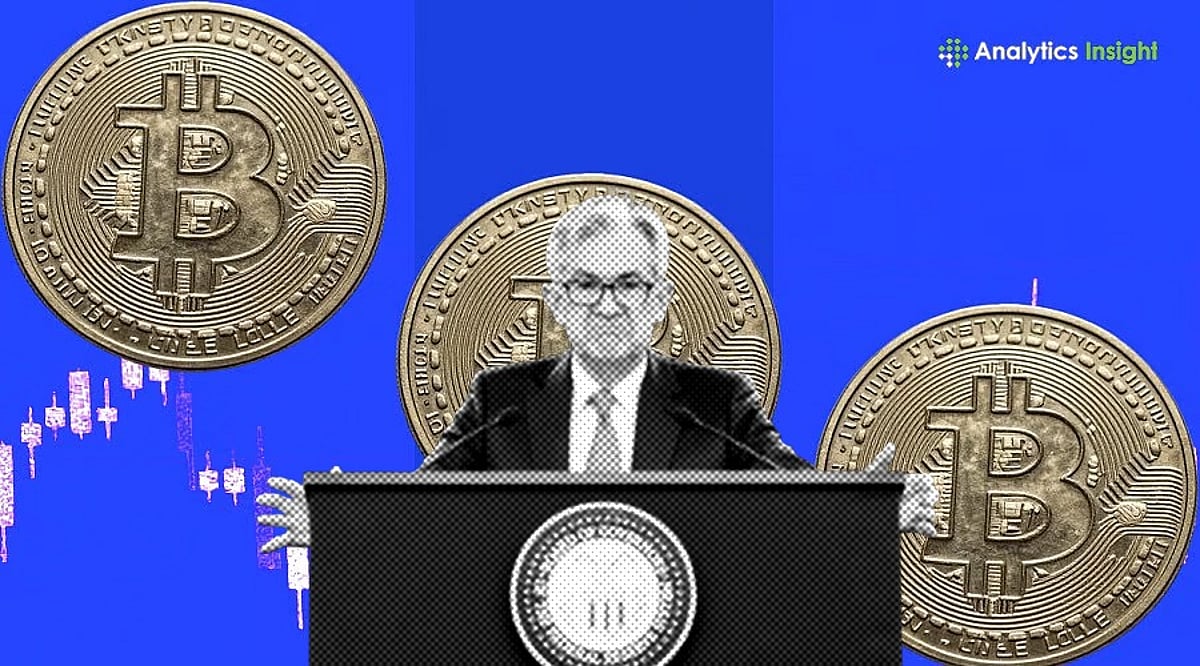
    Market sentiment improved after Fed Chair Kevin Warsh told an ECB forum panel that inflation risks appear to be easing, even as he avoided firm guidance on rate policy. A weaker US dollar and crude oil sliding to a four-month low have also removed some pressure from risk assets. Robinhood’s launch of its own public blockchain added further momentum, pulling fresh attention toward crypto infrastructure plays just as the broader market searched for a positive catalyst.

    Market Analysis and Expert Insights

    Akshat Siddhant, Lead Quant Analyst at Mudrex, noted: “Bitcoin is stabilising near the $60,000 psychological level after rebounding from a 21-month low of $57,950. A weaker U.S. dollar and crude oil prices falling to a four-month low have improved risk sentiment, helping BTC recover.” He added, “Although spot Bitcoin ETFs ended June with $4.5 billion in net outflows, long-term holders have absorbed some of the selling pressure, accumulating 270,000 BTC over the past two weeks.”

    The CoinSwitch Markets Desk commented: “BTC reclaimed the key $60K level after dipping to $58K. On the macro side, the US dollar pulled back from its highs, a tailwind for BTC. The long-dollar trade is crowded at +$34.3B, an 18-month high, hinting a dollar reversal may be near. Long-term holders added roughly 270K BTC in two weeks, showing big players are buying the dip.”

    Crypto Prices Today: Top 10 Coins at a Glance

    Based on CoinMarketCap data as of July 2:

    • Biggest Gainers: Solana leads with a 3.85% gain, followed by Hyperliquid at 2.98% and Bitcoin at 2.63%.
    • Biggest Laggards: TRON is the weakest mover among the top ten, up just 0.29%. USDC and Tether stayed near their dollar pegs.

    Crypto News Today Driving Market Sentiments

    Fed Chair Warsh Signals Cooling Inflation Risk

    Kevin Warsh told an ECB forum panel that inflation pressures appear to be easing. He declined to offer forward guidance on rates but described the upcoming July Fed meeting as likely to bring a real internal debate over policy direction. Bond yields stayed elevated after his remarks, with the 10-year Treasury near 4.50%.

    Spot Bitcoin ETFs Post Record Monthly Outflow

    US spot Bitcoin ETFs shed roughly $4.5 billion in June, their worst month since launching in January 2024. BlackRock’s IBIT absorbed a large share of the redemptions. XRP and Hyperliquid funds bucked the trend, pulling in $59.4 million and $161 million, respectively, suggesting investors are growing selective rather than exiting crypto altogether.

    Robinhood Launches Public Blockchain and Expands Crypto Suite

    Robinhood unveiled Robinhood Chain, a public layer-2 blockchain built on Arbitrum, at a London event this week. The launch brings tokenized stock trading live across more than 120 countries. A new lending product, Robinhood Earn, is part of the rollout too. Robinhood shares jumped 8% on the announcement.

    Investor and Market Outlook

    Bitcoin enters July with cautious optimism after a historically weak first half. The token fell in both Q1 and Q2, only the third time that has happened since 2018. In the two earlier instances, the second half brought little relief. July has historically been kind to Bitcoin, with the token closing green in 9 of the last 13 years, with average returns near 7.25%. That seasonal pattern, paired with Warsh’s softer tone, leaves room for further upside if ETF flows stabilize.

    Investors should track daily ETF flow data from SoSoValue and Treasury yield movement this week. Bitcoin’s ability to hold above $60,000 remains the key signal to watch. A confirmed break past $62,000 would strengthen the bullish case, while a slip under $58,000 would revive downside risk toward $55,000.
  • Bitcoin Clings to $60K as Record ETF Outflows and Dollar Strength Intensity Pressure

    Bitcoin Clings to $60K as Record ETF Outflows and Dollar Strength Intensity Pressure

    Bitcoin remained stubbornly near the $60,000 mark on July 2, 2026, as a combination of heavy institutional outflows from spot Bitcoin ETFs and a strengthening U.S. dollar kept the world’s largest cryptocurrency under pressure. After a dismal June performance, the digital asset traded within a tight range of $58,800 to $60,000, with traders closely watching the key support level.

    The total market value of Bitcoin hovered around $1.2 trillion, while daily trading volume remained robust at $38–$40 billion, signaling continued trader activity even as uncertainty dominated sentiment.

    Heavy ETF Outflows Shake Investor Confidence

    Spot Bitcoin ETFs bled a staggering $4.5 billion in outflows during June, the worst monthly withdrawal since their launch in early 2024. BlackRock’s iShares Bitcoin Trust (IBIT) and Grayscale’s Bitcoin Trust (GBTC) faced the heaviest redemptions, collectively losing roughly 71,600 BTC from their holdings. On June 30 alone, more than $220 million exited Bitcoin ETF products, highlighting persistent caution among large investors.

    These outflows have raised fresh concerns about waning institutional interest, which had previously been a major driver of Bitcoin’s upward momentum.

    Strong U.S. Dollar Adds Headwinds

    The U.S. Dollar Index (DXY) remained firm near 101.3, bolstered by expectations of strong labor market data and uncertainty around Federal Reserve interest rate cuts. A stronger dollar typically diverts capital away from riskier assets like cryptocurrencies, as investors seek safer returns in bonds and other traditional instruments.

    Citigroup Slashes Bitcoin Price Target

    Adding to the bearish sentiment, Citigroup lowered its 12-month Bitcoin price forecast from $112,000 to $82,000. The bank cited weaker ETF demand, lower institutional participation, and slower progress in crypto regulation. In a worst-case scenario, Citigroup warned Bitcoin could fall as low as $53,000 if ETF outflows persist and recession fears intensify.

    Derivatives Market Shows Mixed Signals

    Despite the broader weakness, the derivatives market displayed some resilience. Over $79 million in short liquidations occurred as traders who bet on further declines were forced to cover positions, triggering a brief price bounce. Bitcoin’s Fear and Greed Index hovered near 10, indicating extreme fear — a level that historically sometimes precedes temporary recoveries. Meanwhile, open interest in Bitcoin futures stood at roughly $44.5 billion, suggesting active trader participation.

    What’s Next for Bitcoin?

    Analysts are focused on the critical support zone between $57,700 and $58,000. A break below this level could trigger additional selling, potentially driving Bitcoin toward $55,000. Conversely, a move above $62,000 would likely restore some market confidence and set the stage for a July recovery. For now, direction hinges on ETF flow trends, Federal Reserve policy signals, and broader investor risk appetite.

  • Bitcoin Price at Critical Crossroads: Will BTC Break $60K or Slide to $49K?

    Bitcoin Price at Critical Crossroads: Will BTC Break $60K or Slide to $49K?

    Bitcoin has entered July 2026 under intense market pressure. As of July 2, 2026, BTC trades near $58,800 — one of its weakest price levels in over a year. The market has remained unstable for weeks, causing concern among traders and investors worldwide.

    In recent days, Bitcoin suffered another major decline, dropping to nearly $57,950 — the lowest level in almost 21 months. After touching that low, the cryptocurrency staged a modest recovery, moving back into the $58,600–$59,000 range. Despite this slight uptick, the overall trend remains bearish.

    This latest fall has surprised many market observers, given that Bitcoin reached an all-time high near $126,000 in late 2025. The stark contrast between that peak and the current price underscores how quickly crypto markets can shift.

    Current Price Reflects Weak Market Sentiment

    Sellers have clearly taken control. Bitcoin lost nearly 20% in June 2026 alone, making it one of the worst months for the asset this year. Year-over-year, Bitcoin has fallen roughly 44%, fueling fear across the crypto ecosystem. Trading volumes remain elevated, suggesting that many traders are rapidly entering and exiting positions amid uncertainty.

    Technical indicators also point to weakness. Bitcoin now trades below key long-term levels that institutional investors typically monitor — most notably the 200-week exponential moving average. Historically, when BTC falls below this threshold, it often enters a prolonged correction. Many analysts draw parallels to the 2022 crypto crash, when Bitcoin remained under pressure for months before recovering.

    Key Price Levels Under Watch

    Bitcoin faces formidable resistance near $60,000. Every recent recovery attempt has stalled at this zone, and buyers have failed to push through with conviction. On the downside, $57,500 serves as immediate support. A breakdown below this level could trigger a slide toward $53,000–$54,000, and if selling intensifies, the market may target $49,000 — what many analysts call the most dangerous short-term level.

    Conversely, a decisive break above $60,000 could restore market confidence and set the stage for a recovery toward $64,000. Analysts view the $60,000 zone as the most critical pivot point for Bitcoin’s near-term direction.

    Headwinds From Institutional and Regulatory News

    Recent developments have added to the selling pressure. Citigroup, a major global financial institution, slashed its 12-month Bitcoin forecast from $112,000 to $82,000, citing weak investor demand and slow progress on U.S. crypto regulation. Meanwhile, Bitcoin ETFs have seen nearly $3.3 billion in outflows during 2026, signaling diminished institutional confidence.

    Investor attention has also shifted to other sectors, particularly artificial intelligence and semiconductors, diverting capital away from digital assets. Adding to the unease, Strategy Inc. (formerly MicroStrategy) reportedly sold part of its Bitcoin holdings in June, rattling a market already on edge.

    What’s Next for Bitcoin?

    The path ahead remains uncertain, with analysts offering divergent views. Conservative forecasts suggest Bitcoin could recover to $82,000–$100,000 by year-end if institutional demand returns and ETF inflows resume. More bullish projections see BTC reaching $120,000–$180,000 by late 2026, driven by limited supply, rising global adoption, and improved market confidence.

    However, bearish scenarios persist. If recession fears mount and institutional money continues to exit, Bitcoin could fall to $40,000–$50,000 before finding a stable floor.

    Final Market Snapshot

    Bitcoin stands at a pivotal juncture. The current price near $58,800 reflects fear, weak short-term confidence, and extreme caution among investors. The next move hinges on two critical levels: $60,000 resistance and $57,500 support. Long-term belief in Bitcoin remains intact, as adoption continues worldwide, but short-term signals are undeniably fragile.

    As the second half of 2026 begins, the crypto market confronts one of its most uncertain periods in recent years, and all eyes remain fixed on Bitcoin as traders await the next major move.

  • Ethereum Price Prediction: Could ETH Hit $10,000 by 2030?

    Ethereum Price Prediction: Could ETH Hit $10,000 by 2030?

    Key Takeaways

    • Ethereum remains the dominant blockchain for DeFi, stablecoins, and NFTs despite current market weakness.
    • Institutional adoption and staking mechanisms continue to strengthen Ethereum’s long-term growth prospects.
    • A $10,000 ETH price by 2030 is considered feasible if market conditions remain favorable.

    Ethereum, the second-largest cryptocurrency by market capitalization, continues to be a cornerstone of the blockchain ecosystem. Despite trading around $1,550–$1,650 in July 2026—well below its 2021 all-time high of $4,891—many analysts maintain a bullish long-term outlook. The central question remains: Can Ethereum reach $10,000 by 2030?

    Ethereum’s Current Market Position

    2026 has been a challenging year for Ethereum. High interest rates, economic uncertainty, and a broad crypto market downturn have kept prices under pressure. However, market weakness does not diminish Ethereum’s network dominance. It remains the backbone of decentralized finance (DeFi), hosts the premier NFT platforms, and handles massive stablecoin volume daily.

    Institutional Interest Could Push Prices Higher

    Rising institutional interest is a major factor behind positive analyst sentiment. Large financial firms are exploring crypto investments through ETFs and regulated products. Standard Chartered has issued one of the most aggressive forecasts, projecting Ethereum could reach $40,000 by 2030 under favorable conditions. Such predictions underscore the strong institutional belief in Ethereum’s future.

    Network Upgrades Continue to Improve Ethereum

    Developers are actively working on upgrades to improve transaction speed, reduce gas fees, and increase scalability. These technical improvements aim to address historical issues like high fees during periods of high demand. Successful upgrades could strengthen Ethereum’s position relative to newer, faster blockchains.

    Staking Creates Supply Pressure

    Ethereum’s transition to Proof-of-Stake has locked a significant portion of ETH in staking contracts, reducing circulating supply. When supply is limited and demand rises, prices tend to increase. This reduced supply is a key long-term advantage that could support price growth.

    Stablecoins and Real-World Assets Add Value

    Ethereum leads in stablecoin infrastructure, with USD Coin and Tether processing billions in transactions daily. Additionally, tokenization of real-world assets—bonds, real estate, traditional financial products—is gaining traction, and Ethereum remains the preferred network for many such projects, adding utility and demand.

    Risks That Could Slow Growth

    Despite the positive outlook, Ethereum faces challenges. Competition from newer blockchains like Solana and Sui, which offer lower fees and faster transactions, continues to attract developers. Regulatory uncertainty also looms, with governments worldwide debating crypto laws, taxation, and investor protections. Strict regulations could dampen adoption and market sentiment.

    Can Ethereum Reach $10,000 by 2030?

    For Ethereum to hit $10,000, its price would need to rise nearly sixfold from current levels. While ambitious, many market forecasts consider this target realistic if favorable conditions develop. Conservative estimates place ETH between $5,000 and $7,000 before 2030, while more bullish predictions exceed $10,000. Some institutional forecasts even suggest $40,000 during a strong crypto cycle.

    Why This Matters

    The disconnect between Ethereum’s depressed price and its unrivaled dominance in stablecoins, staking, and asset tokenization creates a unique market anomaly. This utility floor keeps banking giants bullish on a long-term structural recovery to $10,000.

    Final Outlook

    Ethereum remains a strong long-term investment option in the crypto space. Despite weak short-term performance, its fundamentals—leadership in DeFi, growing institutional adoption, stablecoin usage, and ongoing network upgrades—make it a viable candidate for future growth.

    FAQs

    1. What is Ethereum’s current price status in July 2026?

    Ethereum is trading under heavy pressure in the $1,550–$1,650 range, far below its historical peaks.

    2. Is a $10,000 target for Ethereum by 2030 realistic?

    Yes, many institutional analysts view it as structurally feasible, contingent on network upgrades, institutional inflows, and regulatory clarity.

    3. Why do financial institutions maintain a bullish long-term outlook despite the current slump?

    Ethereum processes over 50% of the world’s stablecoins, serves as the premier layer for tokenizing real-world assets, and has over 30% of its total supply locked in staking contracts.

    4. What are the main risks that could derail Ethereum’s long-term growth?

    Primary risks include competition from faster blockchains like Solana and Sui, macroeconomic pressures from high interest rates, and shifting international regulatory frameworks.

    5. What is the highest institutional price prediction for Ethereum?

    Standard Chartered has forecasted Ethereum could reach $40,000 by 2030, drawing comparisons to Amazon’s post-dot-com recovery.

    Disclaimer: This article is for informational purposes only and does not constitute investment advice. Cryptocurrency investments are risky; always conduct your own research.

  • BlockDAG Boosts World Cup Bonus to 100% While Ethereum Faces Resistance and MemeCore Rallies Briefly

    BlockDAG Boosts World Cup Bonus to 100% While Ethereum Faces Resistance and MemeCore Rallies Briefly

    The cryptocurrency market presents a mixed picture today as three major stories unfold. MemeCore (MEME) shows a short-term price jump, while Ethereum (ETH) struggles under heavy resistance. Meanwhile, BlockDAG (BDAG) has doubled its World Cup bonus to 100%, drawing significant attention from traders.

    MemeCore Crypto News: Temporary Gains with Long-Term Risks

    Recent MemeCore crypto news indicates a 15.2% price surge to $0.78, bringing its market cap back to $861.12 million. Daily trading volumes reached $16.67 million, reflecting steady liquidity. The price has climbed above its 20-day moving average of $0.7197 and 50-day average of $0.6573, leading some analysts to project a 71% chance of further upside into the $0.631 to $0.9466 range.

    However, the coin remains well below its 200-day moving average of $2.2263, indicating that the recovery is fragile and medium-term risks persist.

    Ethereum Price Chart: Weak Demand Limits Recovery

    The Ethereum price chart reveals ongoing challenges. ETH is trading within a falling channel below its 100-day and 200-day moving averages. Buyers are defending the $1,500 support zone, but strong resistance lies at $1,750 and $1,850. Weak demand from large U.S. institutional investors further dampens recovery prospects, making a sustained uptrend unlikely in the near term.

    BlockDAG’s 100% World Cup Bonus and AI Launch Fuel Momentum

    BlockDAG has captured the spotlight by doubling its World Cup bonus from 50% to 100%, meaning buyers receive double the coins for the same purchase price. This promotion coincides with the launch of BDAG AI, which boosted the project’s valuation by $500 million. Currently, BDAG is priced at $0.00000066, with a buyback program set at $0.03, offering a substantial potential return.

    Traders are moving quickly to secure the bonus before it expires. Coins are delivered instantly to wallets, allowing immediate participation in the ecosystem.

    Conclusion: A Diverging Market Landscape

    While MemeCore sees temporary gains and Ethereum faces headwinds, BlockDAG stands out with its aggressive bonus and AI-driven valuation spike. For investors seeking the best crypto to buy today, BDAG’s low entry price and 100% bonus present a compelling opportunity. As always, conduct your own research before investing.

    Disclaimer: This article is for informational purposes only and does not constitute investment advice. Cryptocurrency investments carry risk; perform your own due diligence.

  • Dogecoin Price Prediction 2026: Will DOGE Bounce Back from Its Bearish Slump?

    Dogecoin Price Prediction 2026: Will DOGE Bounce Back from Its Bearish Slump?

    Dogecoin is trading near $0.072 after heavy losses, but new ecosystem developments, strong community support, and a possible market recovery could help DOGE rebound toward higher price levels later in 2026.

    Current Dogecoin Price Situation

    As of July 2026, Dogecoin trades near $0.072. This remains a sharp fall from its all-time high of $0.73, which came in May 2021 during the biggest rally in its history. Even after the decline, Dogecoin still holds a market value of nearly $11.2 billion, which keeps it among the largest digital assets worldwide.

    Daily trading activity stays quite active as well. Current daily trading volume stands close to $800 million, which shows that traders continue to buy and sell DOGE regularly despite weak market conditions.

    Over the last month, Dogecoin has seen strong downward pressure. During June alone, reports show the coin lost more than 25% of its value, which made it one of the weaker performers among major cryptocurrencies.

    Why Dogecoin Price Remains Under Pressure

    One major reason behind this price weakness comes from the overall crypto market. Large cryptocurrencies like Bitcoin and Ethereum have also faced uncertainty given economic concerns, reduced institutional investment, and weaker retail participation.

    Another issue comes from Dogecoin’s supply system. Unlike Bitcoin, Dogecoin has no fixed supply limit. Around 5 billion new DOGE coins enter circulation every year. This constant increase in supply creates pressure on price as demand must grow continuously just to support higher value.

    The excitement around meme coins has also cooled down. In previous years, social media hype played a huge role in pushing Dogecoin higher. Celebrity support and internet trends created strong buying pressure. That level of excitement has reduced a lot under current market conditions, which has weakened momentum.

    Recent News That Could Help Recovery

    One of the biggest positive developments comes from DogeOS, a project built to expand Dogecoin’s use cases beyond simple payments. The goal focuses on adding more utility in areas such as decentralized finance and blockchain gaming.

    Recent reports show DogeOS secured around $6.9 million in funding from Polychain Capital. This development has created optimism as strong financial backing often helps long-term project growth.

    Community Strength Still Supports DOGE

    One of Dogecoin’s biggest strengths remains its community. Even after several difficult market phases, DOGE continues to have one of the most active communities in the crypto world.

    Social platforms like Reddit and X still show large amounts of discussion around Dogecoin. Strong community support often plays a major role in keeping interest alive during bearish market conditions.

    Technical Price Outlook

    Analysts believe that if price falls below $0.067, more downside pressure could appear. In that situation, DOGE may move lower toward $0.05 in the short term.

    However, if buyers defend current levels successfully, price could bounce back toward the $0.10 to $0.12 range over the next few months.

    Some bullish market forecasts suggest Dogecoin may even reach $0.20 before the end of 2026, especially if the overall crypto market enters another strong recovery phase.

    Can Dogecoin Reach $1 Again?

    The biggest long-term question remains whether Dogecoin can return to the $1 price level. At present, Dogecoin has roughly 155 billion coins in circulation. For DOGE to reach $1, total market capitalization would need to rise above $140 billion.

    Why This Matters

    Dogecoin is fighting to transition from a pure social media speculation tool into a functional asset. With June performance wiping out 25% of its value and the constant dilution of 5 billion new coins yearly, the success of the Polychain-backed DogeOS application layer is critical to see if DOGE can sustain its $11.2 billion valuation through utility rather than viral hype.

    Final Prediction for Dogecoin

    Dogecoin still has an edge because of its massive community and cultural footprint. At the same time, the incoming DogeOS upgrades provide a real technical backbone that the asset previously lacked. If macro conditions flip positive and capital starts rotating back into altcoins, DOGE has a clear path to reclaim the $0.10 to $0.20 liquidity zone before the end of the year.

    Key Takeaways

    • Dogecoin price currently sits near $0.072, far below its $0.73 all-time high.
    • New DogeOS development and $6.9 million funding bring fresh long-term optimism.
    • A break below $0.067 may push price toward $0.05, while recovery could send DOGE toward $0.20.

    FAQs

    1. What is Dogecoin’s market position at the start of July 2026?
    DOGE trades near $0.072, down 90% from its historic $0.73 peak. However, it maintains a robust $11.2 billion market cap, keeping it among the largest digital assets.

    2. Why is Dogecoin facing continuous downward price pressure?
    The recent decline stems from fading meme-coin hype, broader crypto market corrections, and structural selling pressure caused by an infinite supply system that adds 5 billion new coins annually.

    3. What is DogeOS, and how does it impact Dogecoin’s recovery?
    DogeOS is an ecosystem expansion project bringing decentralized finance and gaming utility to DOGE. It recently secured $6.9 million in venture capital funding from Polychain Capital.

    4. What are the key technical price boundaries for DOGE right now?
    The immediate technical support floor sits at $0.067, below which prices could slide to $0.05. Conversely, strong buying defense could push prices toward resistance between $0.10 and $0.12.

    5. Is a return to the $1.00 mark a realistic scenario for Dogecoin?
    Reaching $1.00 requires a $140 billion market cap due to the 155 billion circulating coins. While mathematically possible, it demands massive, unprecedented global capital inflows and long-term demand.

    Disclaimer: This article is provided for informational purposes only and does not constitute investment advice. Cryptocurrencies are highly volatile and risky. Always do your own research before investing.

  • Solana Price Analysis: $60 Support Holds, $80 Breakout in Sight

    Solana Price Analysis: $60 Support Holds, $80 Breakout in Sight

    Solana has once again entered the spotlight after successfully defending the critical $60 support level. The recent price action has sparked fresh debate: can SOL move higher and reclaim the $80 resistance zone — one of the most important short-term price levels?

    At the time of writing, Solana trades near $75, marking a weekly gain of roughly 8%. Daily trading volume remains robust at over $2.9 billion, while the project holds a market capitalization of around $44 billion, cementing its status as a top cryptocurrency.

    The $60 Support Level Prevented Further Decline

    Solana’s strong defense of the $60–$62 range was the main catalyst for the recent recovery. During market weakness, sellers repeatedly tested that zone, but buyers stepped in each time, preventing further downside. This behavior reflects strong investor confidence — large holders and long-term investors see value at that level.

    After bouncing from support, SOL recorded nearly a 20% price recovery, improving short-term sentiment. The ability to hold above that floor has built a stronger base for the next upward move.

    $80 Remains the Next Major Hurdle

    Despite the rebound, $80 remains formidable resistance. For much of the second quarter of 2026, SOL traded in a range between $70 and $95. A clean break above $80 could shift market sentiment, opening the door to $90 or even $100.

    Price charts show a pattern of higher lows, signaling that buyers are gradually gaining control. Analysts believe several daily closes above $80 could attract stronger interest from traders and spark fresh momentum across the altcoin sector.

    Solana Network Growth Supports Positive Sentiment

    Beyond price, Solana’s blockchain continues to expand. The network now handles nearly 3.5 billion transactions per month and remains one of the fastest in the industry. Monthly active wallet addresses recently surpassed 50 million, reflecting steady ecosystem activity.

    Key developments have also bolstered confidence: MoneyGram expanded its partnership within Solana’s developer ecosystem, and the USDC Treasury minted $250 million in stablecoins on Solana — a vote of trust in the network’s infrastructure.

    ETF Growth Creates Mixed Market Reaction

    Spot Solana ETFs, though still less popular than Bitcoin or Ethereum ETFs, have drawn institutional attention. Total inflows have crossed $1.1 billion, showing growing interest from larger investors. However, some analysts note that ETF demand hasn’t been strong enough to fully sustain a major rally — earlier in June, selling pressure pushed SOL below $70 despite ETF inflows.

    Technical Indicators Show Recovery Potential

    The Relative Strength Index (RSI) has recovered from oversold conditions, signaling that selling pressure is waning. Rising trading volumes also suggest more buyers are entering the market. Key levels remain: strong support near $60, next support around $68, immediate resistance at $80, and the next major barrier near $90. If SOL clears and holds above $80, the market could target $100.

    Why This Matters

    Defending $60 proves strong investor conviction despite market corrections. With booming network growth and $1.1 billion in ETF inflows, reclaiming $80 is more than a short-term rally — it’s the definitive breakout signal needed to target $100.

    Final Outlook

    Solana has shown impressive resilience after defending the $60 support level. Strong price recovery, rising on-chain activity, increasing institutional participation, and healthy ecosystem growth have all improved sentiment. The focus now is on $80 resistance, which may decide Solana’s next major move. A successful breakout could drive SOL toward $90 and possibly $100.

    FAQs

    1. Why is the $60 level important for Solana?
    The $60 zone acted as a strong support floor where buyers consistently stepped in, preventing further decline.

    2. Can Solana reach $80 soon?
    If buying pressure continues to rise, SOL has a good chance of testing the $80 resistance barrier in the short term.

    3. How much is Solana trading at now?
    Solana currently trades near $75, with a weekly gain of about 8% and daily volume exceeding $2.9 billion.

    4. What role do ETFs play in Solana’s price?
    Spot Solana ETFs have attracted over $1.1 billion in inflows, proving institutional interest, but demand isn’t yet strong enough to prevent short-term dips below $70.

    5. What happens if SOL breaks above $80?
    A successful breakout could shift market sentiment, attract stronger trader interest, and open the path toward $90 and $100.

  • 5 Leading Meme Coins Capturing Crypto Attention in July 2026

    5 Leading Meme Coins Capturing Crypto Attention in July 2026

    Meme coins continue to dominate cryptocurrency conversations in July 2026, driven by strong online communities, viral social media trends, and increased trading activity. While these digital assets remain highly speculative, several have maintained investor confidence through ecosystem growth, exchange listings, and expanding utility. Below are the five meme coins making the biggest impact this month.

    1. Dogecoin (DOGE)

    Dogecoin remains the undisputed leader among meme coins by market capitalization and popularity. Originally launched as a joke, DOGE has evolved into a widely traded cryptocurrency supported by a massive global community. High liquidity, broad exchange availability, and continued adoption for payments keep Dogecoin at the forefront of the meme coin market in July 2026.

    2. Shiba Inu (SHIB)

    Shiba Inu continues to strengthen its ecosystem beyond being a meme token. The expansion of Shibarium, regular token burns, decentralized finance applications, and NFT initiatives have increased investor confidence. Its large and active community remains one of its biggest strengths, helping SHIB retain its position among the most valuable meme cryptocurrencies this year.

    3. Pepe (PEPE)

    Pepe Coin continues to attract traders with impressive market momentum and strong social media engagement. Built on Ethereum, PEPE has benefited from whale accumulation, high daily trading volumes, and viral internet culture. Despite its speculative nature, the token remains one of the most actively traded meme cryptocurrencies in the current market cycle.

    4. Bonk (BONK)

    Bonk has established itself as Solana’s leading meme coin by leveraging the network’s speed and low transaction costs. Integration with decentralized applications, wallets, and NFT platforms has boosted its utility. Strong community support and growing adoption across the Solana ecosystem have helped BONK remain a favorite among retail investors.

    5. dogwifhat (WIF)

    Dogwifhat (WIF) continues to benefit from its viral branding and highly engaged community. The Solana-based token has gained traction through active trading, exchange listings, and widespread social media visibility. Although its price remains volatile, WIF has become one of the most recognized meme coins, attracting both new and experienced cryptocurrency traders.

    Key Takeaways

    Meme coins remain among the riskiest yet most talked-about assets in the cryptocurrency market. Dogecoin, Shiba Inu, Pepe, Bonk, and dogwifhat lead the sector through strong communities, market liquidity, and growing ecosystems. Investors should conduct thorough research, assess risk carefully, and remember that meme coin prices are heavily influenced by market sentiment.

  • XRP Price Forecast July 2026 – Can the Downtrend Finally Reverse?

    XRP Price Forecast July 2026 – Can the Downtrend Finally Reverse?

    XRP enters July 2026 trading near $1.05 to $1.15 after a steep decline from its 2025 highs above $3.50. Traders are watching whether the $1.00 support level holds, as regulatory shifts and supply pressure continue to weigh on the asset. This article breaks down the key drivers, technical signals, and price outlook for the month.

    Why XRP Price Fell So Much

    The primary cause of XRP’s weakness is persistent supply pressure. Ripple unlocks 1 billion XRP tokens from escrow every month, and June 2026 saw another major release. Even when a portion returns to escrow, the market often reacts negatively to the increased circulating supply.

    In addition, the broader crypto market remained weak, and the introduction of California’s Digital Financial Assets Law (DFAL) on July 1, 2026 created new regulatory uncertainty for Ripple as a major U.S. blockchain firm.

    What Technical Charts Show Right Now

    XRP remains below the key 200-day moving average near $1.13–$1.14, which acts as a strong resistance. The Relative Strength Index (RSI) recently dropped near 32, indicating oversold conditions that sometimes precede a bounce.

    Positive Signs Still Exist

    Despite the price decline, spot XRP ETF inflows remain positive, showing continued institutional interest. Legislative discussions in Washington around the CLARITY Act could offer stronger legal protection for XRP as a commodity. Ripple’s international payment network expansion also supports long-term demand.

    XRP Price Forecast for July 2026

    If the market stabilizes, XRP may trade in a range of $1.10 to $1.20. More optimistic scenarios predict a rise toward $1.40–$1.60 if regulatory fears fade and buying momentum returns. Conservative estimates place the average price near $1.16–$1.18.

    Also read: Why Bitcoin, Ethereum, XRP, and Dogecoin are Falling: Will July Bring Relief?

    Key Takeaways

    • XRP trades near $1.05–$1.15, down nearly 70% from its 2025 peak.
    • The $1.00 support level is critical to prevent further declines toward $0.85.
    • Oversold RSI (32) and positive ETF inflows offer a glimmer of hope.
    • Regulatory developments (DFAL, CLARITY Act) and supply unlocks remain key risks.

    Disclaimer: This article is for informational purposes only and does not constitute financial advice. Cryptocurrency investments carry risk; always conduct your own research before investing.

  • UK’s FCA Softens Crypto Regulations While Retaining Capital and Stress Test Requirements

    UK’s FCA Softens Crypto Regulations While Retaining Capital and Stress Test Requirements

    The Financial Conduct Authority (FCA) has eased certain aspects of its planned UK crypto regulatory framework following industry feedback. However, the revised rules still require firms to hold capital against risky assets, conduct annual stress tests, and implement consumer safeguards. The regime is scheduled to take effect in October 2027 and will cover trading, custody, customer service, and risk management.

    The FCA reduced compliance thresholds and simplified reporting duties for some crypto activities after extensive consultation with market participants. Capital requirements for certain cryptoassets, including fiat-backed stablecoins, were also lowered. Industry representatives had argued that overly stringent rules could stifle growth and push operations offshore. The regulator stated that the revised framework aims to protect consumers without unduly burdening compliant businesses.

    Under the new rules, crypto firms must maintain capital reserves proportional to the risk of assets on their balance sheets. They must also design and run annual stress tests, submitting results to the FCA. Unlike the Bank of England’s approach of prescribing specific scenarios for major banks, crypto companies will calculate their own exposure and determine necessary capital levels.

    David Geale, the FCA’s executive director for payments and digital finance, described the framework as the UK’s first comprehensive crypto regulation. He noted that it applies established financial principles where crypto activities present comparable risks. The FCA expects stronger oversight to reduce misconduct and questionable practices, though consumers will still be warned that crypto investments can lose all value.

    Industry reactions have been mixed. Dan Coatsworth, head of markets at AJ Bell, said regulation can strengthen protection and reduce scams and misleading promotions, but cannot eliminate risk entirely. Following the announcement, Bitcoin and other major cryptocurrencies traded within narrow ranges, showing little immediate price reaction.

    As the October 2027 effective date approaches, crypto businesses should review the final standards and prepare their systems accordingly. The FCA’s revised approach offers more flexibility while maintaining accountability, seeking to balance innovation with consumer protection.