Tag: cryptocurrency

  • Ethereum Price Pressures Mount: ETH Approaches $1,500 as Exchange Inflows Rise

    Ethereum Price Pressures Mount: ETH Approaches $1,500 as Exchange Inflows Rise

    Ethereum fell back toward the $1,500 area after sellers rejected another recovery attempt near a major resistance zone. Rising exchange inflows and a weak chart structure continue to support a cautious market outlook.

    Ethereum Remains Trapped Below Major Resistance

    Ethereum continues to form lower highs and lower lows on the daily chart. The pattern keeps the broader trend bearish and shows that sellers still control price direction. ETH also trades below its 100-day and 200-day moving averages. In addition, the asset remains under a long-term descending trendline that has limited previous recovery attempts.

    The latest rebound stalled below the $1,720 to $1,780 supply zone. Sellers then pushed ETH back toward the $1,460 to $1,560 demand area. Buyers have responded near that support region, but the reaction remains limited. ETH has not reclaimed the resistance range or changed the wider bearish structure.

    Until price moves above $1,780 with sustained strength, market rallies may remain corrective. A break below current demand could expose Ethereum to another downward move. Can buyers defend the $1,500 region long enough to challenge the resistance that has repeatedly stopped each recovery?

    Four-Hour Chart Shows a Fragile Recovery

    The four-hour chart reflects the same pressure across a shorter timeframe. Sellers rejected ETH near $1,720 to $1,780 before driving it toward the lower range boundary. Ethereum later recorded a modest rebound from the $1,500 to $1,530 area. That response shows buyers remain active around the market’s immediate demand zone.

    Even so, ETH still trades near the bottom of its broader consolidation range. Each recovery attempt has also formed a lower high, which keeps short-term momentum weak. For now, Ethereum may continue moving between about $1,520 and $1,750. The lower boundary remains important because a breakdown could increase selling pressure.

    By contrast, a move above the upper range would improve the short-term structure. It could also allow buyers to begin another recovery attempt toward higher resistance.

    Exchange Inflows Add Pressure Near Support

    On-chain data also shows a rise in Ethereum exchange netflows. The 14-day moving average has turned sharply positive during recent trading sessions. Higher netflows mean more ETH is moving onto exchanges. Holders may transfer assets for trading, selling, or reducing market exposure.

    Such inflows do not guarantee a price decline. Still, they add supply pressure while Ethereum trades close to a major support region. The increase has occurred as ETH moved back toward the $1,500 zone. That combination leaves the market sensitive to further weakness around current demand.

    Price stability near support and lower exchange inflows would reduce immediate pressure. Until then, Ethereum remains below key averages and the main resistance zone.

    Conclusion

    Ethereum remains under bearish pressure as sellers defend the $1,720 to $1,780 resistance zone and exchange inflows increase. Buyers must protect support near $1,500 to prevent deeper losses. Traders should watch for either a confirmed support breakdown or a strong resistance reclaim before assessing the next move.


  • Bitcoin Drops Below $60K as $700M in Long Liquidations Rock the Crypto Market

    Bitcoin Drops Below $60K as $700M in Long Liquidations Rock the Crypto Market

    Bitcoin tumbled below the $60,000 mark on June 24, triggering a cascade of liquidations that erased over $700 million in long positions. The sharp sell-off intensified market fear and wiped out speculative bets that had attempted to buy the dip.

    Liquidations Deepen Pressure Across Crypto Markets

    The forced exit of leveraged traders weighed heavily on Bitcoin as it weakened below the psychologically important $60,000 level. Further declines appeared likely as selling pressure continued to ripple through the broader cryptocurrency market. According to AMBCrypto, Bitcoin open interest had already fallen from its 2025 highs, yet volatility remained elevated as traders scrambled to adjust to rapid price swings.

    At the same time, sustained outflows from spot Bitcoin exchange-traded funds (ETFs) reflected weakening investor confidence. The Coinbase Premium Index turned negative for more than a month, signaling limited demand from U.S. investors. Consequently, spot buying provided little support as Bitcoin extended its slide.

    Demand and Miner Flows Add to Supply Concerns

    Crypto analyst Ali Martinez noted that Bitcoin’s apparent demand has remained negative for 208 consecutive days. This metric tracks whether spot demand can absorb newly mined supply and older coins moving onto exchanges. Analyst Axel Adler Jr. added that net realized profit and loss has stayed negative for five months when measured using a 90-day moving average.

    Such prolonged realized losses mirror conditions seen during previous bear markets, particularly in mid-2022. Meanwhile, CryptoQuant analyst PelinayPA observed that the foundation for the latest losses began forming in February. Bitcoin’s Miner Position Index rose between March and June.

    Although the index stood at minus 0.15—still negative—it indicated that miners were transferring relatively more Bitcoin toward cryptocurrency exchanges. Miner-to-exchange flows also increased during the same period. Together, these metrics suggest miners have been preparing more Bitcoin for potential selling.

    Bitcoin’s realized price now sits at $53,888, representing the market’s average acquisition cost. This level is widely viewed as the next major support zone and a likely price target. The key question remains whether buyers can absorb the rising supply before Bitcoin retests its realized price.

    Grantham Renews Long-Running Bitcoin Criticism

    GMO co-founder Jeremy Grantham reiterated his criticism of Bitcoin during an appearance on CNBC’s Squawk Box on Friday. He described it as a speculative asset with no intrinsic value and predicted that Bitcoin would gradually lose relevance over several decades. Grantham questioned its practical purpose and performance during a broader bull market.

    He argued that Bitcoin has failed to provide a stable store of value, citing its latest price decline despite strength in the wider economy. Grantham contrasted it with gold, which he said has still delivered solid gains even after retreating from its previous highs. He also noted that consumers rarely use Bitcoin for everyday purchases or major commercial transactions, and linked its use to illegal money transfers.

    Bitcoin has declined by at least 70% from its peak during every previous market cycle. It currently trades about 52% below its October high and remains under $60,000.

    Conclusion

    Bitcoin’s fall below $60,000 sparked $700 million in long liquidations as weak spot demand, ETF outflows, and rising miner transfers intensified selling pressure. With the realized price near $53,888 emerging as key support, traders should closely monitor demand and exchange flows before making market decisions.

  • Dogecoin and HYPE Suffer Steep Weekly Losses as Bitcoin Clings to $60K Support

    Dogecoin and HYPE Suffer Steep Weekly Losses as Bitcoin Clings to $60K Support

    Dogecoin and Hyperliquid’s HYPE token posted the steepest weekly losses among major cryptocurrencies, falling 9.6% and 9.9% respectively, as investors rotated capital toward equities and away from digital assets. Bitcoin showed relative resilience, recovering above $60,000 after briefly testing the $58,800 region, but broader market pressure from ETF outflows, a hawkish Federal Reserve, and a strong dollar kept sentiment subdued.

    Bitcoin Rebounds Amid Persistent Selling Pressure

    Bitcoin fell 5.3% over the week to around $60,345, but buyers stepped in each time the price approached $58,000, pushing it back above $60,000. FxPro chief market analyst Alex Kuptsikevich attributed the sharp declines to margin position liquidations, noting that pending buy orders then supported the recoveries. He warned that institutional investors could continue reducing crypto exposure to protect balance sheets, potentially triggering further liquidation-driven swings.

    US spot Bitcoin ETFs recorded outflows during the week, while the Federal Reserve’s hawkish stance and a strengthening dollar added headwinds. Bitcoin also remained near its 200-week moving average, a level historically associated with extended periods of weak market performance.

    Dogecoin Breakdown Signals Further Downside Risk

    Dogecoin extended its broader decline with a 4% loss in the latest 24-hour period, now trading about 90% below its all-time high. The memecoin broke below a sideways trading range that had held since February, with a retest near $0.08926 confirming the breakdown. It also remained below its 200-day moving average, keeping sellers in control and maintaining a bearish structure.

    Shorter timeframes showed Dogecoin repeatedly failing below a descending trendline, while the Chaikin Money Flow reading stood at negative 0.17, signaling continued capital outflows. However, net trading volume surged 98.85%, suggesting some buyer interest, and momentum readings began turning higher despite bearish control.

    Analyst Ali Martinez noted that the TD Sequential indicator produced a daily buy signal, suggesting the decline could pause if Dogecoin maintains support above $0.073. A move toward $0.081 is possible if that level holds, but a drop below $0.073 would invalidate the signal and reinforce the bearish outlook.

    Equity Rotation Leaves Crypto Without Fresh Capital

    The S&P 500 finished nearly flat, but the equal-weighted index hit a record high as investors rotated out of large-cap tech and semiconductors into other sectors. Falling oil prices supported broader market sentiment, yet cryptocurrencies failed to attract any of that rotating capital. Concerns over elevated AI stock valuations and weakening digital asset conditions kept investors selective.

    Conclusion

    Dogecoin and HYPE led the week’s crypto losses as Bitcoin held near $60,000 despite ETF outflows, institutional selling, and a strong dollar. Dogecoin’s bearish structure points to continued risk unless $0.073 support holds. Traders should monitor support levels, fund flows, and broader market sentiment before taking new positions.

  • XRP Hovers Near $1 as Ripple Broadens Blockchain Finance Strategy

    XRP Hovers Near $1 as Ripple Broadens Blockchain Finance Strategy

    XRP is trading near the $1 mark after falling roughly 70% from last year’s highs, even as Ripple continues to expand its blockchain infrastructure and financial services. The world’s sixth-largest cryptocurrency faces weak sentiment and renewed doubts about its recovery, but Ripple’s business is moving well beyond its original cross-border payments focus.

    Ripple Expands Beyond Cross-Border Payments

    Ripple initially built its business around helping financial institutions move money across borders faster and at lower cost. It has since widened its operations across blockchain finance. The company now works in real-world asset tokenization, which places traditional financial assets on blockchain networks. Financial firms are also exploring faster settlement and lower operating expenses.

    At the same time, Ripple has formed relationships with major institutions and reportedly built a business valued at nearly $50 billion. It has also invested billions in acquisitions and partnerships. These investments aim to create more services across Ripple’s broader ecosystem. Increased activity could support greater network use and additional demand over time.

    AI Payments Add Another Possible Growth Area

    Ripple has also explored possible links between blockchain payments and artificial intelligence. Some industry observers expect AI agents to use blockchain networks for automated transactions. Those observers have mentioned XRP Ledger as one possible settlement layer for such payments. The opportunity remains speculative and has not yet become a proven demand source.

    Even so, the discussion reflects Ripple’s search for applications beyond traditional payment services. The company continues positioning itself as a wider blockchain infrastructure provider. Its long-term strategy now spans payments, tokenization, acquisitions, and financial services. Each area could increase activity across the XRP ecosystem if adoption expands.

    Large Supply Complicates XRP Price Forecasts

    XRP price forecasts vary widely, ranging from a return toward $4 to aggressive projections between $20 and $100. Each target requires different adoption and investment levels. About 62 billion XRP coins remain in circulation. At $4 per token, XRP’s market value would approach $250 billion under the current supply. That valuation would place XRP above the current market value of many leading crypto projects. Higher targets would require far larger amounts of new capital.

    Can Ripple’s expanding infrastructure create enough demand to support a lasting XRP recovery? Many investors view a gradual $1 to $4 range as a more realistic multi-year scenario. Longer-term performance may depend on blockchain finance adoption, regulatory developments, and competition. Real-world asset tokenization remains early, although financial institutions continue investing in the sector.

    Conclusion

    XRP remains under pressure near $1, yet Ripple continues expanding across payments, tokenization, and blockchain infrastructure. Its broader strategy may support future network demand, although XRP’s large circulating supply limits extreme price projections. Investors should track adoption, regulation, and ecosystem growth before assessing its long-term potential.

  • Meta Reports Talks with Polymarket and Kalshi as It Develops Arena Prediction App

    Meta Reports Talks with Polymarket and Kalshi as It Develops Arena Prediction App

    Meta is pursuing a dual-track strategy to enter the prediction market space, simultaneously testing its own internal product, Arena, while exploring potential partnerships with established platforms Polymarket and Kalshi. CEO Mark Zuckerberg has reportedly instructed senior executives to engage in discussions with both operators, according to a New York Times report cited by The Block.

    The exploratory talks come just days after news broke that Zuckerberg had directed a small team to build Arena, a standalone prediction-market app separate from Facebook, Instagram, and WhatsApp. Insiders describe Arena as experimental yet a top company priority, suggesting Meta may choose to either launch its own platform, strike distribution deals, or pursue both options simultaneously.

    Meta’s Dual Strategy: Build and Partner

    Meta’s interest in prediction markets is not new. The company previously operated Forecast from 2020 to 2022, a points-based platform that allowed crowdsourced predictions but was shut down due to low usage and high manual question-selection costs. Arena represents Meta’s second known consumer prediction product and would likely use a similar points model, differentiating it from the real-money services offered by Polymarket and Kalshi.

    Even without cash trading, Arena could drive engagement, advertising opportunities, and valuable user-interest data. However, challenges remain regarding misinformation, market manipulation, sensitive event categories, and protections for younger users. Meta has not yet detailed how Arena would generate revenue.

    Prediction Market Landscape Grows

    If Meta secures a partnership, it would follow X (formerly Twitter), which chose Polymarket as its official prediction-market partner in June 2025. That integration placed live market probabilities and Grok-powered annotations directly in posts. A similar deal could put prediction markets across Meta’s massive social-media network, which reported 3.56 billion daily users in the first quarter of 2026.

    Meanwhile, Polymarket and Kalshi have expanded rapidly. Their combined event-contract trading volume exceeded $60 billion in 2026. Institutional market makers like Wintermute have provided liquidity. Kalshi raised $1 billion at a $22 billion valuation in May and reportedly seeks a $40 billion valuation. Both platforms operate under CFTC regulation: Kalshi has been a designated contract market since 2020, and Polymarket’s U.S. business also uses a CFTC-regulated designated contract market.

    What’s Next?

    Meta has not announced any agreements or a public launch for Arena. The talks remain exploratory, and neither Polymarket nor Kalshi has commented publicly. Market participants should watch for official details on Arena’s structure, distribution model, and regulatory compliance. The company’s renewed interest comes after a quarterly decline in daily users across its Family of Apps, which Meta attributed to internet disruptions in Iran and WhatsApp restrictions in Russia.

    Prediction markets allow participants to trade contracts tied to future events, with prices reflecting market-implied probabilities across politics, monetary policy, sports, entertainment, and financial developments. As Meta explores both internal development and external partnerships, the prediction market industry’s growth trajectory appears set to intersect with mainstream social media.

  • XRP Tumbles to $1 Amid Crypto Sell-Off, Analyst Holds $9 Target on Long-Term Outlook

    XRP Tumbles to $1 Amid Crypto Sell-Off, Analyst Holds $9 Target on Long-Term Outlook

    XRP fell another 5% on the day and traded at $1.00 at press time as the wider crypto market sold off. Bitcoin also dropped below $60,000, triggering more than $600 million in liquidations within one hour. XRP longs accounted for over $40 million of that total, adding further pressure to already fragile prices.

    XRP Faces Heavy Selling

    As Bitcoin weakened, XRP moved lower with the rest of the sector. The wave of liquidations swept through the market, wiping out over $600 million in positions in just one hour. At the same time, financial analyst Celal Kucuker offered a much different view. With more than 20 years of market experience, Kucuker said XRP may still follow a larger technical path, suggesting this drop could be the setup for a much bigger move later.

    Kucuker’s Long-Term XRP Map

    Kucuker said he still sees one of the best scenarios for XRP on his chart. He placed the bottom near $0.86 to $0.87 and pointed to an upside target between $8 and $9. His chart uses XRP’s monthly timeframe, showing a repeating pattern of advances and corrections inside an ascending channel. Previous rallies reached the top of that structure before price cooled again.

    The chart also connects with a Bitcoin scenario near $54,000. Kucuker said XRP could bottom in the same area if Bitcoin follows that path. In a June 6, 2026 post, he called this the most realistic scenario for XRP.

    Key Levels and Timeline

    The weekly chart Kucuker shared tracks XRP from 2018 through 2031. It shows the current price near $1.041 and marks key Fibonacci levels and a long-term trend channel. The 0.618 Fibonacci level sits near $0.878, matching Kucuker’s $0.86 to $0.87 bottom zone. The chart also places the 1.618 extension near $9.042, lining up with his $8 to $9 target.

    The chart projects a rally from the support zone toward the upper target between December 2026 and February 2027. It also shows XRP moving within a rising channel that has held since 2018. Earlier tests of the lower boundary have often led to strong rebounds.

    Ripple Gains EU Regulatory Momentum

    While the XRP price weakened, Ripple received a regulatory update in Europe. Ripple Markets APAC Pte. Ltd. won preliminary approval under the EU’s MiCA framework from Luxembourg’s CSSF. The approval allows Ripple to offer regulated digital asset services across the European Union, including payments and stablecoins. The move gives Ripple a clearer path in one of the world’s largest financial regions.

    The approval may support long-term XRP utility and opens the door for banks, payment firms, and enterprises to use Ripple-related services with regulatory clarity. That backdrop arrives even as the token trades under pressure in the short term.

    What’s Next?

    XRP fell to $1 as Bitcoin slipped below $60,000 and liquidations swept through the crypto market. Despite the sharp decline, analyst Celal Kucuker maintained his long-term outlook, pointing to a potential bottom near $0.87, while Ripple’s MiCA approval added a notable regulatory development. Investors will now watch whether key support levels hold.

  • Ripple’s RLUSD Stablecoin Debuts in Japan: What XRP Holders Need to Know

    Ripple’s RLUSD Stablecoin Debuts in Japan: What XRP Holders Need to Know

    On June 24, 2026, Ripple officially launched its RLUSD stablecoin in Japan after receiving full regulatory approval from the country’s Financial Services Agency. This milestone marks a significant expansion for Ripple beyond its traditional cross-border payment network and into the fast-growing stablecoin market, which now exceeds $300 billion globally.

    RLUSD is a 1:1 US dollar-pegged stablecoin, fully backed by cash reserves, short-term US government bonds, and dollar deposits. Unlike volatile cryptocurrencies such as Bitcoin or XRP, RLUSD maintains a stable price, making it ideal for banks, corporations, and financial institutions that require predictable digital payments. Within a short period, RLUSD has reached a market capitalization of approximately $1.59 billion, with an annual growth rate close to 271%.

    Why Japan?

    Japan has long been one of Ripple’s strongest markets, thanks in part to a decade-long partnership with SBI Holdings, one of the country’s largest financial firms. The launch became possible after Japan introduced new regulations allowing foreign stablecoins to enter under strict compliance rules. Japan’s clear legal framework provides a safe and predictable environment for regulated crypto assets, giving Ripple a strategic foothold in Asia.

    Ripple Expands Beyond XRP

    With RLUSD, Ripple is diversifying its business model. Instead of relying solely on XRP for crypto transfers, the company can now offer stablecoin payments, asset settlement, corporate treasury systems, and digital banking services. This does not replace XRP; XRP remains the primary bridge asset for high-speed cross-border currency transfers on Ripple’s payment network. RLUSD provides an alternative for institutions that need zero price volatility.

    What This Means for XRP Investors

    Some investors initially worried that RLUSD might diminish XRP’s role. However, the opposite appears true. By drawing more traditional financial institutions into the Ripple ecosystem, RLUSD increases overall network activity. Higher transaction volume on the XRP Ledger can drive stronger demand for XRP over the long term. The launch positions Ripple to compete directly with major stablecoins like USDT and USDC, while emphasizing regulatory compliance—a key advantage for institutional adoption.

    Competition and Outlook

    The global stablecoin market is dominated by USDT and USDC, but Ripple’s focus on regulatory compliance sets RLUSD apart. Japan’s approval is a strong signal to other markets. With over 50% of Ripple’s On-Demand Liquidity volume already coming from Asia, RLUSD could expand into Singapore, South Korea, and other regional hubs, cementing Ripple’s position as a leading blockchain payment company.

    For XRP holders, this development is positive in the long run. RLUSD strengthens Ripple’s overall financial ecosystem, driving broader institutional adoption and network utility. Japan may be just the first step in a global stablecoin expansion that could become a major growth driver for Ripple and XRP.

    FAQs

    1. What is RLUSD?
    RLUSD is Ripple’s 1:1 US dollar-pegged stablecoin, fully backed by cash reserves and short-term US government bonds, designed for banks and institutions needing stable digital payments.

    2. Why did Ripple launch RLUSD in Japan?
    Japan offers clear crypto regulations and a strong partnership with SBI Holdings, enabling a compliant rollout approved by Japan’s Financial Services Agency.

    3. Does RLUSD replace XRP?
    No. RLUSD serves institutions requiring zero volatility, while XRP remains the high-speed bridge asset for cross-border transfers in Ripple’s payment network.

    4. How big is RLUSD right now?
    RLUSD has a market cap of about $1.59 billion with nearly 271% annual growth.

    5. Why does this matter for XRP investors?
    RLUSD attracts more traditional finance into the Ripple ecosystem, increasing network activity and potentially strengthening long-term demand for XRP.

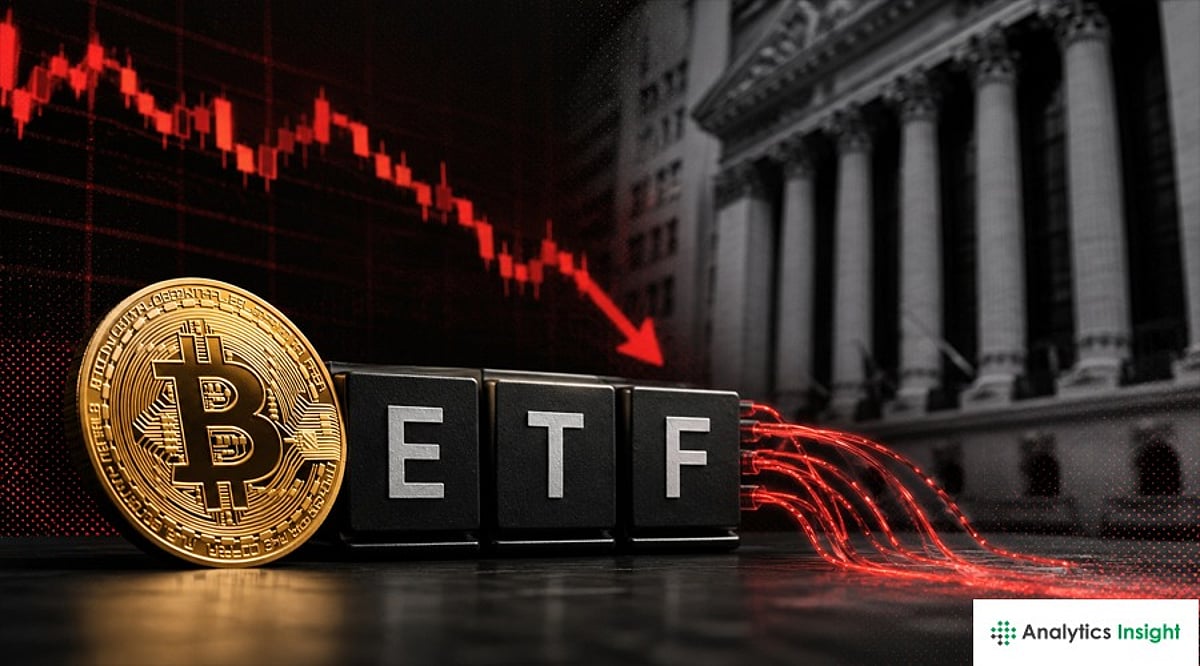
  • Bitcoin ETF Assets Drop Below $73 Billion as BTC Falls Under $60,000 – June Outflows Hit $3.61 Billion

    Bitcoin ETF Assets Drop Below $73 Billion as BTC Falls Under $60,000 – June Outflows Hit $3.61 Billion

    US-listed spot Bitcoin exchange-traded funds recorded $696.3 million in net outflows on June 25 as Bitcoin slipped below the $60,000 mark. This marked the largest single-day withdrawal in June and extended the funds’ losing streak to six consecutive trading days.

    The latest outflow pushed June total withdrawals to $3.61 billion and brought year-to-date net outflows to approximately $4.6 billion. The data signals weakening demand from institutional investors as Bitcoin trades near its lowest level of 2026.

    ETF activity has become a key focus for market participants. These products previously provided steady buying pressure, but persistent redemptions are now returning coins to the market while investors reassess risk across cryptocurrencies and high-growth tech assets globally.

    Bitcoin ETF Withdrawals Accelerate in June

    The June 25 outflow surpassed the previous monthly high of $519.2 million recorded on June 2. Second-quarter net withdrawals now stand at roughly $4.07 billion, despite the funds attracting nearly $1.97 billion in April.

    Investors withdrew about $2.43 billion in May and another $3.61 billion in June, bringing the combined two-month total to approximately $6.04 billion. Spot Ether ETFs also posted about $81.87 million in outflows on the same day.

    BlackRock’s iShares Bitcoin Trust led second-quarter losses with roughly $2.01 billion in net outflows. The fund saw around $4.02 billion in withdrawals across May and June, reducing its net assets to about $44.43 billion. Fidelity’s Bitcoin fund recorded approximately $889 million in second-quarter withdrawals.

    ETF Assets Fall as Bitcoin Tests Lower Prices

    Total assets held by US spot Bitcoin ETFs dropped to about $72.6 billion, the lowest level since late 2024 and a decline of nearly 57% from the October 2025 peak of $169.5 billion.

    The drop coincided with Bitcoin losing roughly half its value from its October high. The cryptocurrency touched a 2026 low near $58,190 on Thursday before recovering toward $60,000.

    Separate wallet data shows the ETFs hold about 1.24 million BTC, with roughly 63,500 BTC leaving the products over the past 30 days. This has raised fresh questions about short-term institutional demand. Traders are watching whether daily ETF withdrawals slow near the $60,000 level and monitoring trading volume, derivatives funding rates, and open interest for signs of additional selling pressure.

    Strategy Slows Purchases as Funding Questions Grow

    Strategy bought about 3,600 BTC in June, down sharply from nearly 25,000 BTC in May and more than 50,000 BTC in April. Company filings also showed a net sale of 32 BTC earlier in the month, an unusual move during its long accumulation campaign.

    The company’s STRC preferred stock closed at $75.69 on Thursday, down 6.37% and well below its intended $100 benchmark. Some analysts have questioned whether Strategy should pause Bitcoin purchases and rebuild cash while market prices remain under pressure.

    CryptoQuant analysts expressed doubts about the company’s buying schedule and risk controls. Bitcoin supporter Samson Mow offered a different perspective, noting that STRC has a “self-repairing mechanism” when it trades below $100. He said Strategy can stop issuing new shares through its at-the-market program, which limits added supply.

    Bitcoin’s near-term direction may depend on whether ETF flows stabilize. Investors are also watching large technology shares, as stronger demand for artificial intelligence stocks has drawn capital away from other assets.

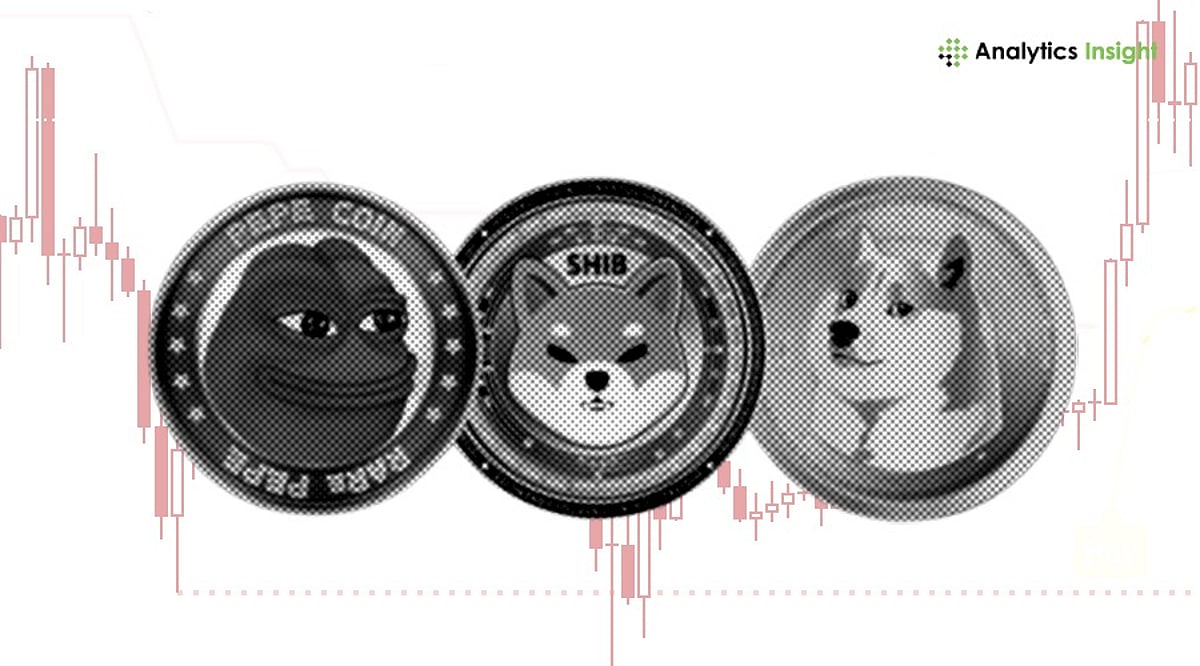
  • MemeCore Surges 3,500% as Dogecoin and Shiba Inu Face Market Headwinds

    MemeCore Surges 3,500% as Dogecoin and Shiba Inu Face Market Headwinds

    The meme coin market has entered a difficult phase in 2026. Big names like Dogecoin (DOGE) and Shiba Inu (SHIB), which once led this space, now face strong pressure. Prices remain weak, market excitement has dropped, and many traders have started to look for fresh opportunities.

    Given this shift, a new project called MemeCore has started to catch major attention. Recent market data shows that while older meme coins continue to struggle, MemeCore has quickly become one of the most talked-about names in crypto.

    Dogecoin Faces Weak Momentum

    Dogecoin has remained the biggest meme coin for many years. It started as a joke but later became one of the most popular cryptocurrencies after strong support from online communities and public figures.

    However, DOGE has lost momentum in recent weeks. Latest market data shows Dogecoin trading close to $0.09, with a 5% drop over the last seven days. Price charts show repeated failed recovery attempts, which have raised concern among traders.

    The problem for Dogecoin right now comes from lower buying pressure. During earlier market rallies, DOGE moved fast given hype and social media attention. This time, that excitement has become much weaker.

    Shiba Inu Also Remains Under Pressure

    Shiba Inu once stood as the biggest competitor to Dogecoin. The project built a strong community and later expanded with products like Shibarium, which aimed to create a larger ecosystem around the token.

    But recent performance shows SHIB also faces difficulties. Current data places SHIB near $0.0000060, while overall trading activity has stayed relatively weak. Price movement has remained slow for several weeks.

    Even though developers continue to work on ecosystem growth, market interest has fallen compared with earlier years. During the last major meme coin rally, SHIB attracted massive retail demand. Right now, that same excitement no longer exists at the same level.

    The Meme Coin Sector Slows Down

    The struggle of DOGE and SHIB reflects a bigger change in the meme coin market. Industry reports show the total meme coin sector has lost a large part of its earlier market value after strong corrections hit speculative crypto assets.

    In past years, meme coins mostly depended on internet jokes, hype, and social media trends. But the market now looks very different. Many investors now prefer projects that offer stronger token systems, lower transaction costs, and bigger ecosystems instead of tokens that survive as a result of popularity.

    MemeCore Quickly Gains Attention

    MemeCore has become one of the biggest surprise projects of this year. Unlike older meme coins, MemeCore has built interest not only through community hype but also through technical improvements.

    One major update this year reportedly reduced network transaction costs by nearly 100 times, which immediately attracted attention across the crypto market. After this update, the native token called M saw a massive rally. The project soon became one of the fastest-rising meme assets in the entire sector.

    MemeCore Overtakes SHIB in Market Value

    One of the biggest crypto stories this year came after MemeCore reportedly moved past Shiba Inu in market capitalization for a short period. Recent reports showed MemeCore reaching almost $4.79 billion in market capitalization, which briefly made it the second-largest meme coin after Dogecoin.

    This sudden jump brought huge market attention. Many traders started to view MemeCore as the next possible breakout project in the meme coin sector.

    Strong Growth Despite Price Pullback

    Current data shows the token trading below its all-time high of $4.82, while the project still holds a fully diluted valuation above $15 billion. Over the last seven days, price data shows a correction between 8% and 11%.

    Even after this decline, long-term numbers remain extremely strong. Some market analysts estimate MemeCore has delivered returns of more than 3,500% since launch, one of the strongest performances among new crypto projects this cycle.

    Could MemeCore Become the Next Big Winner?

    The crypto market often rewards projects that bring something new. Right now, Dogecoin and Shiba Inu continue to face slower growth and weaker momentum. Meme coins still remain risky assets, and sharp price drops can happen anytime. But current trends show that the market no longer rewards hype alone. If this trend continues, MemeCore may become the next major winner in the meme coin market, while DOGE and SHIB continue to fight through one of their toughest periods in recent years.

  • Solana Surges Past $70 as ETF Inflows Hit $1.45 Billion – Is Institutional Demand Fueling the Next Rally?

    Solana Surges Past $70 as ETF Inflows Hit $1.45 Billion – Is Institutional Demand Fueling the Next Rally?

    Solana has reclaimed the crucial $70 price level, sparking renewed optimism across the cryptocurrency market. The move above this key resistance comes on the back of massive exchange-traded fund (ETF) inflows totaling $1.45 billion, alongside rising institutional participation and robust network activity. Analysts now eye targets at $75, $85, and even $97 if bullish momentum persists.

    Key Takeaways

    • Solana climbed from recent lows near $61.50 to trade between $71 and $72.
    • Spot Solana ETFs have attracted nearly $1.45 billion in cumulative inflows since launch.
    • Major financial institutions, including Goldman Sachs, now hold Solana ETF exposure worth $108 million.
    • Technical indicators show recovery, with the 14-day RSI bouncing from oversold levels.
    • Strong on-chain activity from projects like Jupiter and Pump.fun supports network fundamentals.

    ETF Demand Ignites Market Sentiment

    The primary driver behind Solana’s resurgence is surging demand for spot Solana ETFs. Throughout 2026, institutional investors have steadily increased allocations to Solana products, even during broader crypto market weakness. Data shows total inflows into Solana ETFs have reached $1.45 billion, signaling a structural shift in capital flow. This pattern mirrors earlier rallies seen in Bitcoin and Ethereum after their own ETF launches, where institutional buying provided a robust price floor.

    Institutional Giants Enter the Arena

    Another major catalyst stems from participation by traditional finance titans. Earlier this year, reports confirmed that Goldman Sachs holds approximately $108 million in Solana ETF exposure. Such institutional involvement boosts market confidence, as large investors typically commit for the long term, reducing volatility and supporting sustained upward movement.

    Network Activity Remains Strong

    Beyond ETF demand, Solana’s blockchain continues to thrive. High-traffic platforms such as the decentralized exchange aggregator Jupiter and meme token platform Pump.fun dominate network usage. Elevated transaction volume leads to higher fee generation and increased demand for SOL tokens, underpinning the asset’s fundamental value.

    Technical Indicators Turn Bullish

    From a technical standpoint, Solana’s 14-day Relative Strength Index (RSI) fell to 28 earlier this month, indicating oversold conditions historically preceding short-term recoveries. Price has since bounced from the $61.50 low, and the $65 support zone has held firm. The break above $70 has shifted market sentiment from bearish to cautiously optimistic.

    Risks and Caution

    Despite the positive momentum, risks remain. Broader market weakness persists; Bitcoin ETFs saw nearly $2.97 billion in outflows over a ten-session stretch earlier in June. If global financial uncertainty returns, risk assets like Solana could face renewed selling pressure. However, strong structural inflows provide a buffer that many other cryptocurrencies lack.

    What Lies Ahead for Solana?

    The immediate resistance stands at $75. A decisive breakout above that level could open the door to $85, where previous selling pressure emerged. Beyond that, the $97 mark represents a critical milestone for confirming a broader uptrend in the second half of 2026. The combination of institutional ETF demand, vibrant network activity, and improving technicals gives Solana a solid foundation for further gains.

    Disclaimer: This article is for informational purposes only and does not constitute financial advice. Cryptocurrency investments carry risk. Always conduct your own research before investing.