Introduction
Data visualization has evolved beyond simple chart creation. Recruiters now look for candidates who can transform complex data into actionable business insights. Whether you’re a Data Analyst, Business Intelligence professional, or Product Analyst, this guide covers the most common interview questions, sample answers, and preparation tips to help you stand out.
1. What Is Data Visualization?
Sample Answer: Data visualization is the graphical representation of information using charts, maps, graphs, and dashboards. It helps users quickly identify patterns, trends, and outliers that might go unnoticed in raw data, enabling faster and more informed decision-making.
2. Which Data Visualization Tools Have You Used?
Sample Answer: I have hands-on experience with Microsoft Power BI, Tableau, Excel, Google Looker Studio, and Python libraries such as Matplotlib, Seaborn, and Plotly. My choice of tool depends on project requirements—Power BI for enterprise reporting, Tableau for exploratory analysis, and Python for custom visualizations.
3. How Do You Choose the Right Chart?
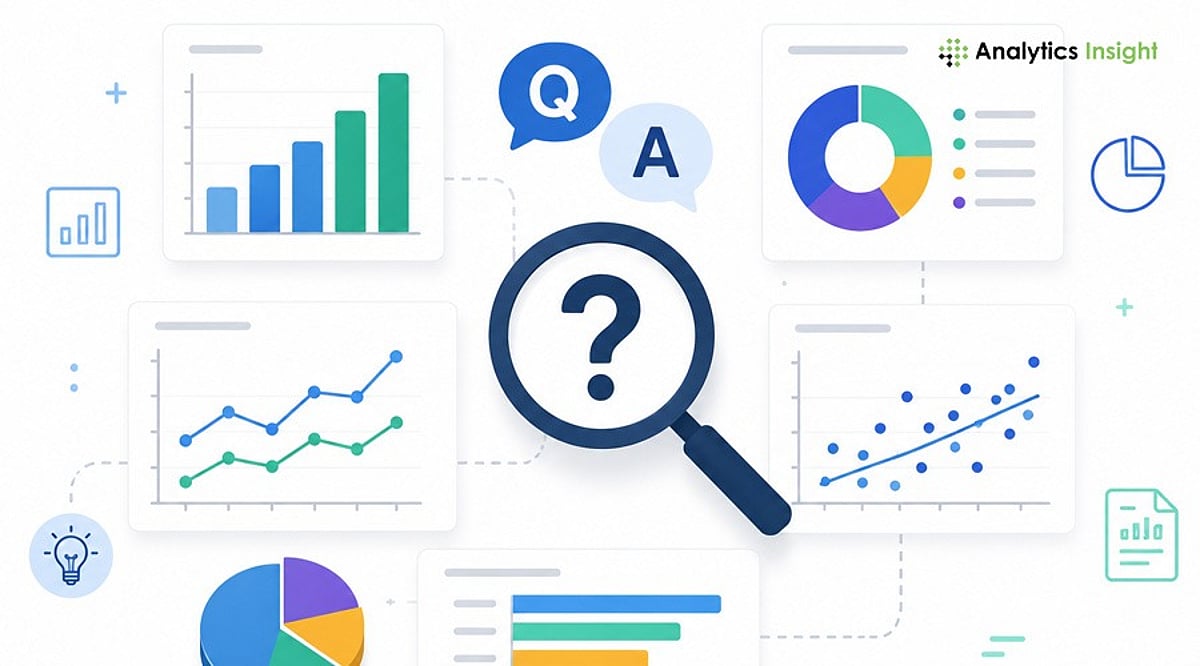
Sample Answer: The chart type should match the story the data tells. Bar charts compare categories; line charts show trends over time; pie charts display simple proportions; scatter plots reveal relationships between variables; and maps visualize geographic data. I always prioritize clarity and ease of interpretation.
4. What Makes a Good Dashboard?
Sample Answer: A good dashboard is simple, organized, and aligned with business objectives. It highlights key performance indicators (KPIs), avoids unnecessary clutter, uses consistent colors, and allows users to find information quickly. Every element should serve a decision-making purpose.
5. What KPIs Have You Displayed in Dashboards?
Sample Answer: KPIs vary by industry. Common examples include revenue, sales growth, customer acquisition cost, conversion rate, customer retention, profit margin, inventory levels, and website traffic. The dashboard should always show metrics that directly support stakeholder decisions.
6. How Do You Handle Large Datasets?
Sample Answer: I clean data by removing redundant fields, apply data modeling, create summary tables, and use filters. To boost performance, I implement incremental refresh, optimized SQL queries, and efficient calculations. Pre-aggregation and indexing also help maintain speed.
7. What Are Common Data Visualization Mistakes?
Sample Answer: Frequent mistakes include using too many colors, choosing the wrong chart type, displaying unnecessary information, poor labeling, overcrowded dashboards, ignoring accessibility, and misleading scales or axes. Keeping visuals simple and purposeful improves readability and trust.
8. How Do You Ensure Data Accuracy?
Sample Answer: I cross-check dashboard values against original data sources, validate calculations, and test filters and business logic with stakeholders. Before publishing, I conduct user testing to confirm numbers meet business expectations and that no errors exist.
9. Can You Explain a Dashboard You Built?
Sample Answer: I built a sales performance dashboard that integrated data from multiple regions. It displayed revenues, profits, monthly sales trends, and product performance. Filters allowed drill-down by region, product category, and sales representative, enabling regional managers to identify opportunities quickly.
10. How Do You Present Insights to Non-Technical Stakeholders?
Sample Answer: I avoid technical jargon and focus on business implications. Instead of explaining how I calculated the numbers, I discuss what the data shows, why it matters, and what actions should be taken. Clear, story-driven communication turns data into decision fuel.
Tips to Perform Better in Data Visualization Interviews
- Build two or three dashboard projects for your portfolio.
- Practice explaining dashboards in simple, non-technical language.
- Learn when to use different chart types and why.
- Understand basic data modeling concepts (star schema, measures, dimensions).
- Review common KPIs for your target industry.
- Be ready to discuss design decisions, not just technical features.
Real project experience often makes a stronger impression than theoretical knowledge.
Final Thoughts
Data visualization interviews go beyond technical proficiency. Employers want candidates who understand the business context, communicate insights effectively, and empower decision-makers. By preparing these common questions and practicing with real dashboards, you can demonstrate both your technical skills and business mindset.
FAQs
What are the most common data visualization interview questions?
Most interviews cover chart selection, dashboard design, KPI tracking, data storytelling, visualization tools, handling large datasets, ensuring data accuracy, and explaining insights to stakeholders. Both technical knowledge and communication skills are assessed.
Which tools should I learn before an interview?
Power BI, Tableau, Excel, Google Looker Studio, and Python libraries (Matplotlib, Seaborn, Plotly) are widely used. Mastering at least one enterprise BI tool and understanding dashboard fundamentals significantly improves readiness.
How should I answer questions about dashboard design?
Focus on simplicity, business relevance, and usability. Explain how you prioritize KPIs, maintain consistent formatting, avoid clutter, and design for quick trend identification and informed decision-making.
How can I explain technical insights to non-technical stakeholders?
Avoid jargon and emphasize business outcomes. Explain what the data shows, why it matters, and what action to take. Clear communication is as important as technical expertise in analytics roles.
Do I need a portfolio for a data visualization interview?
Yes. A portfolio with dashboards, reports, and real-world projects demonstrates practical skills. Recruiters value hands-on experience and problem-solving ability more than certifications alone.