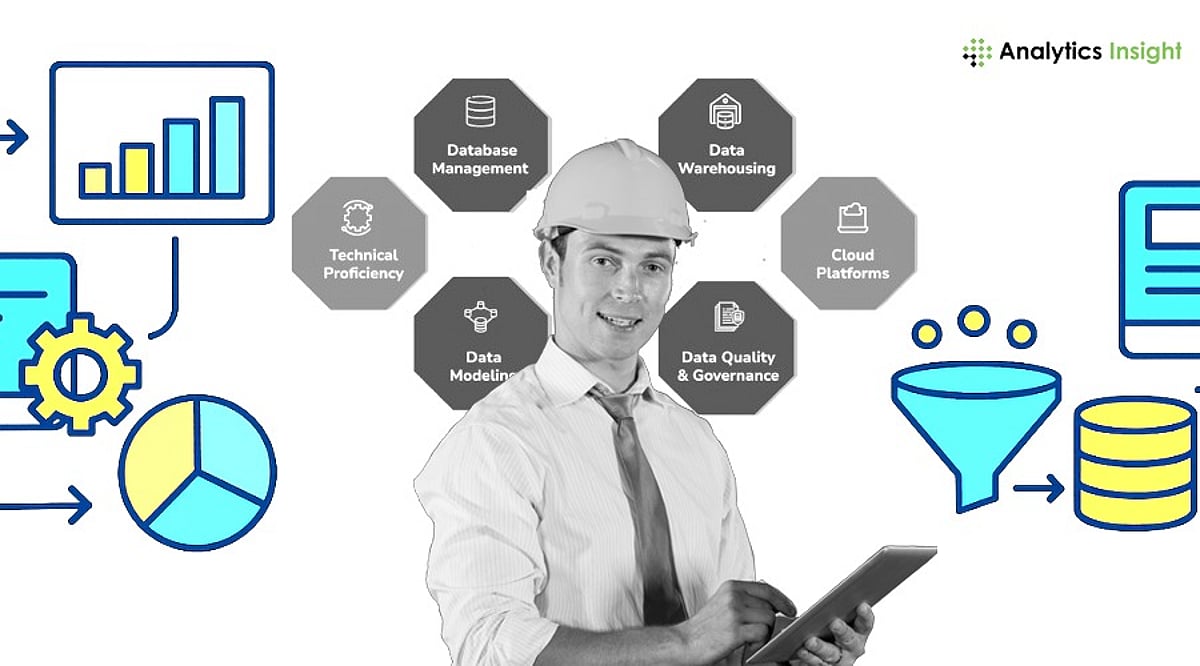
Data engineering is the foundation of every modern data system. Every website visit, online purchase, mobile app session, payment, and business transaction creates new information. That information has little value unless it is collected, cleaned, stored, and prepared for analysis. This is exactly where data engineering plays a major role.
The need for skilled data engineers has grown rapidly because companies depend on data for daily decisions, automation, customer service, and artificial intelligence (AI). According to IDC, the world is expected to create more than 394 zettabytes of data by 2028, a huge jump from previous years. This massive growth has pushed businesses to build stronger and smarter data platforms that can support analytics and AI at a much larger scale.
Data engineering is no longer limited to moving data from one place to another. It focuses on speed, quality, security, and reliability so that every team can trust the information they use.
How a Data Engineering Process Works
The data engineering process is structured straightforwardly. The process begins with the steps where data gets collected from external sources such as websites, mobile applications, sensors, software of the company, or databases.
After data information has been collected, a series of preparation processes are conducted. The next stage of the process is the preparation of the data, where incorrect data is deleted, missing values are repaired, and data is formatted in a valuable way. After that, the collected data is checked for quality compliance.
Finally, the collected data is ready for use in the generation of reports, machine learning models, dashboards, and other business applications. Each step has its specific role. Any issue at any step may lead to the failure of the reports, predictions, or AI models.
Skills that Matter Most
Recognized as one of the most sought-after profiles within the IT industry, data engineers require a combination of technical skills and hands-on problem-solving capability. Indeed, almost every database makes use of SQL.
Knowledge of cloud technologies has become more critical than ever as many businesses today maintain their data in the cloud rather than in-house. Experience in counteracting bottlenecks and making quick fixes has been a plus in providing better and faster systems.
As per the 2026 hiring trends, it is evident that employers favor hiring professionals who possess knowledge in traditional data engineering methods and also have working knowledge about AI.
Modern Data Storage
Data storage has changed a lot during the last few years. Data warehouses such as Snowflake, Google BigQuery, Amazon Redshift, and Azure Synapse Analytics remain popular because they support fast business reporting.
Many organizations also use data lakes like Amazon S3, Azure Data Lake Storage, and Google Cloud Storage to keep large amounts of raw information at a lower cost.
A newer approach called the lakehouse has become one of the biggest trends. Platforms such as Databricks, Apache Iceberg, Delta Lake, and Apache Hudi combine the strengths of both data lakes and data warehouses. This design gives businesses better flexibility without sacrificing performance.
Batch Processing and Real-Time Data
Not every business needs data at the same speed. Some reports only require updates once a day. This method is called batch processing. It suits financial reports, historical analysis, and large scheduled jobs because it costs less and stays simple to manage.
Other businesses cannot wait for scheduled updates. Online payments, fraud detection, recommendation systems, and live dashboards need information within seconds. This approach is known as real-time processing.
Many companies now use both methods together. Real-time systems handle urgent tasks, while batch systems process large historical datasets.
What Makes a Strong Data Pipeline
A reliable data pipeline contains several connected parts. Data first enters the system through source applications. After collection, it passes through processing layers that clean and organize the information.
The pipeline also includes monitoring tools that detect failures before they become major problems. Security controls protect sensitive information, while backup systems reduce the risk of data loss. Together, these components help the entire system stay stable even as data volumes continue to grow.
Why Data Quality Matters
Good decisions depend on good data. Even small mistakes can produce incorrect reports or poor AI predictions.
Modern platforms check for duplicate records, missing values, invalid formats, unexpected schema changes, incomplete information, and inconsistent records. Freshness also matters because outdated data can lead to wrong business decisions.
Automated quality checks have become a standard feature in enterprise data platforms because manual reviews cannot keep pace with today’s data volumes.
Cloud Platforms Continue to Lead
Cloud technology has become the preferred choice for new data projects. Amazon Web Services, Microsoft Azure, and Google Cloud Platform continue to dominate this market. These platforms offer storage, processing power, data warehouses, monitoring services, and workflow management without the need for expensive physical servers.
Companies also benefit from automatic scaling, which allows systems to handle larger workloads whenever demand increases. This flexibility has made cloud infrastructure the standard choice for businesses of every size.
Popular Open-Source Technologies
The role of open-source apps is notable today in the field of data engineering. Apache Spark brings a solution for the processing of huge data by distributing tasks across numerous machines. Apache Kafka has made it possible to achieve speed in data transmission between applications, and Apache Airflow provides solutions for planning and organizing complex operations.
Other common technologies are Apache Flink, dbt, Apache Iceberg, Delta Lake, and Great Expectations. Apache Spark remains one of the most popular distributed analytics engines in the world.
Data Models that Organize Information
A good data model makes information easier to understand and analyze. The Star Schema works well for business reports because it keeps queries simple and delivers faster results. The Snowflake Schema reduces duplicate information through normalization, which saves storage space.
Large enterprises often choose the Data Vault model because it keeps historical records, supports business growth, and adapts more easily when new data sources appear. The best model depends on business goals rather than company size alone.
Security Cannot be Ignored
Every data platform must protect valuable information. Encryption keeps data safe during storage and transfer. Identity management verifies who can access the system, while role-based permissions limit access to authorized users only.
Many companies also use multi-factor authentication, audit logs, data masking, regular backups, and compliance checks to strengthen security. As AI becomes more common, strong governance and data protection have become basic business requirements rather than optional features.
Better Performance Saves Time and Money
Fast systems reduce costs and improve productivity. Engineers improve performance through partitioning, compression, efficient file formats, incremental updates, query optimization, metadata indexing, automatic resource scaling, and parallel execution. These methods reduce processing time and help businesses complete large workloads with fewer computing resources.
Metrics Every Team Should Watch
Successful data teams measure system performance every day. Important metrics include pipeline success rate, failure rate, processing latency, throughput, storage use, query response time, data freshness, infrastructure cost, resource utilization, and overall service availability. These numbers help teams detect problems early, improve efficiency, and maintain reliable operations.
Biggest Data Engineering Trends in 2026
Several trends continue to reshape the industry. AI now assists pipeline development and reduces repetitive work. Agentic automation handles routine engineering tasks with minimal human effort. Lakehouse architecture has become the preferred storage approach for many organizations.
Metadata-driven pipelines, data contracts, unified governance, streaming analytics, intelligent cost optimization, and closer integration between machine learning and data engineering have also become common across modern enterprises.
These advances allow companies to build faster, more reliable, and more intelligent data systems than ever before.
Final Thoughts
Data engineering has become one of the main components of modern technology. The effectiveness of different dashboards, analytical tools, AI systems, and business reports depends on well-organized data.
The significance of reliable data solutions will acquire new meaning as the amount of data created worldwide may reach 394 zettabytes by 2028. It is expected that organizations that concentrate on robust security systems, high data quality, contemporary cloud solutions, and scalable architecture will be much more ready for the future.