Tag: Data Visualization

  • Power BI Explained: Key Components, Features, and How It Drives Business Insights

    Power BI Explained: Key Components, Features, and How It Drives Business Insights

    In today’s data-driven landscape, collecting information isn’t enough. Organizations need the right tools to organize, analyze, and visualize data to make smarter decisions. Microsoft Power BI is one such business analytics service that empowers teams to turn raw data into actionable insights.

    What Is Power BI?

    Power BI is a suite of software, apps, and connectors that pulls data from multiple sources—such as Excel files, cloud services, and databases—and transforms it into interactive reports and dashboards. Users can then model, analyze, and share this information across their organization, enabling better decision-making without relying on manual data inspection.

    Core Components of Power BI

    Power BI’s ecosystem is made up of several components, each serving a distinct role in the analytics workflow.

    Power BI Desktop

    Power BI Desktop is a free Windows application used primarily by analysts and report developers. It provides tools for connecting to data sources, cleaning and shaping data, building data models, and designing visuals. Once a report is complete, it can be published to the Power BI Service for broader access.

    Power BI Service

    Power BI Service is the cloud-based sharing and publishing platform. It allows users to view dashboards in a browser, collaborate on reports, and schedule automatic data refreshes so teams always work with the latest information.

    Power BI Mobile

    With native apps for Android and iOS, Power BI Mobile keeps business intelligence accessible on the go. Users can interact with live dashboards and reports from anywhere, staying connected to key metrics and performance indicators.

    Power BI Gateway

    The Power BI Gateway acts as a secure bridge between on-premises data sources and the cloud-based service. This lets organizations keep sensitive data on local servers while still using Power BI’s analytics and reporting features.

    Power BI Report Server

    For organizations that need to keep reports behind their own firewall, the Power BI Report Server offers an on-premises option. It delivers the same reporting capabilities while allowing companies to maintain full control over their data infrastructure.

    Key Features and Capabilities

    Power BI is more than just a visualization tool. It offers a broad set of features that make business intelligence accessible to both technical and non-technical users.

    • Broad Data Connectivity: Power BI connects to Excel, SQL Server, Google Analytics, Salesforce, and many other sources, making it possible to combine data from every corner of the business.
    • Interactive Visualizations: Users can build charts, maps, and graphs that allow filtering and drill-down, making it easier to explore complex datasets.
    • Real-Time Dashboards: Dashboards can stream live data and update automatically, giving organizations up-to-the-minute visibility into sales, customer behavior, and operational performance.
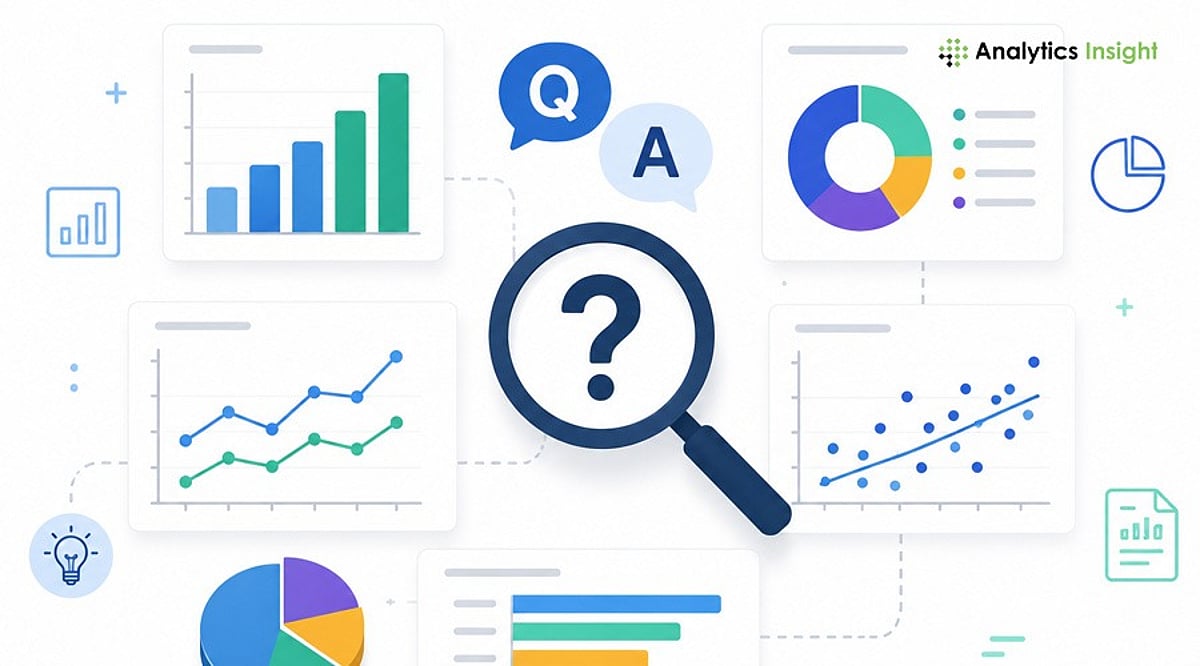
    • Natural Language Queries: The AI-backed Q&A feature lets users ask plain-language questions like “total sales in July” and receive immediate visual answers. This opens the platform to team members without SQL or coding expertise.
    • AI-Powered Insights: Machine learning capabilities assist in detecting patterns, forecasting trends, and even performing image classification, enabling deeper analysis than basic reporting allows.
    • Advanced Data Modeling with DAX: Data Analysis Expressions (DAX) provides a powerful formula language for creating custom calculations and measures, enabling rich and precise business metrics.

    Why Organizations Choose Power BI

    Businesses of all sizes adopt Power BI because it centralizes data collection, modeling, analysis, and visualization into one cohesive platform. Its automatic refresh capabilities eliminate the need for manual report preparation, while role-based access and security controls keep information safe. From a small company tracking Excel spreadsheets to a large enterprise analyzing continuous data streams, Power BI scales to meet demand.

    As the importance of data grows, Power BI stands out as a practical way to turn massive volumes of raw information into clear, actionable reports.

    Frequently Asked Questions

    What is Power BI used for?

    Power BI is used to analyze data, build interactive reports, and share dashboards that support data-driven decisions.

    What are the main components of Power BI?

    The core components are Power BI Desktop, Power BI Service, Power BI Mobile, Power BI Gateway, and Power BI Report Server.

    Can Power BI connect to multiple data sources?

    Yes, Power BI supports connections to a wide variety of sources, including Excel, SQL Server, cloud services, and marketing tools.

    Does Power BI provide real-time updates?

    Yes, Power BI supports real-time dashboards that refresh automatically with streaming data sources.

    Is Power BI suitable for large organizations?

    Yes, Power BI is scalable and can serve the needs of both small businesses and large enterprises.

  • A Beginner’s Roadmap to Data Science Tools: Python, SQL, and Visualization Libraries

    A Beginner’s Roadmap to Data Science Tools: Python, SQL, and Visualization Libraries

    Key Takeaways

    • Python, SQL, and Pandas form the foundation of modern data science.
    • Hands-on practice with Kaggle and Google Colab strengthens practical skills.
    • Visualization and version control tools improve project quality and career readiness.

    Data science can seem overwhelming at first, but selecting the appropriate tools simplifies the learning curve. Each tool serves a distinct purpose: some gather data, some organize it, while others create charts or build machine learning models. Rather than trying to learn dozens of programs at once, beginners see better results by focusing on a core set of essential tools. Recent learning guides and industry experts recommend this approach, as it builds strong practical skills before tackling advanced topics. A solid grasp of these tools also makes project work easier and prepares learners for internships and entry-level jobs.

    Python: The First Language to Learn

    Python has become the most popular programming language in data science because of its readability and simplicity. Even people with no coding background can learn its basics without much difficulty. Python helps clean raw data, analyze information, automate tasks, and create machine learning models. It also supports artificial intelligence projects, making it useful beyond beginner-level work. Another reason for its popularity is its vast collection of libraries. Instead of writing long programs from scratch, learners can use ready-made libraries that save time and reduce effort.

    Pandas and NumPy Make Data Easy to Handle

    Pandas and NumPy are two essential Python libraries that beginners should know. Pandas helps organize and clean datasets using simple commands. It can combine files, handle missing (NaN) values, and prepare data for analysis. These tasks are part of almost every data science project, so becoming familiar with Pandas is important early on. NumPy works with numbers and mathematical calculations. It is much faster than standard Python code when working with arrays and matrices. Moreover, many machine learning libraries are built on NumPy, so understanding it is necessary.

    Jupyter Notebook Creates a Better Learning Experience

    Jupyter Notebook offers an interactive workspace where code, text, and charts appear on the same page. This format helps beginners understand every step of a project, as explanations stay next to the code. Many teachers, researchers, and data scientists use Jupyter Notebook for tutorials, reports, and experiments. When mistakes appear, small sections of code can run separately, making debugging much easier than traditional programming methods.

    SQL Remains an Essential Skill

    Most companies store business information inside databases. SQL helps access that information quickly and efficiently. Beginners should learn basic commands such as SELECT, JOIN, GROUP BY, filtering, and aggregate functions, as these appear regularly in real business tasks. Industry reports continue to list SQL among the most requested skills for entry-level data science and data analytics jobs. Strong SQL knowledge also helps professionals work with large datasets without depending on spreadsheets.

    Excel Still Has an Important Place

    Even with advanced tools in the spotlight, Microsoft Excel still plays an important role in data science. Many firms use Excel for report generation, quick calculations, and simple analyses. Excel features such as Pivot Tables, Charts, Lookup Functions, and Data Cleaning tools make it easy to explore data without writing complex programs. For anyone starting out, Excel is a solid first step toward data analysis.

    Data Visualization Brings Numbers to Life

    Charts often explain data better than large tables. Matplotlib and Seaborn help create clear visualizations from Python data. These libraries produce bar charts, line charts, scatter plots, histograms, and heatmaps with just a few lines of code. Good visualizations help identify trends, compare values, and discover hidden patterns. Before building any machine learning model, data scientists usually study charts to understand the information more clearly.

    Scikit-learn Opens the Door to Machine Learning

    Once learners understand the basics of data analysis, Scikit-learn provides a reliable and simple introduction to machine learning. It offers popular algorithms such as Linear Regression, Logistic Regression, Decision Trees, Random Forests, and K-Means Clustering. Beginners can build predictive models without needing deep mathematical knowledge. Thanks to its simplicity and effective documentation, Scikit-learn is a great choice for newcomers.

    Git, GitHub, and Cloud Learning Platforms

    GitHub helps track project changes and maintain version history. It also enables collaboration when multiple developers work on the same project. Google Colab allows beginners to code without installing any software, and it provides free access to GPUs, making projects more accessible. Projects can be shared with classmates or mentors via a simple link. Kaggle is another excellent tool, offering thousands of datasets, coding notebooks, and tutorials for hands-on practice.

    Power BI and Tableau for Business Reporting

    Many organizations expect data specialists to present findings clearly and compellingly. Power BI and Tableau allow users to create responsive dashboards that illustrate business results, sales patterns, customer habits, and performance metrics. Beginners do not need to learn both platforms; mastering one visualization tool is enough for most entry-level positions. Using such dashboards improves communication, making key findings obvious to decision-makers regardless of their technical background.

    Why This Matters

    Learning the right data science tools from the beginning saves time and builds practical skills that employers value. Knowledge of Python, SQL, Jupyter Notebook, and Power BI helps solve real business problems, complete projects with confidence, and create a strong foundation for advanced analytics, machine learning, and future career growth.

    A Smart Learning Path

    A practical learning order makes the journey smoother. Start with Excel to build basic data understanding, then move to Python fundamentals, NumPy, Pandas, and SQL. After that, visualization libraries like Matplotlib and Seaborn help present insights clearly. Jupyter Notebook supports project work, while Scikit-learn introduces machine learning. Git and GitHub help organize projects, and Power BI or Tableau improve reporting skills. Google Colab and Kaggle complete the toolkit with cloud-based practice and real datasets. Recent learning roadmaps also encourage project-based learning instead of endless theory, as practical experience creates stronger skills and better job opportunities.

    Frequently Asked Questions

    1. Which programming language should beginners learn first for data science? Python is the best starting language because its simple, readable syntax makes it easy to learn while offering powerful data science libraries.
    2. Is SQL necessary for data science? Yes. SQL is essential for querying, retrieving, and managing large datasets stored inside relational databases.
    3. Should Excel be learned before Python? Learning basic Excel first helps build foundational data analysis skills, such as filtering and pivot tables, before transitioning to programming with Python.
    4. Is Google Colab better than installing Python locally? Google Colab is ideal for beginners as it runs entirely in your web browser with zero local installation or complex environment setup required.
    5. Why is Kaggle useful for beginners? Kaggle provides free access to real-world datasets, community code notebooks, and tutorials that help beginners build practical experience and strong portfolios.
  • Top 10 Data Analytics Certifications to Boost Your Career in 2026

    Top 10 Data Analytics Certifications to Boost Your Career in 2026

    In 2026, data analytics certifications remain a powerful tool for professionals aiming to validate their skills and stand out in a competitive job market. Whether you’re a beginner or an experienced analyst, the right certification can sharpen your expertise in SQL, visualization, reporting, and business intelligence—while signaling to employers that you can solve real-world problems with data.

    Below, we break down the ten most valuable data analytics certifications for 2026, covering everything from entry-level credentials to advanced, cloud-focused designations. Each certification is chosen for its relevance, industry recognition, and practical, hands-on focus.

    1. Google Data Analytics Professional Certificate

    An excellent starting point for beginners, this certification covers the fundamentals: cleaning data in spreadsheets, writing SQL queries, creating basic visualizations, and translating numbers into actionable business insights. No prior technical background is required, making it a solid first step toward a career in analytics.

    2. Microsoft Power BI Data Analyst Associate

    Ideal for business intelligence professionals, this certification focuses on data preparation, modeling, dashboard creation, and DAX (Data Analysis Expressions). It’s a perfect fit for organizations already using Microsoft products and needing skilled report creators.

    3. CompTIA Data+

    A vendor-neutral certification that covers data governance, reporting, and interpretation. It’s great for beginners who want a broad, foundational understanding of analytics without being tied to a specific platform. Data+ is especially useful for analysts who value versatility.

    4. IBM Data Analyst Professional Certificate

    This project-based certificate teaches Excel, SQL, Python, and dashboard creation. It’s designed to build practical skills and a portfolio—ideal for those who want to demonstrate hands-on ability to employers.

    5. Certified Analytics Professional (CAP)

    An advanced certification for seasoned analysts, CAP validates end-to-end analytical skills: problem formulation, methodology selection, data analysis, and business impact assessment. It’s best for professionals seeking strategic recognition in analytics.

    6. aCAP (Associate Certified Analytics Professional)

    Targeted at early-career professionals, aCAP introduces core principles, standards, and professional requirements. It’s a stepping stone for those not yet ready for the full CAP certification.

    7. Tableau Certified Data Analyst

    Focused on visualization and dashboarding, this certification proves you can connect to data, prepare it, analyze it, and communicate insights using Tableau. It’s particularly valuable for roles that require clear data storytelling.

    8. AWS Certified Data Analytics – Specialty

    For cloud-focused roles, this certification covers data pipelines, storage, analytics services, and large-scale workflow management on AWS. It’s suited for engineers and data professionals working in cloud-based environments.

    9. SAS Advanced Analytics Professional

    Essential for industries heavily reliant on SAS, this certification demonstrates advanced statistical and analytical abilities. It’s highly relevant for sectors like healthcare, finance, and insurance where SAS is a standard tool.

    10. Cloudera Certified Associate Data Analyst

    Relevant for big data environments, this certification validates SQL analysis and querying on Cloudera platforms. It’s ideal for analysts working with large datasets who need to prove their competence in handling massive data volumes.

    The Road Ahead

    In 2026, data analytics certifications are valued for their practical, hands-on focus. Employers prioritize credentials that prove real skill in SQL, dashboards, cloud tools, and business thinking. While certifications alone won’t guarantee a job, they give candidates a strong edge when combined with portfolio projects and real-world experience. The best strategy: choose one focused certification, build a portfolio, and demonstrate you can solve actual business problems with data.

    FAQs

    Which data analytics certification is best for beginners?
    Google Data Analytics Professional Certificate and IBM Data Analyst Professional Certificate are excellent beginner-friendly choices because they cover SQL, spreadsheets, visualization, and practical analytics skills through hands-on projects.

    Do employers value data analytics certifications in 2026?
    Yes. Certifications remain valuable because they demonstrate verified technical skills, especially when combined with practical experience, portfolio projects, and the ability to solve real business problems using data.

    Which certification is best for Power BI professionals?
    The Microsoft Power BI Data Analyst Associate certification is ideal for professionals working with dashboards, data modeling, DAX, reporting, and business intelligence using Microsoft’s analytics ecosystem.

    Is AWS Data Analytics certification suitable for beginners?
    No. AWS Certified Data Analytics – Specialty is better suited for professionals with cloud analytics experience and knowledge of AWS services, data pipelines, and large-scale data processing environments.

    Are certifications enough to get a data analytics job?
    Certifications improve your resume, but employers also expect practical projects, SQL knowledge, visualization skills, problem-solving ability, and experience demonstrating how you analyze and communicate business insights effectively.

  • Top 10 Data Visualization Interview Questions for 2026: Expert Answers & Tips

    Top 10 Data Visualization Interview Questions for 2026: Expert Answers & Tips

    Introduction

    Data visualization has evolved beyond simple chart creation. Recruiters now look for candidates who can transform complex data into actionable business insights. Whether you’re a Data Analyst, Business Intelligence professional, or Product Analyst, this guide covers the most common interview questions, sample answers, and preparation tips to help you stand out.

    1. What Is Data Visualization?

    Sample Answer: Data visualization is the graphical representation of information using charts, maps, graphs, and dashboards. It helps users quickly identify patterns, trends, and outliers that might go unnoticed in raw data, enabling faster and more informed decision-making.

    2. Which Data Visualization Tools Have You Used?

    Sample Answer: I have hands-on experience with Microsoft Power BI, Tableau, Excel, Google Looker Studio, and Python libraries such as Matplotlib, Seaborn, and Plotly. My choice of tool depends on project requirements—Power BI for enterprise reporting, Tableau for exploratory analysis, and Python for custom visualizations.

    3. How Do You Choose the Right Chart?

    Sample Answer: The chart type should match the story the data tells. Bar charts compare categories; line charts show trends over time; pie charts display simple proportions; scatter plots reveal relationships between variables; and maps visualize geographic data. I always prioritize clarity and ease of interpretation.

    4. What Makes a Good Dashboard?

    Sample Answer: A good dashboard is simple, organized, and aligned with business objectives. It highlights key performance indicators (KPIs), avoids unnecessary clutter, uses consistent colors, and allows users to find information quickly. Every element should serve a decision-making purpose.

    5. What KPIs Have You Displayed in Dashboards?

    Sample Answer: KPIs vary by industry. Common examples include revenue, sales growth, customer acquisition cost, conversion rate, customer retention, profit margin, inventory levels, and website traffic. The dashboard should always show metrics that directly support stakeholder decisions.

    6. How Do You Handle Large Datasets?

    Sample Answer: I clean data by removing redundant fields, apply data modeling, create summary tables, and use filters. To boost performance, I implement incremental refresh, optimized SQL queries, and efficient calculations. Pre-aggregation and indexing also help maintain speed.

    7. What Are Common Data Visualization Mistakes?

    Sample Answer: Frequent mistakes include using too many colors, choosing the wrong chart type, displaying unnecessary information, poor labeling, overcrowded dashboards, ignoring accessibility, and misleading scales or axes. Keeping visuals simple and purposeful improves readability and trust.

    8. How Do You Ensure Data Accuracy?

    Sample Answer: I cross-check dashboard values against original data sources, validate calculations, and test filters and business logic with stakeholders. Before publishing, I conduct user testing to confirm numbers meet business expectations and that no errors exist.

    9. Can You Explain a Dashboard You Built?

    Sample Answer: I built a sales performance dashboard that integrated data from multiple regions. It displayed revenues, profits, monthly sales trends, and product performance. Filters allowed drill-down by region, product category, and sales representative, enabling regional managers to identify opportunities quickly.

    10. How Do You Present Insights to Non-Technical Stakeholders?

    Sample Answer: I avoid technical jargon and focus on business implications. Instead of explaining how I calculated the numbers, I discuss what the data shows, why it matters, and what actions should be taken. Clear, story-driven communication turns data into decision fuel.

    Tips to Perform Better in Data Visualization Interviews

    • Build two or three dashboard projects for your portfolio.
    • Practice explaining dashboards in simple, non-technical language.
    • Learn when to use different chart types and why.
    • Understand basic data modeling concepts (star schema, measures, dimensions).
    • Review common KPIs for your target industry.
    • Be ready to discuss design decisions, not just technical features.

    Real project experience often makes a stronger impression than theoretical knowledge.

    Final Thoughts

    Data visualization interviews go beyond technical proficiency. Employers want candidates who understand the business context, communicate insights effectively, and empower decision-makers. By preparing these common questions and practicing with real dashboards, you can demonstrate both your technical skills and business mindset.

    FAQs

    What are the most common data visualization interview questions?

    Most interviews cover chart selection, dashboard design, KPI tracking, data storytelling, visualization tools, handling large datasets, ensuring data accuracy, and explaining insights to stakeholders. Both technical knowledge and communication skills are assessed.

    Which tools should I learn before an interview?

    Power BI, Tableau, Excel, Google Looker Studio, and Python libraries (Matplotlib, Seaborn, Plotly) are widely used. Mastering at least one enterprise BI tool and understanding dashboard fundamentals significantly improves readiness.

    How should I answer questions about dashboard design?

    Focus on simplicity, business relevance, and usability. Explain how you prioritize KPIs, maintain consistent formatting, avoid clutter, and design for quick trend identification and informed decision-making.

    How can I explain technical insights to non-technical stakeholders?

    Avoid jargon and emphasize business outcomes. Explain what the data shows, why it matters, and what action to take. Clear communication is as important as technical expertise in analytics roles.

    Do I need a portfolio for a data visualization interview?

    Yes. A portfolio with dashboards, reports, and real-world projects demonstrates practical skills. Recruiters value hands-on experience and problem-solving ability more than certifications alone.

  • Top 10 Google Analytics 4 Tools for 2026: Comprehensive Comparison of Leading Platforms

    Top 10 Google Analytics 4 Tools for 2026: Comprehensive Comparison of Leading Platforms

    As businesses continue to rely on Google Analytics 4 (GA4) for event-based tracking and predictive insights, the right companion tools can unlock deeper data analysis, visualization, and optimization. Here’s a detailed comparison of the top 10 GA4 tools for 2026.

    1. Google Analytics 4 (Official)

    The cornerstone platform — GA4 itself offers event-based tracking, predictive insights, audience analysis, and cross-platform performance measurement for businesses of all sizes. It remains the primary hub for digital analytics.

    2. Looker Studio

    Looker Studio (formerly Google Data Studio) creates interactive dashboards that integrate seamlessly with GA4. Customizable visualizations, automated reporting, and collaborative business intelligence capabilities make it a top choice for data storytelling.

    3. Semrush

    Semrush combines website analytics with SEO intelligence, competitor research, keyword tracking, and dedicated GA4 integrations. Its all-in-one marketing dashboard is perfect for comprehensive performance analysis.

    4. Ahrefs

    Ahrefs supports traffic analysis, backlink monitoring, keyword insights, and content performance evaluation. Its integration with Google Analytics reporting workflows enables strategic optimization for organic growth.

    5. Mixpanel

    Mixpanel delivers advanced product analytics, user behavior tracking, funnel analysis, retention insights, and customer engagement measurement. It’s ideal for digital product teams seeking granular user data.

    6. Heap

    Heap automatically captures every user interaction without manual event tagging, simplifying behavioral analytics and product optimization. This reduces setup time and provides richer GA4 data context.

    7. Hotjar

    Hotjar provides heatmaps, session recordings, and user feedback collection that complement GA4’s quantitative data. These behavioral insights help optimize website usability and conversion rates.

    8. Supermetrics

    Supermetrics automates marketing data aggregation from GA4 and dozens of other platforms. It streamlines reporting, dashboard creation, and cross-channel performance analysis, saving hours of manual work.

    9. Databox

    Databox consolidates analytics from GA4 and marketing tools into real-time dashboards. Its KPI monitoring and automated reporting support executive decision-making with actionable insights.

    These tools collectively enhance GA4’s native capabilities, enabling better data visualization, SEO, user behavior analysis, and automated reporting. Choosing the right combination depends on your specific business goals, but each platform offers unique strengths for 2026 analytics strategies.

  • Top 10 Business Intelligence Dashboard Tools for 2026: Power BI, Tableau, and More

    Top 10 Business Intelligence Dashboard Tools for 2026: Power BI, Tableau, and More

    Data is one of the most valuable assets for modern businesses, but its true worth lies in how effectively it is analyzed and presented. Dashboard tools enable companies to transform large datasets into visual insights, driving faster and smarter decisions. Whether tracking sales trends, monitoring operations, or analyzing financial performance, Business Intelligence (BI) platforms have become essential for organizations of all sizes.

    With the growing volume of data generated daily, dashboard applications have evolved from simple reporting tools into powerful decision-making engines. Here are the top 10 BI dashboard tools to consider in 2026.

    1. Microsoft Power BI

    Microsoft Power BI remains a top choice for businesses seeking a balance of cost efficiency, flexibility, and analytics. Its deep integration with Microsoft products like Excel, Azure, and Dynamics 365 makes it especially valuable for organizations already in the Microsoft ecosystem.

    2. Tableau

    Tableau is renowned for its robust data visualization capabilities. Users can create interactive dashboards without coding skills, making it a favorite among analysts and executives who need deep insights from complex data.

    3. Looker

    Looker, a Google Cloud platform, focuses on reliable reporting through a semantic layer that centralizes metric definitions. This eliminates inconsistencies and is ideal for organizations with cloud-based infrastructure.

    4. Qlik Sense

    Qlik Sense uses an associative engine to explore relationships between data points, allowing users to navigate data freely without being limited by predefined queries.

    5. ThoughtSpot

    ThoughtSpot is a pioneer in AI-driven analytics, enabling users to type business questions in plain language and receive instant answers through dashboards and reports.

    6. Sisense

    Sisense specializes in embedded analytics, helping organizations integrate dashboard functionality into their own applications and digital products, sharing insights with customers and employees seamlessly.

    7. Domo

    Domo is designed for real-time insights, pulling data from multiple sources into interactive dashboards that provide up-to-the-minute performance metrics via its cloud platform.

    8. SAP Analytics Cloud

    SAP Analytics Cloud combines BI, planning, and predictive analytics, particularly for companies already using SAP software. Its strong data integration capabilities keep everything aligned.

    9. IBM Cognos Analytics

    IBM Cognos Analytics remains a reliable choice for large-scale, multi-tenant reporting. It offers solid governance, automation, and consistent performance even under heavy workloads.

    10. Zoho Analytics

    Zoho Analytics has gained popularity among cost-conscious businesses for its affordability, AI-powered reporting, and rich integrations. Its user-friendly dashboards make it an excellent starting point for companies new to data analytics.

    Choosing the Right Dashboard Tool

    The best tool depends on company size, budget, and IT architecture. Power BI excels in versatility, Tableau leads in visualization, Looker integrates well with Google Cloud, and ThoughtSpot is ideal for AI-driven insights. Sisense is perfect for embedded analytics, while Zoho Analytics is a sensible choice for small businesses.

    BI dashboards have evolved far beyond simple charts. Today, they help predict future trends and enable quick, informed actions based on real-time data.