Tag: ETH price

  • Ethereum Price Outlook: Institutional Adoption Grows, but ETF Outflows Temper Breakout Hopes

    Ethereum Price Outlook: Institutional Adoption Grows, but ETF Outflows Temper Breakout Hopes

    Ethereum (ETH) is attempting to extend its recovery as institutional adoption, exchange-traded funds (ETFs), staking, and tokenization strengthen its market narrative. However, ETH’s ability to break higher increasingly depends on whether institutional infrastructure translates into sustained capital flows and on-chain activity.

    Current Price Action and Key Resistance

    ETH trades at USD 2,478.08 on September 18 after recovering from a sharp two-day pullback. Traders are watching roughly USD 2,570 as an important resistance area, with a sustained move above it potentially opening the way toward higher technical levels.

    ETF Flows Turn Volatile

    Institutional ETF demand strengthened during parts of 2026, but the latest data show that flows are not consistently positive. Ethereum ETFs attracted USD 1.75 billion in August, their strongest month since August 2025.

    Momentum has since reversed. US spot Ethereum ETFs recorded USD 39.24 million in net outflows on September 17, marking a third consecutive session of withdrawals. Combined outflows over those three trading days reached approximately USD 405.4 million, according to SoSoValue. The reversal shows why institutional interest alone cannot guarantee a sustained ETH rally.

    Ethereum Maintains Deep On-Chain Liquidity

    Ethereum retains a major structural advantage in decentralized finance (DeFi). According to DeFiLlama, USD 50.28 billion in Ethereum DeFi total value is locked. The ecosystem also supports about USD 172 billion in stablecoin value across mainnet and Layer 2 networks and approximately USD 21 billion in real-world assets. Ethereum’s Layer 2 ecosystem includes 102 live networks with around USD 37.5 billion in average daily TVL. These figures matter as institutional blockchain adoption increasingly involves stablecoin settlement, tokenized securities, and financial applications rather than cryptocurrency trading alone.

    Tokenization Gains Regulatory Momentum

    Institutional tokenization received another boost on September 17 when the US Securities and Exchange Commission (SEC) announced a five-year exemption framework for qualifying tokenized-stock trading platforms and liquidity providers. According to Reuters, eligible tokenized stocks must provide shareholders the same economic and governance rights as conventional shares, while synthetic tokens merely tracking stock prices are excluded. Ethereum is positioned to participate, as its institutional portal reports that 37% of on-chain real-world assets (RWAs) are deployed across Ethereum and its Layer 2 ecosystem.

    What Could Drive ETH Higher?

    A sustainable breakout would likely require several factors to align: renewed ETF inflows, resilient DeFi liquidity, increasing stablecoin and RWA activity, and supportive broader risk sentiment. Conversely, persistent ETF withdrawals or tighter financial conditions could limit upside even if institutional infrastructure continues expanding.

    Final Thoughts

    Ethereum’s institutional foundation is becoming broader, particularly across DeFi, stablecoins, and tokenization. However, recent ETF outflows show infrastructure growth and investment demand can diverge. ETH still needs sustained capital inflows and network usage to convert institutional interest into durable price momentum.


  • Ethereum Price Drops to $1,866 as Liquidations Mount and Key Support Level Nears

    Ethereum Price Drops to $1,866 as Liquidations Mount and Key Support Level Nears

    Ethereum traded near $1,866 during the latest session, falling 1.14% over 24 hours. The decline came as the wider crypto market lost about 1.15%. Bitcoin also fell, showing that traders reduced exposure across major digital assets. Ethereum-specific selling and leveraged liquidations added pressure during the same period.

    Why Ethereum Is Down Today

    The main pressure came from a broader risk-off move after two major central bank decisions. The Federal Reserve held rates at 3.50% to 3.75% on July 29. However, three policymakers supported a quarter-point increase. This split kept rate expectations uncertain and pushed traders toward defensive positions across risk assets.

    The Bank of Japan also held its policy rate at 1% on July 31. Its communication left room for further increases as inflation pressures continued.

    Meanwhile, Middle East tensions kept energy and inflation risks in focus. Bond yields rose during July as markets reduced expectations for easier monetary policy. Ethereum moved alongside Bitcoin during the decline. This price link points to macro conditions as the main driver, rather than one Ethereum network event.

    ETH Sale and USDT Enforcement Enter Focus

    Quantum Solutions disclosed that its subsidiary sold 1,000 ETH on July 30. The company received $1.903 million after transaction costs. The sale price stood at $1,903 per ETH. Quantum Solutions said it needed funds for its artificial intelligence infrastructure and data centre plans.

    The company held 4,764.80 ETH after the transaction. It also raised its permitted sale limit from 1,875 ETH to 4,375 ETH. That change leaves room for another 2,471 ETH in sales through October 30. However, the filing did not connect the transaction directly to Ethereum’s wider decline.

    Separately, US authorities continued civil forfeiture actions involving stablecoins linked to alleged investment scams. The Justice Department recently announced cryptocurrency seizures exceeding $25 million across five investigations.

    Court records also show that one related complaint sought the forfeiture of about 10.4 million USDT. Authorities linked the wider cases to alleged international fraud and money-laundering networks.

    Reported derivatives data showed $120.41 million in ETH liquidations. Long positions accounted for most of the closed trades. Forced closures can deepen short declines as exchanges sell positions after margin levels fail. They can also reduce open interest after an overcrowded trade.

    Ethereum Price Levels Traders Are Watching

    Ethereum now sits near a key technical area. The 50-day exponential moving average stands near $1,845 and offers the nearest support. A daily close above that level could keep ETH inside its recent range. Buyers would then face resistance around $1,879 and $1,920.

    A close below $1,845 would expose the $1,800 to $1,820 zone. Another support level sits near $1,839 within the short-term trading range. Momentum readings also show weak conditions. The relative strength index stood near 37.85, while ETH traded below its 50-day and 200-day averages.

    Spot Ethereum ETF inflows offer a counterweight to direct market sales. Continued inflows would show that regulated investment products still attract demand.

    Viktoras Karapetjanc said, “If spot inflows persist and ETH reclaims $1,879, buyers could quickly regain control in the coming sessions.” The next scheduled US employment report arrives on August 7. Its wage, hiring and unemployment figures could change expectations for Federal Reserve policy.

  • Ethereum’s Layer-2 TVL Plunges 90%: What It Means for ETH Price and Adoption

    Ethereum’s Layer-2 TVL Plunges 90%: What It Means for ETH Price and Adoption

    Ethereum Layer-2 Total Value Locked Crashes from $48B to $5B

    Ethereum’s Layer-2 ecosystem has experienced a dramatic decline in total value locked (TVL), dropping from a high of $48 billion earlier in 2026 to just around $5 billion, according to L2BEAT. This represents a staggering 90% decrease, adding fresh headwinds to an already volatile asset. Despite the rout, Optimism, Base, and Arbitrum remain the dominant players, collectively holding approximately $4.8 billion—or 96% of the remaining Layer-2 liquidity.

    Earlier this year, Arbitrum boasted $16.8 billion in TVL, Base nearly $10.7 billion, and Optimism around $8 billion. The combined total of these three networks exceeded $35 billion, making the current contraction all the more striking.

    Fragmentation and Capital Outflows Weigh on Activity

    Over 73 active Layer-2 rollups currently operate on Ethereum, but growing fragmentation continues to drain liquidity. While no major protocol has officially explained the traffic drop, analysts believe capital has shifted away from Layer-2 networks as users sought opportunities elsewhere or bridged assets back to Ethereum’s mainnet and competing blockchains.

    The debate intensified after the launch of Robinhood’s chain, which handled $4.5 billion in trading volume on decentralized exchanges in its first week and briefly outpaced Ethereum mainnet and Base on daily trading volume. However, during the same period, the chain generated only about $4,000 in fees, compared to Ethereum’s $7.4 billion, raising questions about the economic value Layer-2 networks return to the base chain.

    Institutional Competition Intensifies

    Major institutions like DTCC and JPMorgan are diversifying their tokenization initiatives across multiple public blockchains rather than relying solely on Ethereum. Meanwhile, the Ethereum Foundation has undergone several leadership changes this year, adding uncertainty about the network’s future direction. Despite these challenges, stablecoins maintain a significant presence in transactions across the Ethereum ecosystem, including its Layer-2 solutions.

    Technical Outlook: Key Support and Resistance Levels

    ETH is currently trading above a key support zone at $1,850–$1,900, near $1,920. Derivatives positioning remains subdued, reflecting limited conviction from both bulls and bears. Immediate resistance lies around $2,036–$2,050. A decisive move above this could target the 0.236 Fibonacci level near $2,134, with further milestones at $2,377 and $2,572. On the downside, $1,780 is critical support, followed by $1,742 if sellers regain control.

    Frequently Asked Questions

    Why has Ethereum’s Layer-2 TVL fallen so sharply?

    According to L2BEAT, Layer-2 TVL declined from about $48 billion to nearly $5 billion in 2026. Analysts attribute the drop to lower on-chain activity, capital outflows, and liquidity fragmentation across multiple rollup networks.

    Which Layer-2 networks still dominate Ethereum’s ecosystem?

    Optimism, Base, and Arbitrum remain the largest platforms, together accounting for about $4.8 billion or 96% of the remaining TVL in Ethereum’s Layer-2 ecosystem.

    What are the key price levels for Ethereum right now?

    ETH is holding above the important $1,850–$1,900 support zone. Immediate resistance is between $2,036 and $2,050, while a break below $1,780 could expose the next support near $1,742.

    Why are institutions exploring blockchains beyond Ethereum?

    Major institutions such as DTCC and JPMorgan are expanding tokenization initiatives across multiple public blockchains to reduce dependence on a single network and broaden infrastructure options.

    Does the decline in Layer-2 activity weaken Ethereum’s long-term outlook?

    A slowdown in Layer-2 adoption presents a near-term challenge, but Ethereum continues to benefit from strong stablecoin usage, an established developer ecosystem, and ongoing institutional interest, making its long-term outlook dependent on future network growth and adoption.

  • Ethereum’s $20K Target Revived as Lido Launches Major Validator Upgrade

    Ethereum’s $20K Target Revived as Lido Launches Major Validator Upgrade

    Ethereum traded above $1,900 as CrediBULL Crypto reiterated a $20,000-plus target and Lido began migrating more than 8 million staked ETH, worth about $16.5 billion, into a new validator structure. The analyst tied his forecast to long-term ETH/USD and ETH/BTC patterns, while Lido expects its upgrade to reduce Ethereum’s validator count and consensus-layer traffic.

    CrediBULL Maps a Route Toward $20,000

    CrediBULL first presented the target three weeks earlier, when ETH traded near $1,500. He later replied ‘$20K+’ to alphatracker’s call for Ethereum above $10,000. In a linked video, he called $10,000 the minimum level and described $20,000 as realistic, though not certain. The case starts with the ETH/BTC chart, which has declined for about four years. He said the pair has entered a long-term accumulation zone that could support a new base. He also pointed to a larger five-wave structure on the ETH/USD chart, noting Ethereum completed its first leg and remains above an invalidation level near $1,385.

    Under that framework, the next advance could carry ETH toward $10,000. A later wave could then lift the token beyond $20,000 if the stated support remains intact. CrediBULL compared the setup with April last year, when Ethereum traded near similar levels, faced widespread doubt, and later broke its previous record within months.

    Other traders remain divided. Saiyan set a $10,000 base case, while Cheds Trading rejected that outcome. Sykodelik said $10,000 would equal roughly twice Ethereum’s all-time high. ETH had gained nearly 4% in 24 hours and about 24% during the month, but still remained 60% below its record, according to CoinGecko figures.

    NoName cited four lower highs as evidence of a possible market floor. Ali Martinez identified a bullish MVRV ratio crossover. Meanwhile, Binance funding rates reached their highest level in six months. CryptoQuant analysts linked the rise to improving sentiment, although ETH remained below last year’s comparable price.

    Lido Starts Major Validator Consolidation

    Alongside the price debate, Lido started migrating more than 8 million staked ETH through its Curated Module v2 upgrade. CMv2 marks Lido’s largest core protocol change since Lido V2 launched in 2023. The system adopts Ethereum’s post-Pectra 0x02 validator format, which lets each validator secure up to 2,048 ETH. The previous effective balance limit stood at 32 ETH, requiring more validators for large staking balances.

    Lido expects consolidation to reduce Ethereum’s validator count from approximately 880,000 to about 628,000. The final total will depend on new validators joining during the transition. The protocol also estimates a 29% decline in consensus-layer attestation messages during each epoch, reducing network overhead without directly changing gas fees or transaction speeds. Lido plans to complete the migration gradually over several months, and stETH holders do not need to take any action.

    A Brief Roundup

    CrediBULL Crypto’s $20,000 outlook rests on long-term ETH/BTC accumulation and an ETH/USD wave structure above $1,385. Traders remain split, while improving funding and MVRV signals support the recovery case. Lido’s validator migration adds a separate network-efficiency development for Ethereum users to watch.

  • Ethereum Fees Plunge 51% as Transactions and Staking Reach All-Time Highs

    Ethereum Fees Plunge 51% as Transactions and Staking Reach All-Time Highs

    Ethereum’s quarterly fee revenue dropped 51% year-over-year to approximately $64 million in Q2 2026, even as transaction volumes and staking activity hit new records, according to a report from Bitwise. The decline stems from cheaper and more abundant blockspace rather than weakening demand.

    Revenue measured in ETH actually rose for the first time in over a year. Ethereum generated roughly $131 million in fee revenue during Q2 2025, but that figure fell to nearly $64 million one year later.

    Cheaper Blockspace Drives Higher Ethereum Usage

    Ethereum processed 203.9 million transactions during the quarter, up sharply from 121.1 million a year earlier. Network throughput also improved to 26 transactions per second from 15. The network increased its block gas limit to 60 million, creating more room for transactions and reducing user costs even as activity expanded.

    Bitwise described rising usage and falling fees as the quarter’s dominant trend. Researchers attributed the gap to protocol changes that expanded blockspace across blockchain networks. In ETH terms, quarterly revenue increased from 27,670 ETH in Q1 to 31,166 ETH in Q2, though the weaker token price reduced the dollar total.

    Active staking reached a record 40.2 million ETH, representing about 33% of the total supply. Institutional inflows continued as more tokens entered staking contracts. The question remains whether rising usage and record staking can offset weaker dollar revenue as Ethereum faces broader market pressure.

    The same pattern appeared on other networks. Solana processed 9.8 billion non-voting transactions near its record, while its dollar revenue declined. Avalanche handled 236 million C-Chain transactions, compared with 58 million a year earlier. Lower congestion reduced fees even as network use expanded.

    ETH Price Faces Oil, Rates, and Technology Pressure

    Ethereum traded near $1,927 on July 23 after reaching an intraday high of $1,941, according to crypto.news data. The token recovered more than 27% from its June low near $1,514. However, repeated failures near $1,955 kept ETH below the psychological $2,000 level.

    Oil prices added pressure as Middle East tensions pushed crude higher for a fifth session. West Texas Intermediate moved above $90 per barrel. Attacks by Iran-aligned Houthis on Saudi oil tankers raised supply concerns. Higher energy costs could lift inflation and narrow the Federal Reserve’s policy options.

    CME FedWatch data showed the probability of a September rate hike rising to 79% from 68%. Traders still expected no change at the July meeting. Technology shares also weakened after Alphabet lifted its 2026 capital-spending forecast to between $195 billion and $205 billion.

    Alphabet reported negative free cash flow of $5.9 billion as quarterly spending doubled to $44.9 billion. Its shares fell during premarket trading. Meanwhile, US spot Ethereum ETFs recorded $72.64 million in net inflows on July 22, according to SoSoValue.

    BlackRock’s iShares Ethereum Trust led with $53.47 million. The regulated products continued attracting capital while ETH remained below $2,000. BitMEX also announced plans to stop operations on September 23 following a strategic review by parent company HDR Global Trading.

    The exchange told customers to close positions and withdraw funds before the deadline. BitMEX has served more than two million professional and institutional traders since 2014. Position transfers could shift leverage to rival platforms. Binance, Bybit, OKX, and other exchanges still operate larger Ethereum derivatives markets.

    Ethereum fee revenue fell 51% even as transactions, throughput, and staking reached record levels. Cheaper blockspace reduced user costs, while ETF inflows supported demand. Still, oil prices, rate expectations, and weaker technology shares could continue influencing ETH’s attempt to reclaim $2,000.

  • Ethereum Price Surges Past $1,900 Resistance, Targets $2,100 Next

    Ethereum Price Surges Past $1,900 Resistance, Targets $2,100 Next

    Ethereum price moved above the $1,900 resistance level as stronger demand across crypto and stock markets supported risk assets. ETH reached an intraday high near $1,950, its strongest price in seven weeks.

    The rally pushed Ether about 29% above its June 26 low near $1,500. It also triggered roughly $62 million in liquidations from traders holding leveraged bearish positions. Still, ETH must clear several resistance levels before $2,100 becomes the next confirmed target.

    Ethereum Price Tests the $1,950 Resistance

    Ethereum price followed Bitcoin higher as BTC crossed $66,500 and the total crypto market gained value. A rebound in US technology shares also supported demand for ETH. The Nasdaq Composite rose 1.3%, while the S&P 500 gained 0.9%.

    ETH now faces its first major barrier between $1,945 and $1,953. Buyers tested this area twice but failed to secure a daily close above it. A confirmed break could expose the 100-day moving average near $1,981, followed by the psychological $2,000 level.

    Liquidation data also shows a large pool of leveraged positions between $1,950 and $1,960. Additional liquidity sits near $1,980 and $2,000. A move through these levels could force short sellers to close positions, adding more buying pressure.

    Ethereum trades inside an ascending channel that started near the late-June low of $1,514. The upper part of this structure points toward $2,080. This level sits close to the wider $2,100 target watched by traders.

    On the downside, traders monitor the $1,870 to $1,900 demand zone. Analyst Ted Pillows said, “If the $1,870–$1,900 level holds, Ethereum could soon rally above $2,000.” A break below $1,859 could expose $1,828, while a daily close above $1,953 would strengthen the path toward $2,000 and $2,100.

    Weak On-Chain Activity Limits ETH Demand

    Ethereum’s network data has not matched the recent price recovery. Weekly decentralized exchange volume dropped to about $7.2 billion, while decentralized application revenue fell to $9.8 million. This marked the lowest level since September 2024.

    Lower activity reflects weaker demand for memecoins and utility tokens on Ethereum. Several major ecosystem tokens, including Ethena, Mantle and Arbitrum, have also recorded losses of at least 50% this year.

    Derivatives traders also show caution. ETH perpetual futures funding rates have struggled to hold inside the neutral annual range of 6% to 12%. Rates have improved since turning negative in late June, but traders have not built large bullish positions.

    Staking and ETF Flows Support the Recovery

    Ethereum staking reached a record 34% of the total ETH supply, according to Staking Rewards. The rate stood near 33% one month earlier. Higher staking reduces the amount of Ether available for immediate sale on exchanges.

    Institutional accumulation has also continued. Bitmine Immersion added 156,719 ETH during the past month and now controls around 4.8% of the available supply. US spot Ethereum exchange-traded funds recorded $37.47 million in net inflows during the latest session.

    BlackRock’s ETHA fund attracted $52.7 million, although withdrawals from Fidelity’s FETH reduced the total. These inflows provide another source of demand as Ethereum attempts to recover from a six-month decline.

    ETH has also gained strength against Bitcoin. Analysts noted that ETH/BTC reclaimed its weekly bull market support band and moved above a long-term descending trendline. A sustained move above 0.03 BTC could open the 0.032 to 0.035 BTC range. However, Daan Crypto Trades cautioned that “BTC will have to lead the market,” showing that Ethereum’s recovery still depends partly on Bitcoin holding its recent gains.

  • Ethereum at Critical Crossroads: Key Support Level Holds the Key to Next Move

    Ethereum at Critical Crossroads: Key Support Level Holds the Key to Next Move

    Ethereum has reached a pivotal moment after a strong upward move, with traders and investors closely watching a key support zone between $1,700 and $1,720. The next few days could determine whether the second-largest cryptocurrency resumes its rally or enters a short-term correction.

    Key Support Zone Under Scrutiny

    The $1,700 to $1,720 area has become the most important support level for Ethereum. Buyers have previously stepped in at this zone, helping the price recover. If Ethereum holds above this support, it could boost buyer confidence and pave the way for further gains. However, a break below this level could shift market sentiment quickly, potentially driving the price down to the next support range of $1,550 to $1,600.

    Resistance at $1,800 Remains the Next Hurdle

    While support holds firm, Ethereum faces strong resistance near $1,800. This level has repeatedly attracted sellers. A daily close above $1,800 with robust volume would be a bullish signal, potentially opening the door to the $1,900 to $2,000 range.

    RSI Signals Strong Momentum

    The Relative Strength Index (RSI) stands at 67.73, indicating that buyers remain in control. However, the RSI is approaching the overbought threshold of 70, which may prompt caution among traders after the recent rally.

    ETF Inflows and Institutional Demand Bolster Outlook

    Spot Ethereum ETFs have seen steady inflows, boosting market confidence. Institutional investors, including firms like Bitmine, have increased their ETH holdings, signaling long-term bullish sentiment. These factors provide a solid foundation for Ethereum’s price.

    Global Economic Factors and Leverage Risks

    Global economic events, particularly US Federal Reserve interest rate decisions, continue to influence cryptocurrency markets. Lower rates tend to support risk assets like Ethereum. Additionally, the futures market shows many leveraged long positions, which could amplify volatility if the price drops below key support.

    What’s Next for Ethereum?

    Ethereum’s immediate future hinges on holding the $1,700-$1,720 support. A successful hold keeps the bullish outlook intact, with the next target at $1,800. A break above $1,800 could lead to a rally toward $1,900 and $2,000. Conversely, a breakdown below support could trigger selling pressure and a drop to $1,550-$1,600. The RSI, ETF demand, and institutional buying will all play key roles in determining Ethereum’s next move.

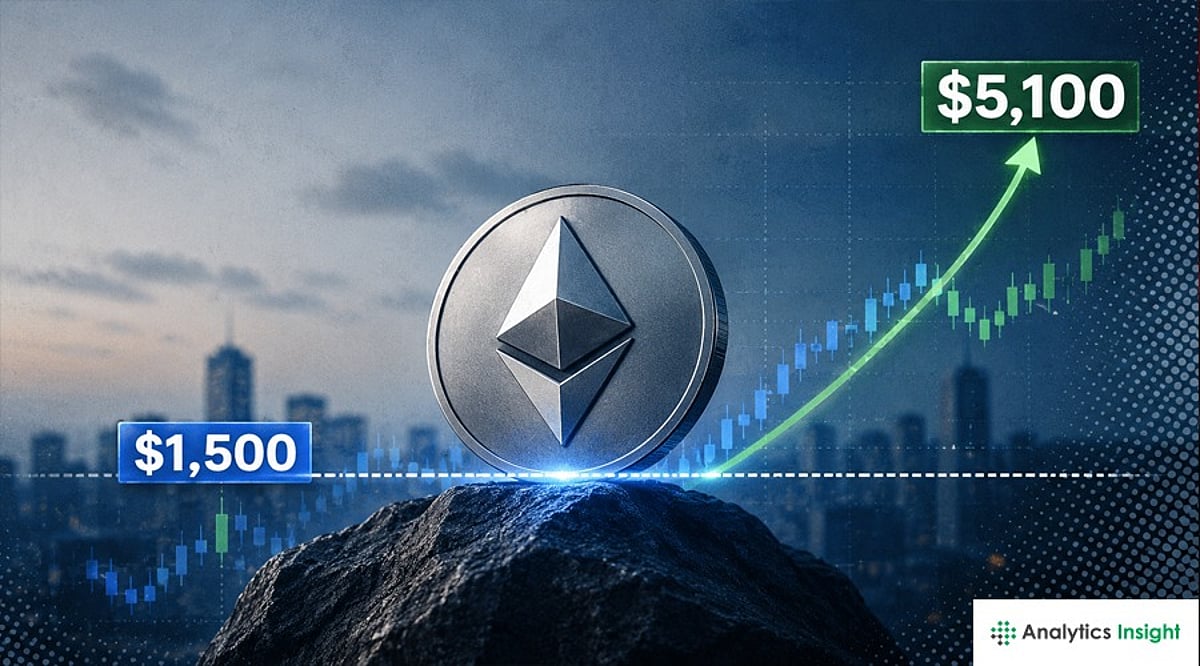
  • Ethereum Holds Key $1,500 Support; $5,100 Breakout Target Remains in Focus

    Ethereum Holds Key $1,500 Support; $5,100 Breakout Target Remains in Focus

    Ethereum traded near a critical support zone on June 24 as ETF outflows, weak momentum, and a break below the 200-day simple moving average kept pressure on the asset. The token stood at about $1,670, below $1,700 and near a level that has shaped its wider recovery since 2022.

    Key Support Defines the Near-Term Setup

    Ethereum has repeatedly bounced from the $1,500 to $1,650 area since the 2022 bear-market bottom. The zone protected every major low during the past several years. It also notes that Ethereum reached about $1,618 on the weekly chart. Earlier rebounds from this area came in 2023, late 2023, and 2025.

    According to analyst Ardi, weekly closes below $1,500 would mark a clear structural breakdown. He said that holding above that level would keep the broader support pattern intact.

    Chart Traders Compare ETH With the Russell 2000

    A separate chart view compares Ethereum with the Russell 2000. Both assets formed rounded bases after major declines, then recovered toward long-standing resistance. The Russell 2000 has already moved above its horizontal resistance near 2,500. That breakout strengthened its broader bullish structure.

    Ethereum has not matched that move. It still trades below a resistance band ranging from $4,300 to $5,100 and remains within a short-term descending channel. James Easton said the Russell 2000 pattern could offer a roadmap for Ethereum.

    If ETH breaks above the falling channel, traders would first watch the previous all-time-high region. A confirmed move above roughly $5,100 could place Ethereum in price discovery.

    The data also points to a speculative long-term path toward five-figure levels, including prices above $10,000. Even so, the outcome remains unconfirmed.

    ETF Outflows Add Pressure on Price

    Ethereum’s weakness also comes from continued ETF outflows. On June 23, Ethereum ETFs recorded $82 million in net outflows, their fourth straight day of withdrawals. Market caution has grown amid uncertainty tied to Iran and the outlook for U.S. interest rates. ETH also fell below its 200-day simple moving average, which signals short-term weakness.

    Analysts say some bulls want to see ETH break above $1,800 before momentum returns. Others point to the broader support near $1,500 as the key line to defend.

    The asset traded at an all-time high of $4,953.73 on August 24 of last year. For now, the market continues to watch whether Ethereum can reclaim nearby resistance around $1,900 to $2,000.

    What’s Next?

    Ethereum remains under pressure as ETF outflows persist and the price trades below key resistance levels. At the same time, the $1,500 support zone continues to hold, preserving the broader recovery structure. Traders now focus on whether ETH can defend support and regain momentum above $1,800 while keeping longer-term targets in view.