
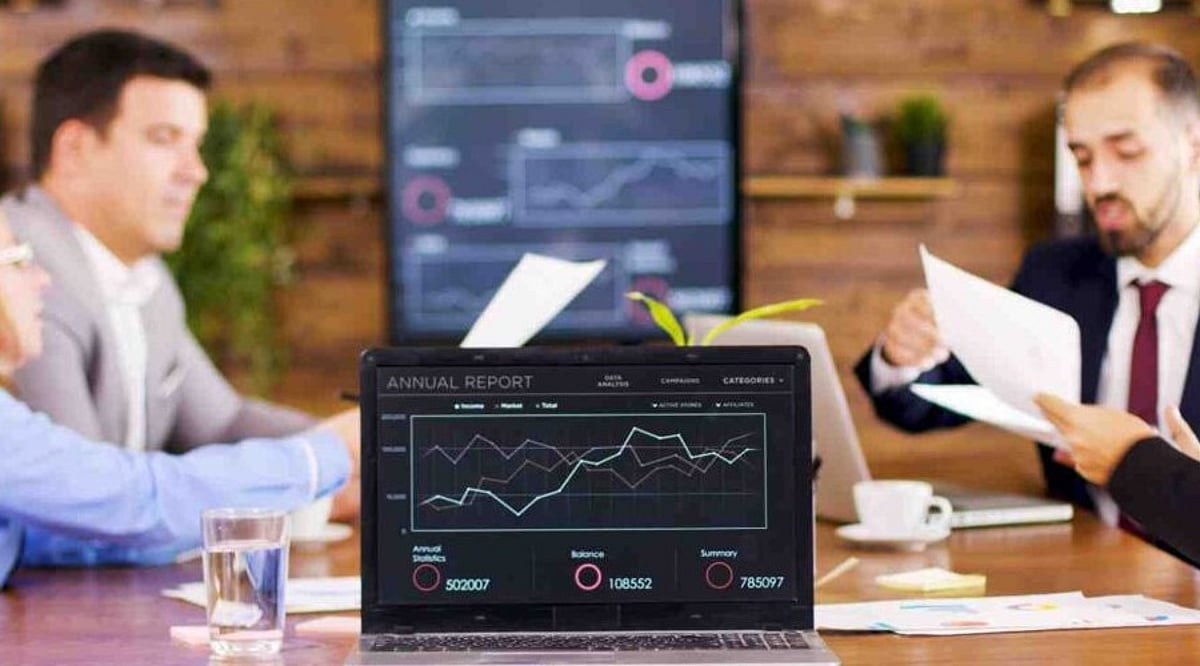
Time series analysis helps businesses understand how data evolves over time. By examining trends, seasonal patterns, and other changes, analysts uncover useful insights and make more accurate forecasts.
Overview
- Time series analysis studies data collected over a period of time.
- Trends, seasonality, cycles, and random changes are the main components of time series data.
- Methods such as moving averages, exponential smoothing, and ARIMA help analysts examine past data.
- Time series analysis is used in sales, finance, healthcare, weather, energy, and technology.
Time series analysis goes beyond turning old numbers into charts. These methods help various sectors understand the changes they have experienced over a specific period. Businesses can study pattern shifts, identify causes, and take appropriate action. In simple terms, time series analysis involves studying data collected over time. The data can be recorded every minute, hour, day, week, month, or year. Analysts look for patterns to understand what has happened and, in some cases, estimate what might happen next. However, it’s important to note that a forecast is never a guarantee. A sudden event can alter demand, prices, traffic, or customer behavior. Good analysis must account for uncertainty and continuously check new data. The goal is not merely to predict the next number but to understand the movement behind the numbers. When used properly, time series analysis can transform years of data into actionable information for today’s decisions and tomorrow’s plans. For businesses, this aids planning. For example, a retailer can study historical sales data before deciding how much stock to order. Similarly, a streaming service can analyze viewing data to understand audience habits before a major show release. The principle is simple: the past cannot tell us everything about the future, but it can offer valuable insight.
Understanding the Main Parts of Time Series Data
A time series can contain several types of movement. Knowing each one makes the data easier to interpret. The first is trend. A trend shows the general direction of data over a longer period. For instance, a smartphone company may see monthly sales fluctuate, but when looking at five years of data, it may observe steady growth. Short-term changes matter, but the larger trend provides a better view of growth. The second is seasonality. This refers to patterns that repeat at fixed times. For example, during festive seasons, online stores often experience order surges, and travel companies see booking increases during holidays. Ice cream sales rise during summer months. These patterns repeat annually as seasons arrive. Cycles are another component. They can resemble seasonal patterns but do not follow a fixed schedule. Economic booms and recessions are common examples. Demand may rise during strong economic periods and fall during slowdowns. Finally, random changes occur. Not every data movement has a clear reason. A sudden news event, supply issue, product launch, or natural disaster can cause unexpected shifts.
Common Time Series Methods and Real-Life Applications
Once data is prepared, analysts choose a method based on their analysis goals. One simplest method is the moving average. It calculates the average of a fixed number of recent values and moves forward as new data arrives. For example, a retailer might use a seven-day moving average to study daily sales. An unusually busy Saturday may spike sales, but the moving average smooths out these daily jumps, making the wider trend clearer. Another useful method is exponential smoothing, which assigns greater weight to recent data while still incorporating older numbers. Recent changes thus have a stronger impact on the result. A retailer could use this to estimate product demand: if phone sales have increased in recent weeks, those recent numbers influence the forecast more. More advanced methods include ARIMA, which uses past values and past changes in data to make forecasts. It is applied in areas such as sales, economic data, and demand planning. Machine learning has also become part of modern forecasting. AI models handle large datasets and consider multiple factors simultaneously. Some businesses use these tools to forecast demand, website traffic, energy usage, and customer activity. Time series analysis is widely applicable in real-life scenarios. In finance, it helps understand stock prices, interest rates, and trading activities. Analysts identify patterns from past data, though unpredictable events can alter outcomes. In healthcare, time series analysis helps hospitals study patient numbers over time. If cases rise continuously, hospital authorities can plan staffing accordingly. In the energy sector, electricity companies use these methods to track power consumption across hours and seasons, preparing for periods of high demand.
Frequently Asked Questions
What is time series analysis?
Time series analysis is the study of data collected over time. It helps identify trends, repeated patterns, and changes in data.
What are the main parts of time series data?
The main parts are trend, seasonality, cycles, and random changes. Together, they explain how data moves over time.
What is time series forecasting?
Time series forecasting uses past data to estimate future outcomes. Businesses use it for sales, demand, traffic, and other areas.
Where is time series analysis used?
It is used in finance, healthcare, retail, energy, weather forecasting, technology, and many other fields.
What are common time series analysis methods?
Common methods include moving averages, exponential smoothing, and ARIMA. Machine learning is also used for more complex forecasting tasks.