Tag: foreign exchange

  • Global Gold Reserves: Top 7 Countries Holding the Most Bullion

    Global Gold Reserves: Top 7 Countries Holding the Most Bullion

    Global Gold Reserves: Top 7 Countries Holding the Most Bullion

    Central banks around the world hold gold as a cornerstone of their foreign exchange reserves, providing stability and confidence in times of economic uncertainty. This article ranks the top seven countries by their official gold holdings, highlighting the sheer scale of these reserves and their significance in each nation’s financial strategy.

    1. United States – 8,133.5 Tonnes

    The United States holds the largest official gold stock in the world, with approximately 8,133.5 tonnes. This accounts for a staggering 81.4% of its foreign exchange reserves. Gold has been a long-term reserve asset for the U.S., reflecting its historical role as a pillar of the global financial system.

    2. Germany – 3,350.3 Tonnes

    Germany holds about 3,350.3 tonnes of gold, representing 81.0% of its foreign exchange reserves. The Bundesbank’s substantial gold holdings underline the country’s commitment to maintaining a robust and diversified reserve portfolio, making it one of the largest official gold holders globally.

    3. Italy – 2,451.8 Tonnes

    Italy ranks third with roughly 2,451.8 tonnes of gold, which constitutes 77.0% of its foreign exchange reserves. The Bank of Italy’s gold reserves are among the largest in the world, underscoring gold’s enduring importance as a monetary asset in the country’s financial framework.

    4. France – 2,437.0 Tonnes

    France holds approximately 2,437 tonnes of gold, making up 78.5% of its foreign exchange reserves. The Banque de France’s gold stock is a key component of the nation’s reserve assets, reflecting a long-standing tradition of gold accumulation among major European central banks.

    5. China – 2,366 Tonnes

    China’s official gold holdings stand at about 2,366 tonnes, but this represents only 8.0% of its massive foreign exchange reserves. This highlights the contrast between total gold tonnage and its proportion within the reserve mix, as China’s overall reserves are vast, with gold playing a relatively smaller but still significant role.

    6. Russia – 2,277 Tonnes

    Russia holds around 2,277 tonnes of gold, which accounts for 41.4% of its foreign exchange reserves. This relatively high share indicates gold’s strategic importance in Russia’s economic policy, especially as the country has steadily increased its gold purchases over the past decade.

    7. India – 880 Tonnes

    India rounds out the list with approximately 880 tonnes of gold, representing 16.8% of its foreign exchange reserves. The Reserve Bank of India’s gold holdings form a vital part of the country’s reserve assets, complementing its foreign currency and other reserve components, and reflecting gold’s cultural and economic significance in India.

    These figures underscore the enduring role of gold as a safe-haven asset and a key component of national financial security. As global economic conditions evolve, central banks are likely to continue relying on gold to diversify their reserves and mitigate risks.
  • Indian Rupee Slips to 94.95 as Brent Crude Approaches $100 Amid US-Iran Tensions

    Indian Rupee Slips to 94.95 as Brent Crude Approaches $100 Amid US-Iran Tensions

    The Indian rupee fell 21 paise to 94.95 against the US dollar on Wednesday, September 9, 2026. Rising crude prices and escalating US-Iran tensions pressured the rupee during early trading in Mumbai.

    The currency opened at 94.80 before touching 94.95 in the interbank foreign exchange market. Tuesday’s session ended at 94.74, marking an 18-paise decline against the American currency.

    Brent crude climbed 1.41% to USD 99.30 per barrel as tensions raised supply disruption concerns. The Strait of Hormuz remains a major concern for markets tracking global oil supply routes. Anuj Choudhary, research analyst at Mirae Asset Sharekhan, highlighted the pressure on crude prices. “Indian rupee opened lower on escalating geopolitical tensions and surge in crude oil prices,” Choudhary said.

    The analyst expects USD-INR to remain under pressure while crude prices continue moving higher. He expects the USD-INR spot rate to trade between Rs. 94.70 and Rs. 95.15. A weaker dollar could provide some relief if global risk sentiment remains fragile.

    The dollar index slipped 0.03% to 98.76, offering limited support for the rupee.

    Indian equities also opened sharply lower as investors reacted to rising oil and geopolitical risks. The Sensex dropped 500.25 points, while the Nifty declined 129.40 points during early trading. Higher crude prices could increase India’s import bill and intensify inflation concerns. Investors now await inflation data from India and the US for fresh monetary policy signals. Persistent oil pressure could keep the rupee, equities, and broader markets volatile in coming sessions.

  • Indian Rupee Slides 10 Paise to 94.66 Against US Dollar as Crude Oil Prices Surge

    Indian Rupee Slides 10 Paise to 94.66 Against US Dollar as Crude Oil Prices Surge

    The Indian rupee came under pressure in early trade on September 8, falling 10 paise to Rs 94.66 against the US dollar as rising crude oil prices and escalating tensions in the Middle East weighed on investor sentiment. The currency opened at Rs 94.49 at the interbank foreign exchange market before weakening to Rs 94.66.

    This decline follows a 13-paise fall on September 7, when the rupee closed at Rs 94.56 against the dollar.

    Crude Prices Add Pressure

    The latest drop in the rupee came as Brent crude prices climbed towards USD 98 per barrel. Brent futures rose 0.63% to around USD 97.61, driven by concerns over possible disruptions to oil supplies amid escalating US-Iran tensions. Typically, rising oil prices negatively affect the rupee due to India’s heavy reliance on imported oil, as any increase in the country’s import bill leads to higher dollar requirements.

    These developments have raised concerns regarding the transport of energy through the Strait of Hormuz, a critical route for oil shipments. According to Reuters, Brent crude was at about USD 97.49 per barrel on Tuesday.

    Markets Await Key Economic Cues

    Market participants are now watching upcoming inflation data from India and the US for clues about the direction of interest rates and currency markets. The US Federal Reserve’s September 16 policy meeting will also remain a key focus.

    The dollar index stood around 98.80, while analysts expect the rupee to remain range-bound if crude prices stay elevated but RBI support continues.

  • Why Foreign Exchange Costs Are Invisible to Finance Teams—and How to Uncover Them

    Why Foreign Exchange Costs Are Invisible to Finance Teams—and How to Uncover Them

    Modern finance teams are drowning in analytics. Revenue dashboards update in real time, marketing spend is attributed down to the click, and procurement can tell you the unit cost trend of every input going back five years. Data-driven decision making has conquered almost every corner of the business.

    Almost. There is one line of spend that routinely escapes this scrutiny, despite touching every international transaction a company makes: the cost of exchanging and moving currency. For businesses with meaningful cross-border activity, foreign exchange is often one of the larger unexamined expenses on the books. It escapes analysis not because it is small, but because it is invisible by design.

    Why FX Costs Evade Normal Analysis

    Most costs announce themselves. A software subscription generates an invoice. A salary appears on the payroll run. FX costs do neither. They arrive embedded inside exchange rates, deducted before money ever lands, and split across intermediaries that never appear in the company’s records.

    Consider what happens when a business receives a $100,000 payment from a US customer into a euro account. The bank converts it at its own rate, which might sit 1.5% away from the mid-market rate. Nothing on the statement says “fee: $1,500.” The statement simply shows a euro amount, and unless someone checks that amount against the interbank rate at the moment of conversion, the cost never becomes a data point at all.

    Multiply that across every incoming payment, every supplier settlement, every intercompany transfer, and a mid-sized international business can easily be spending six figures a year on currency conversion without a single line item recording it. From an analytics perspective, this is the worst kind of cost: material, recurring, and generating no data exhaust.

    Treating FX as a Data Problem

    The fix is to treat currency costs the way an analyst would treat any other opaque process: instrument it, baseline it, then look for the variance. That is essentially what running an FX audit involves. The methodology is straightforward enough that most finance teams can execute a first pass internally, and the dataset it produces tends to justify the effort within the first afternoon.

    The core procedure has three steps:

    1. Reconstruct the transaction log. Pull every foreign currency transaction from the past six to twelve months: incoming payments, outgoing payments, and conversions between accounts. For each one, record the date, time where available, currency pair, amount sent and amount received.
    2. Benchmark against mid-market. For each transaction, look up the interbank mid-market rate at the time of execution. Historical rate data at daily granularity is freely available and sufficient for a first analysis. The difference between the rate received and the mid-market rate, expressed as a percentage, is the effective spread paid on that transaction.
    3. Aggregate and segment. Sum the spreads into a total annual cost, then segment the way you would any other dataset: by provider, by currency pair, by transaction size, by month. This is where the findings get interesting.

    What the Data Typically Reveals

    Companies that run this analysis for the first time tend to find the same patterns—consistent, quantifiable, and actionable.

    • Effective spreads are far higher than anyone assumed. Businesses that believed they were paying “around half a percent” routinely discover blended costs of 1.5% to 3% once every embedded margin is counted.
    • Inconsistency. The same provider often applies visibly different spreads to different transactions, with smaller payments and less common currency pairs carrying the widest margins. Plotting spread against transaction size usually produces an unmistakable downward curve, which is useful evidence when renegotiating terms.
    • Concentration. A handful of currency corridors typically account for the large majority of total cost. That matters because it means the problem is tractable. Fixing pricing on two or three pairs captures most of the available saving.
    • Unnecessary conversions. Money converted into the home currency and then converted back out again weeks later to pay suppliers in the original currency—with the business paying a spread in both directions for a round trip that served no purpose.

    From One-Off Audit to Ongoing Metric

    A single audit produces a snapshot and usually a round of savings. The larger opportunity is turning the exercise into a permanent metric, because currency costs have a habit of drifting back upward when nobody is watching.

    The instrumentation is minimal. Log every conversion with its received rate and the concurrent mid-market rate, and compute the spread automatically. Feed it into whatever dashboard the finance team already uses. From there, effective FX cost becomes a KPI like any other: tracked monthly, reviewed quarterly, and flagged when it moves outside an agreed band.

    Some teams go further and set a formal cost budget for FX, in the same way they budget cloud spend, then hold providers to it. Once the number is visible, that conversation becomes straightforward. Providers quote sharper rates to customers who demonstrably measure them.

    The Broader Lesson

    There is nothing exotic about any of this. It is the standard analytics playbook, applied to a cost category that has historically escaped it: capture the data, establish a benchmark, segment the variance, operationalize the metric. The only unusual feature of FX costs is how long they have managed to avoid the treatment.

    For data-literate finance teams, that is less a problem than an opportunity. The tooling already exists, the data is recoverable from existing statements, and the savings—unlike most analytics projects—drop straight to the bottom line.

  • India’s Forex Reserves Rise to $675.16 Billion After Weekly Gain

    India’s Forex Reserves Rise to $675.16 Billion After Weekly Gain

    India’s foreign exchange reserves increased for the second consecutive week, rising by $964 million to reach $675.16 billion for the week ending July 10, according to data released by the Reserve Bank of India (RBI). This follows a much larger jump of $7.26 billion in the previous week, signaling a recovery in the country’s external financial position.

    The primary driver of the increase was foreign currency assets, which grew by $930 million to $546.51 billion during the reporting period. These assets, which include major global currencies such as the euro, pound sterling, and Japanese yen, fluctuate in value against the US dollar. Additionally, gold reserves rose by $24 million to $105.23 billion, while Special Drawing Rights (SDRs) with the International Monetary Fund (IMF) increased by $3 million to $18.626 billion. India’s reserve position with the IMF also edged up by $7 million to $4.793 billion.

    The back-to-back weekly gains come after several weeks of decline, which had been driven by RBI’s intervention in the foreign exchange market to stabilize the rupee amid geopolitical tensions in the Middle East. Earlier this year, India’s forex reserves hit a record high of $728.494 billion in late February, but subsequent volatility led to sell-offs by the central bank to curb sharp currency fluctuations.

    The RBI has reiterated that it does not target a specific exchange rate for the rupee but will continue to monitor market conditions and act as needed to ensure stability. Strong forex reserves are crucial for the country to manage import payments, meet external financial obligations, and navigate global economic uncertainties. Although reserves remain below the peak, the latest increase underscores an improving external financial landscape.

  • South Korea and Japan Intensify Currency Stability Talks Amid Regional FX Volatility

    South Korea and Japan Intensify Currency Stability Talks Amid Regional FX Volatility

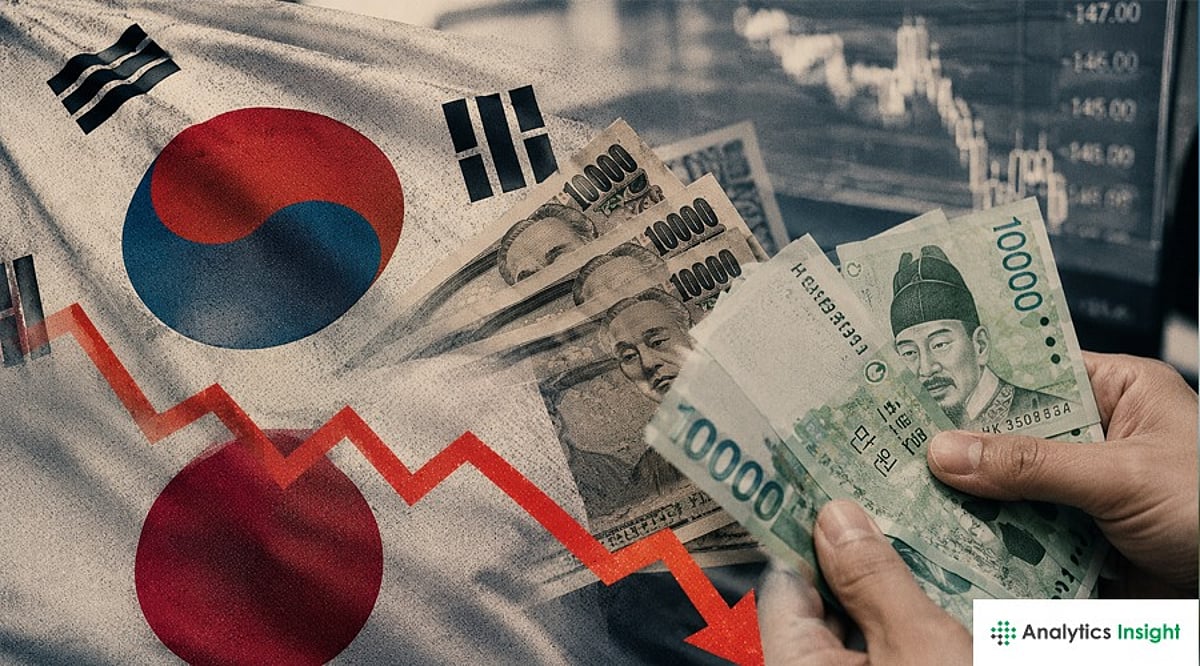
    South Korea is strengthening exchange rate discussions with Japan and allied nations as officials monitor currency volatility and regional financial stability. Markets are now awaiting clearer signals on whether these communications could advance toward coordinated policy action.

    According to Odaily, South Korea’s deputy finance minister confirmed that Seoul is maintaining close communication with Japan and other allied countries over exchange rate issues. The official identified foreign exchange coordination as an active policy priority but announced no intervention, formal agreement, or completed joint action.

    Seoul and Tokyo Keep Currency Channels Open

    The statement described an ongoing exchange of views among finance officials. Seoul did not name the other allied countries or disclose the scope, timing, or content of the talks. South Korea and Japan rank as Asia’s second- and third-largest economies by gross domestic product. Currency swings in either market can affect regional trade, investment flows, and financial conditions.

    Finance ministries often separate communication from direct intervention. Officials may discuss market conditions without buying or selling currencies, and the latest remarks remain within that communication stage. Even so, traders monitor each change in official language. Markets often interpret a move from ‘monitoring’ to ‘communicating’ as evidence that authorities have increased their attention.

    Markets Track the Won, Yen, and Official Language

    Exchange rate concerns usually involve currency strength, weakness, or rapid volatility. Those movements can affect export competitiveness, import costs, capital flows, and broader financial stability. South Korea has historically monitored sharp moves in the won. Japan also has a record of verbal warnings and direct intervention when authorities view yen movements as excessive.

    Any move from discussion toward preparation would mark a clear change in policy messaging. Traders will therefore watch the Korean won and Japanese yen against the United States dollar. Unusual price moves could show that markets expect a greater chance of official action. Further statements from Japan’s Ministry of Finance may provide more detail. Remarks from the unnamed allied countries could also show whether the discussions remain bilateral or involve a wider group.

    Crypto Relevance Depends on Wider Risk Sentiment

    The deputy finance minister did not mention Bitcoin, cryptocurrencies, or digital assets. The statement therefore carries no direct policy link to crypto markets or domestic crypto regulation. However, foreign exchange conditions can still shape risk appetite across markets. A stronger dollar environment has historically pressured Bitcoin and other cryptocurrencies as traders reduce exposure to risk assets.

    South Korea remains one of the world’s most active retail crypto trading markets. Policy signals from Seoul can influence domestic sentiment, even when officials address traditional currencies rather than digital assets. Recent developments also show growing links between financial policy and crypto. A South Korean crypto tax petition surpassed 58,000 signatures and moved to legislative review. The country’s New Start Fund also added crypto assets to its debt relief review. Those measures remain separate from the latest exchange rate discussions.

    Officials disclosed no outcome from the talks. Markets will next examine currency movements, new government statements, and any clarification about the allied countries involved.

    What’s Next?

    South Korea’s exchange rate talks with Japan and allied nations reflect growing attention to currency volatility and regional financial stability. Although officials announced no intervention, traders should monitor the Korean won, Japanese yen, and future policy statements for signs of stronger coordination or possible action.