Tag: Futures

  • Bitcoin Drops to $83,000 as Oil Price Rally Triggers Widespread Crypto Selloff

    Bitcoin Drops to $83,000 as Oil Price Rally Triggers Widespread Crypto Selloff

    Bitcoin fell to $83,000 on Monday as a surge in oil prices above $100 per barrel triggered losses across both cryptocurrency and traditional financial markets. The leading cryptocurrency dropped 1.7% since midnight UTC and 2.1% over the past 24 hours, while altcoins suffered even deeper declines.

    Oil Rally Pressures Risk Assets

    The market downturn followed a continued rise in crude oil prices, with Brent crude returning above $100 to trade at $100.83, a 3.2% gain during the session. The move came after President Donald Trump rejected Iran’s latest terms for reopening the Strait of Hormuz, which included demands for access to frozen funds, relief from oil sanctions, and an end to the US naval blockade of Iranian ports.

    Traditional markets also weakened. Gold fell 3.3% to $4,144, silver dropped 5.1% to $61.00, while S&P 500 futures lost 0.44% and NASDAQ 100 futures declined 0.95%. The US dollar index edged up 0.06% to 101.09, indicating broad selling pressure across multiple asset classes rather than an isolated crypto decline.

    Altcoins Hit Harder

    The CoinDesk 100 index fell 2.6% to 1,874.56, with 91 of its 100 constituents trading lower. Total crypto trading volume surged 70% to $172 billion over 24 hours, yet market-wide futures open interest dropped 3% to $150 billion, suggesting traders closed positions even as activity accelerated.

    Altcoins recorded sharper losses. QNT dropped 16% since midnight after a 39% gain during Friday’s session. GRT fell 12%, and ONDO also declined 12%. The DeFi Select Index lost 6.4% during the session and 7.3% over 24 hours, while the CoinDesk Computing Index fell 3.2% and 5.0% over the same period.

    Bitcoin Futures Show Traders Reducing Leverage

    Bitcoin futures open interest declined to 650,000 BTC, its lowest level since March. Funding rates turned negative across major exchanges, indicating that remaining leveraged positions leaned bearish. As of September 22, leveraged funds increased their net Bitcoin futures short position by 1,599 contracts to a total of 7,953 contracts, while asset managers added 411 contracts to raise their net long position to 3,171 contracts.

    The broader derivatives market later showed leverage declining further. The 24-hour taker long-short split stood at 46.9% against 53.1% as of 09:50 UTC, giving aggressive sellers a modest advantage. Ether saw a similar decline in leveraged exposure, with ETH futures open interest falling to 12.85 million ETH from 13.95 million on July 1.

    XRP and HBAR Break from Broader Trend

    XRP futures open interest moved differently, reaching a four-week high of 2.46 billion XRP early in the session before easing to 2.37 billion. Whale positioning varied: Binance whales remained bullish on Bitcoin, though weaker than Friday, turned bearish on Ether, and remained bullish on Solana. XRP positioning returned to bearish territory but less so than Friday.

    HBAR recorded an even stronger increase in derivatives activity, with open interest surging to a record 2.30 billion HBAR while its spot price climbed 48% over 24 hours. However, its 24-hour open-interest-adjusted cumulative volume delta remained negative, and annualized funding stayed only slightly above zero, indicating aggressive buying did not dominate.

    Options Market Shows Mixed Sentiment

    On Deribit, the $84,000 Bitcoin put expiring September 30 became the most traded Bitcoin options contract over 24 hours, while the $2,850 Ether call expiring October 20 led ETH options activity. Bitcoin implied volatility increased slightly as Volmex’s BVIV rose to 37.4% after rebounding from below 36% last week. Wall Street’s VIX rose to 16 on Friday from below 14, reflecting broader market uncertainty.

    Separately, Pluang data showed only nine of 50 major cryptocurrencies rising as 40 declined. Harmony led the gainers with a 30.54% rise, while GRT gained 17.15% and BAL advanced 11.14%.

    Bitcoin’s decline to $83,000 came as oil returned above $100 and selling spread across cryptocurrencies and traditional assets. Futures data showed lower leverage, negative funding, and bearish taker activity, while XRP and HBAR recorded stronger open interest. Options activity showed demand for both downside protection and selective upside exposure.
  • Stock Futures Hold Near Flat Ahead of Trump-Xi Summit and Iran Negotiations

    Stock Futures Hold Near Flat Ahead of Trump-Xi Summit and Iran Negotiations

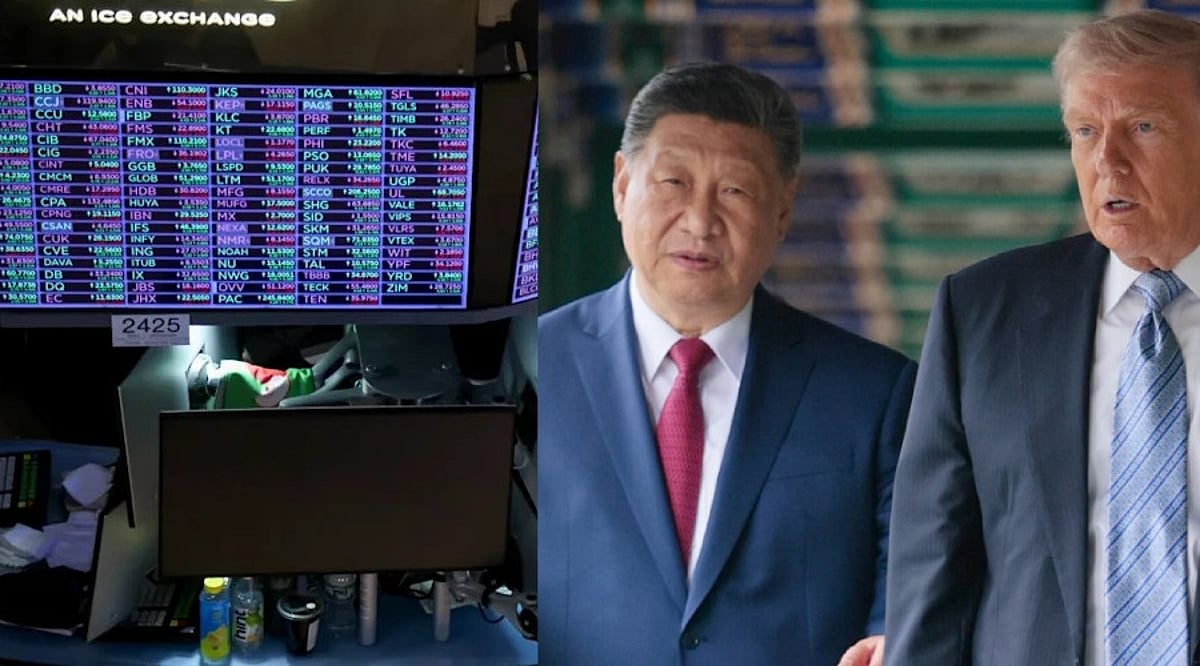
    U.S. stock futures were little changed early Wednesday, September 23, following a record close for the Nasdaq Composite. Investors kept their focus on oil price movements, ongoing U.S.-Iran discussions, and the anticipated meeting between President Donald Trump and Chinese President Xi Jinping.

    Futures Show Modest Declines

    At 7:50 a.m. ET, Dow futures slipped 31 points, or 0.31%, while S&P 500 futures gave back 0.13% and Nasdaq-100 futures fell 0.33%. All three contracts remained close to Tuesday’s closing levels as markets awaited fresh catalysts from geopolitics and economic data.

    The flat open followed a mixed session on Wall Street. The Nasdaq Composite rose 0.45% to 27,244.28 for its second consecutive record close, while the S&P 500 finished essentially unchanged at 7,764.64. The Dow Jones Industrial Average dropped 0.36% to 51,863.69. Chip stocks outperformed, with Micron advancing about 5% and SanDisk gaining nearly 7%.

    However, gains were uneven. Six of the S&P 500’s 11 sectors fell on Tuesday, led by financials. JPMorgan Chase and Wells Fargo each lost more than 3%. The divergence between tech strength and financial weakness remained a key theme on Wednesday.

    Oil Prices and U.S.-Iran Talks

    Brent crude traded below $100 per barrel during the morning, easing 0.40% to $98.83. Reports indicated that Saudi Arabia had restarted operations at its East-West Pipeline and might resume exports from the Red Sea port of Yanbu, helping to ease supply concerns.

    Market participants were also parsing the latest U.S.-Iran talks held on the sidelines of the United Nations General Assembly. President Trump described the meeting as “very good,” but his U.N. speech mentioned a choice between reaching a deal and “annihilating” the country, leaving traders uncertain about the path to an agreement. Oil prices are a key market driver because fuel costs influence business expenses and inflation readings.

    Trump-Xi Meeting on Trade and AI

    President Xi is scheduled to arrive in Washington on Wednesday ahead of a Thursday meeting with Trump. The agenda is expected to cover the U.S.-China trade truce, artificial intelligence regulation, and U.S. arms sales to Taiwan. Xi is also slated to meet executives from General Motors, Meta, Apple, Amazon, and Tesla.

    The talks come as AI-related stocks boost the Nasdaq. Strong interest in Meta’s Muse assistant has supported AI infrastructure providers, while some investors worry that task-performing assistants could disrupt consumer businesses, contributing to losses in financial and travel-related shares on Tuesday.

    Investors are watching the summit for any policy announcements, though no new agreement has been confirmed. The Nasdaq’s record close remains the most recent confirmed market result.

    Economic Data and Fed Speakers Ahead

    S&P Global’s September purchasing managers’ index is due Wednesday, with economists polled by Reuters expecting continued expansion in U.S. business activity. Federal Reserve Governor Michael Barr is also scheduled to speak, offering further clues on monetary policy after last week’s rate increase.

    Boston Fed President Susan Collins expressed support for the rate hike due to inflation concerns. According to CME Group’s FedWatch tool, futures traders currently price in a high chance of another 25-basis-point hike next month, a view that could shift with upcoming data and Fed commentary.

  • A Complete Guide to Crypto Derivatives: Futures, Options, and Perpetual Contracts

    A Complete Guide to Crypto Derivatives: Futures, Options, and Perpetual Contracts

    Crypto derivatives are financial instruments that allow traders to speculate on cryptocurrency prices without owning the underlying assets. They include futures, options, and perpetual contracts, and are traded on both regulated exchanges and decentralized platforms. Unlike spot trading, derivatives derive their value from the price of the underlying cryptocurrency.

    Crypto Futures

    Futures are contracts to buy or sell an asset at an agreed price on a specified future date. For example, a Bitcoin futures contract provides exposure to Bitcoin’s price without requiring the trader to hold BTC directly. They are commonly used for speculation, hedging, and institutional risk management.

    Traditional futures have expiration dates. Traders can close positions before expiry or settle according to the contract’s rules. Regulated venues like the CME have brought crypto derivatives into traditional financial markets, giving institutional participants access through established futures infrastructure.

    Perpetual Contracts

    Perpetual futures, also known as perpetuals or perps, have no fixed expiration date. Instead, exchanges use funding payments to keep perpetual contract prices aligned with underlying spot markets. When perpetual prices trade above spot, long traders may pay funding to short traders; when below spot, the direction can reverse. Funding rates thus provide useful information about market positioning—extremely positive funding indicates aggressive leveraged long exposure, while negative funding suggests stronger short positioning.

    Crypto Options

    Options give the buyer the right, but not the obligation, to buy or sell an underlying asset at a predetermined strike price. Call options benefit from higher prices, while put options provide protection or exposure to declines. Options are useful for hedging, volatility strategies, and structured trades, as losses for an option buyer are generally limited to the premium paid.

    Leverage and Risk

    The defining risk across crypto derivatives is leverage. A trader may control a position substantially larger than deposited collateral, magnifying potential gains but also increasing losses and liquidation risk. Perpetual markets can experience rapid liquidation cascades when prices move sharply against leveraged positions.

    Open interest (the number of outstanding contracts) helps analysts understand market conditions. Funding rates indicate positioning in perpetual markets, and options implied volatility shows expectations about future price movements.

    Why This Matters

    Crypto derivatives increasingly shape price discovery, liquidity, and institutional risk management. In August 2026, the CME reported an average daily volume of 175,000 cryptocurrency derivative contracts, representing USD 7.9 billion notional—highlighting their growing role beyond speculative retail trading.

    Final Thoughts

    Crypto derivatives are becoming more integrated with traditional financial markets as regulated futures and options expand alongside perpetual contracts. Understanding leverage, funding rates, open interest, collateral, and liquidation risk is essential, as derivatives can amplify both market opportunities and losses.

    FAQs

    1. What are crypto derivatives?

    Crypto derivatives are financial contracts whose value is linked to an underlying cryptocurrency such as Bitcoin or Ethereum. They allow traders to gain price exposure, hedge positions, or speculate without necessarily owning the cryptocurrency directly.

    2. What is the difference between crypto futures and perpetual contracts?

    Traditional crypto futures have a predetermined expiration or settlement date, while perpetual contracts have no fixed expiry and use periodic funding payments to keep their prices aligned with the underlying spot market.

    3. How do crypto options work?

    Crypto options give buyers the right, but not the obligation, to buy or sell an underlying asset at a specified strike price. Calls provide upside exposure, while puts can be used for downside exposure or hedging.

    4. Why is leverage risky in crypto derivatives trading?

    Leverage allows traders to control positions larger than their deposited collateral, magnifying both potential gains and losses. Sharp adverse price movements can trigger liquidations, potentially causing traders to lose some or all of the collateral supporting a position.

    5. What do open interest and funding rates indicate?

    Open interest measures the value or number of outstanding derivative contracts, helping indicate market participation. Funding rates apply to perpetual markets and can provide insight into whether leveraged positioning is leaning more heavily toward longs or shorts.

    Disclaimer: This article is for informational purposes only and does not constitute investment advice. Cryptocurrency investments carry risk, and you should conduct your own research before making any investment decisions.

  • Dogecoin Accumulation Hits Maximum Score as Breakout Pressure Intensifies

    Dogecoin Accumulation Hits Maximum Score as Breakout Pressure Intensifies

    Dogecoin holds near $0.07 as its accumulation score reaches 100. Whale purchases and futures activity are rising. A confirmed range breakout could revive targets near $0.65 and eventually above $1.25 if market participation strengthens further.

    Dogecoin remains near $0.07, while improving momentum, whale buying, and rising derivatives activity suggest pressure may be building inside its narrow trading range. Analyst Javon Marks also sees a wider cycle structure targeting $0.653 before a possible extension above $1.25. However, DOGE must hold support and escape its current range before those projections gain confirmation.

    Sideways Trading Builds a Wider Base

    DOGE is trading between about $0.0719 and $0.0730 as volatility stays unusually low. The narrow range shows that buyers and sellers have not gained firm control. Even so, the chart gives Dogecoin a maximum accumulation score of 100. This reading suggests buyers may be adding positions while price movement remains limited.

    At the same time, the relative strength index has moved toward its midpoint. Price has barely changed, which indicates that selling pressure has started to ease. The MACD histogram has also improved during the consolidation. However, volume remains weak, and the ADX still points to a ranging market.

    A clear move above $0.0730 could open the path toward $0.075 and $0.076. By contrast, a break below $0.0719 would weaken the accumulation setup.

    Cycle Pattern Revives Higher Price Targets

    Javon Marks views the current phase as post-breakout consolidation. His chart compares it with structures that appeared before Dogecoin’s major rallies in 2017 and 2021. Each earlier cycle followed a similar sequence. DOGE broke a descending trend, traded sideways for an extended period, and later entered a sharp expansion phase.

    The first major projection now sits near $0.653. This level stands close to Dogecoin’s previous cycle high and could place $0.70 within reach. A stronger advance could then support a projection above $1.25. However, the pattern still depends on DOGE holding long-term support and clearing its present range.

    Could the quiet price action mark another accumulation phase before volatility returns? For now, the setup remains a historical comparison rather than a confirmed breakout.

    Whale Buying and Leverage Increase

    Large Dogecoin holders acquired 200 million DOGE through Robinhood, according to an X post. The purchase carried an estimated value of about $14 million. The transaction added to evidence of large-wallet demand while DOGE traded sideways. Its impact will depend on whether those coins remain off exchanges or return for sale.

    Meanwhile, Dogecoin futures volume rose 114% to about $739.56 million. Open interest also increased 3.74% to roughly $1.08 billion. Rising volume and open interest show that traders added new exposure. CoinGlass data also shows liquidation clusters above and below the current price.

    These clusters could increase volatility if the price reaches either side. Broader market conditions offered some support, with Bitcoin above $64,000 and Ethereum above $1,870. XRP remained below $1.10, showing uneven performance among major cryptocurrencies. DOGE still needs stronger spot participation before its developing setup becomes more reliable.

  • XRP Spot Demand Surges as Futures Traders Retreat and Ripple Secures MiCA Approval in Luxembourg

    XRP Spot Demand Surges as Futures Traders Retreat and Ripple Secures MiCA Approval in Luxembourg

    XRP is experiencing a notable divergence between its spot and futures markets. Spot buyers have ramped up activity while derivatives traders reduce leverage, according to recent data. Meanwhile, Ripple has secured full Markets in Crypto-Assets (MiCA) authorization in Luxembourg, expanding its regulated footprint across Europe.

    Spot Buyers Increase Activity While Futures Exposure Falls

    CryptoQuant data reveals that XRP maintained its price near $1.14 despite a steady decline in open interest, which dropped from over $1 billion to approximately $823.8 million. This suggests traders are reducing leveraged positions rather than building larger futures bets. Meanwhile, XRP’s Spot Taker Cumulative Volume Delta (CVD) showed strong taker-buy activity before returning to a more balanced level. Early spot buyers remained more aggressive than derivatives traders during the observed period.

    Additionally, CEX Estimated Spot CVD improved from roughly negative $42 million to positive $406 million—an increase of about $448 million over two months, indicating steady spot demand despite weaker derivatives participation. In contrast, Futures Taker CVD remained weak to neutral throughout the same period, underscoring that futures traders did not match the buying strength seen in spot markets.

    Binance data reflects the same trend. Binance Perpetual CVD declined from about negative $48 million to negative $783 million, showing continued selling pressure in perpetual contracts. Moreover, Binance open interest dropped from approximately $255 million to $203 million, further confirming that traders continue to reduce leveraged positions even as XRP holds relatively stable.

    Ripple Expands European Regulatory Approval

    Ripple announced that Luxembourg’s Commission de Surveillance du Secteur Financier (CSSF) granted the company a Crypto-Asset Service Provider (CASP) license under the European Union’s MiCA framework. This approval allows Ripple to passport regulated crypto services across all 27 European Economic Area member states, thereby expanding its regulated digital asset services throughout the region.

    Following its initial MiCA clearance in June, Ripple stated that the CASP license completes its authorization process under the European regulatory framework. The company also noted that the approval complements its existing European e-money license. Furthermore, Ripple indicated that these combined approvals support its cross-border payments business serving banks, financial institutions, and enterprise clients. The framework provides a regulated structure for crypto payment services across Europe, enabling wider adoption of XRP-powered payment products alongside its RLUSD stablecoin.

    Commenting on the development, Ripple managing director for the UK and Europe, Cassie Craddock, said the company is now fully prepared to expand operations under the MiCA framework after completing the regulatory transition.

    XRP ETFs Extend Inflow Streak

    Institutional demand also remained steady during Ripple’s regulatory expansion. According to SoSoValue, XRP spot exchange-traded funds recorded eight consecutive weeks of net inflows, with cumulative net inflows reaching $1.49 billion. Although the funds recorded no new daily inflows on July 6, total assets under management remained near $1.05 billion, representing approximately 1.47% of XRP’s total market capitalization.

    Meanwhile, crypto.news data shows XRP trading around $1.13 on Tuesday, down 1.1% over the previous 24 hours but remaining nearly 9% higher for the week. During the same period, Bitcoin maintained weekly gains exceeding 10% despite weakness in U.S. equities and rising oil prices linked to geopolitical tensions. Investors also continue monitoring developments surrounding the final version of the GENIUS Act, expected before July 18, while Ether traded near $1,800.

    What’s Next?

    XRP spot demand continues to strengthen as futures traders reduce leverage, creating a clear divergence between the two markets. Meanwhile, Ripple’s full MiCA approval in Luxembourg and XRP spot ETFs’ eight-week inflow streak reflect sustained institutional participation alongside the company’s regulatory expansion. Market participants will watch for further developments in both regulatory frameworks and price action.

  • Bitcoin Holds $62K Support as Rising Japanese Yields Test Risk Appetite

    Bitcoin Holds $62K Support as Rising Japanese Yields Test Risk Appetite

    Bitcoin is holding near $63,300 after a turbulent week, as bulls defend the $62,000 support level. The rebound faces a fresh challenge from surging Japanese government bond yields, which have climbed to 30-year highs and are pushing global borrowing costs higher.

    Japanese 10-year bond yields rose to 2.85%, an 18-basis-point increase since the start of July. This move has lifted U.S. Treasury yields to test 4.5%, while German and UK yields are also climbing. Higher yields make fixed-income assets more attractive relative to Bitcoin, which does not pay interest, raising the opportunity cost of holding BTC.

    Bitcoin found support near $58,000 on July 1 and rallied to $64,000, driven by softer U.S. inflation data and weaker jobs numbers. Fed Chair Kevin Warsh noted on July 1 that inflation risks had diminished, and the June nonfarm payrolls report showed only half the expected job gains. The labor force participation rate fell to 61.5%, its lowest in over five years. These factors fueled rate-cut hopes and boosted risk assets.

    However, the recovery was partly futures-driven, with net futures buying reaching $415 million on Sunday while spot flows remained slightly negative. This made the rally vulnerable to a fast unwind. A subsequent sell-off was triggered by Strategy’s disclosure of a $216 million Bitcoin sale to fund dividends on preferred securities. The company sold 3,588 BTC, causing a sharp price drop.

    Bitcoin later recovered as futures buying returned, supported by $143 million in spot buying. Liquidations surged 279.73% to $236.38 million in 24 hours, forcing leveraged positions to close and driving a short squeeze. BTC is now trading in a tight range: holding above $62,000 could allow a test of $65,000, while a break below may expose $60,000 or $59,500. The Fear & Greed Index stands at 28, signaling ‘Fear.’

    Analysts remain divided on the impact of rising Japanese yields. Goldman Sachs expects the yen to weaken further and continues to favor yen-funded carry trades, suggesting that global risk appetite may not fully unwind. For now, traders are watching key support and resistance levels as macro factors and corporate flows shape Bitcoin’s next move.

  • XRP at $1.10: What the 2-Year Technical Signal Reveals About the Next Big Move

    XRP at $1.10: What the 2-Year Technical Signal Reveals About the Next Big Move

    XRP continues to hover near the critical $1.10 level, drawing renewed attention from traders after a sharp decline from its May highs above $1.50. The token currently trades around $1.11, down nearly 2% in the past 24 hours, as the broader crypto market remains under pressure. Bitcoin and other altcoins have also faced selling, compounding the stress on XRP.

    The 2-Year Signal That Has Traders Watching Closely

    A rarely seen technical pattern on XRP’s long-term charts has caught the eye of analysts. XRP has slipped below its 200-day moving average—currently near $1.13—a key level that often acts as long-term support. More notably, the token’s 2-year trend line has flattened for the first time since late 2024. Historically, such formations have preceded significant price swings in either direction, making this a pivotal moment for traders.

    XRP Stuck Between Key Support and Resistance

    Price action remains rangebound, with XRP contained between $1.05 support and $1.20 resistance. Buyers have failed to generate enough momentum to break higher, while sellers have not pushed the price below critical support. This indecision leaves the market waiting for a catalyst.

    Ripple Escrow Releases Add Pressure

    Ripple’s monthly 1 billion XRP escrow unlock continues to inject fresh supply into the market. While the program is part of Ripple’s long-standing strategy, the additional tokens often weigh on sentiment during periods of weak demand. The latest release has done little to inspire confidence amid the current downtrend.

    Positive News Fails to Boost Price

    Ripple recently announced it secured MiCA regulatory approval in Luxembourg, enabling expanded payment services and stablecoin operations across Europe. Despite this positive development, XRP’s price barely reacted, underscoring that traders are more focused on short-term fear than long-term fundamentals.

    Futures Market Signals Big Trader Activity

    Derivatives data tells a different story. XRP futures open interest has surged to $2.89 billion, including $1.4 billion on CME futures—a clear sign that institutional players are positioning for a major move. Additionally, spot ETF-related inflows tied to XRP products have exceeded $1.43 billion, indicating that large investors remain bullish on the asset’s long-term potential.

    What Traders Should Watch Next

    The coming weeks could define XRP’s next trend. A breakdown below the psychological $1.00 support could trigger stop-losses and push the price toward the $0.90–$0.85 zone. Conversely, a move above $1.20 resistance would likely restore confidence and open the path toward $1.35 and eventually $1.50. The 2-year flattening pattern suggests that the market is entering a critical accumulation phase, historically followed by a strong breakout. Until a clear direction emerges, caution will likely prevail.

    Key Takeaways

    • XRP price is trapped between $1.05 support and $1.20 resistance.
    • XRP futures open interest reached $2.89 billion, signaling high market activity.
    • A break below $1.00 or above $1.20 may determine XRP’s next major trend.