Tag: investor sentiment

  • Beyond Interest Rates: 5 Key Drivers of Stock Market Movements

    Beyond Interest Rates: 5 Key Drivers of Stock Market Movements

    Interest rates often dominate financial headlines, but they are far from the only force influencing stock markets. Corporate earnings, inflation, commodity prices, geopolitical events, currencies, investor sentiment, and capital flows all play significant roles. Understanding these factors helps investors interpret market movements and avoid relying on a single indicator.

    1. Corporate Earnings and Profit Expectations

    Corporate earnings are one of the strongest drivers of individual stock prices. Investors constantly compare reported results with market expectations. A company can report higher profits and still see its shares fall if earnings disappoint against already-high expectations. Revenue growth, profit margins, guidance, and future earnings estimates all matter. Strong results can support valuations when investors expect continued growth, while disappointing results can put pressure on share prices. The broader market also depends on earnings across major sectors such as technology, financials, healthcare, energy, and consumer companies.

    2. Inflation and Economic Data

    Investors track consumer prices, employment, wages, manufacturing, and economic growth. These reports can change expectations about future business conditions. Higher inflation can increase companies’ costs, pressuring profit margins, while lower inflation can improve purchasing power and reduce pressure on operating costs. Economic growth also matters: strong growth supports corporate revenue and consumer spending, while weak growth raises concerns about future earnings. Markets react quickly to major economic releases.

    3. Commodity Prices and Energy Costs

    Oil, natural gas, metals, and agricultural commodities can influence markets worldwide. Oil is particularly important as energy affects transportation and manufacturing costs. Higher prices can squeeze margins across industries such as airlines, chemicals, logistics, and manufacturing. Energy producers may experience a different earnings impact. Commodity movements also affect inflation expectations, creating another channel for market volatility. Recent oil price movements above USD 108 per barrel amid geopolitical tensions have put global equities under pressure.

    4. Geopolitical Events and Government Policies

    Wars, trade restrictions, elections, sanctions, and diplomatic disputes can quickly change investor expectations. Markets often react before the economic consequences become clear. Investors may reduce exposure to sectors facing direct risks. Trade policies can affect companies operating across borders—tariffs may increase costs or reduce demand for exported products. Geopolitical risks can also disrupt energy supplies and shipping routes, spreading across multiple economies. Energy prices and trade policies are extremely important in today’s situation.

    5. Investor Sentiment, Currency, and Market Flows

    Markets are influenced by how investors allocate capital. Foreign investment flows can affect stock prices, particularly in emerging markets, while domestic institutional flows can provide substantial buying or selling pressure. Currency movements matter for companies with international revenues or costs—a stronger local currency can reduce overseas earnings after conversion. Investor sentiment adds another layer: fear can accelerate selling, while optimism can increase demand for riskier assets. Market positioning can sometimes amplify an otherwise modest news event, explaining why similar announcements can produce different reactions.

    Why a Wider Market View Matters

    Interest rates are important, but they rarely explain every market move. Corporate earnings show whether businesses are generating profits. Economic data provides clues about demand and growth, while commodity prices reveal changing cost pressures. Geopolitical events can alter trade and supply chains. Currency movements and investor flows influence liquidity and valuations, and sentiment can magnify these underlying forces. By watching several indicators, investors gain better context—since no single market signal explains every rise or decline.

    Frequently Asked Questions

    What factors move the stock market besides interest rates?

    Corporate earnings, inflation, economic growth, commodity prices, currencies, geopolitical developments, investor sentiment, and capital flows can all influence stock markets. These factors often interact, making market movements more complex than a single interest-rate decision.

    How do corporate earnings affect stock prices?

    Earnings provide information about a company’s financial performance. Investors compare reported results with expectations. Strong revenue, profits, margins, and guidance can support valuations, while disappointing results can put pressure on share prices.

    Does inflation affect the stock market?

    Yes. Inflation can increase business costs and reduce consumer purchasing power. It can also influence expectations for monetary policy, affecting company earnings, bond yields, and investor valuations.

    Why do oil prices affect stocks?

    Oil is an important input for transportation, manufacturing, and several other industries. Rising prices can increase operating costs, while energy companies may see higher revenue from increased commodity prices.

    How do geopolitical events affect stock markets?

    Wars, sanctions, trade restrictions, and supply disruptions can change investor expectations. They affect energy prices, shipping costs, currencies, and specific industries. Markets can react before the full economic impact becomes visible.

    Disclaimer: This article is provided for informational purposes only and does not constitute investment advice. Readers should conduct their own research before making any investment decisions.
  • Samsung Achieves Record Q2 Revenue Driven by AI Memory Chip Demand

    Samsung Achieves Record Q2 Revenue Driven by AI Memory Chip Demand

    Samsung Electronics Co. Ltd. reported a sharp increase in Q2 earnings, fueled by strong demand for AI memory chips, even as its share price remains volatile amid investor concerns about future spending and competition.

    The South Korean technology group’s revenue for the quarter ending June 30 reached 171.5 trillion won, its highest quarterly revenue on record. Net profit rose to 71.27 trillion won, surpassing Bloomberg estimates of 68.36 trillion won. Additionally, operating profit increased more than 19-fold to approximately 89.5 trillion won, broadly in line with the company’s previous forecast.

    AI Memory Business Continues to Lead Growth

    The semiconductor business remained the primary growth driver. It benefited from high memory chip prices and rising volumes of its advanced High Bandwidth Memory (HBM) products for AI servers and data centers. According to the company, demand from cloud providers and AI infrastructure projects continued to support strong pricing across the memory market. Samsung anticipates this trend to continue in the second half of 2026.

    Samsung predicted ‘robust demand centered on servers stemming from continued AI infrastructure capex and broader adoption of agentic AI.’ Even with production increases, Samsung stated that the global memory market would remain ‘undersupplied.’

    Consumer Business Remains Under Pressure

    While the semiconductor business earned a record profit, Samsung’s smartphone, television, and home appliance divisions were less profitable as consumer demand weakened and component prices jumped. The company will continue to focus on high-margin AI memory products and invest in expanding its semiconductor manufacturing. In 2026, projects on 2-nanometer technology chips are projected to more than double each year, executives said in a post-earnings conference call.

    Market Reaction and Outlook

    Samsung shares were highly volatile during Thursday’s trading session, despite the strong results. The stock initially surged up to 7% but lost most of its gains as overall market weakness hit South Korea’s stocks. Investor sentiment is growing skeptical about the ability of AI-led semiconductors to maintain their valuations. Competition from Chinese chipmakers and heavy capital spending have also dampened investor confidence. Samsung also revealed that it is not currently planning to list its shares on American Depository Receipts (ADR), following queries from investors after rival SK Hynix recently listed in the US.

  • Ethereum’s 2026 Growth Slowdown: Price, Network Activity and Competition Shake Confidence

    Ethereum’s 2026 Growth Slowdown: Price, Network Activity and Competition Shake Confidence

    Key Takeaways

    • Ethereum price sits nearly 68% below previous cycle highs, reflecting weakened market confidence.
    • Active wallet addresses have dropped 46% since February 2026, signaling lower network participation.
    • Competition from Solana, Avalanche, and Base intensifies pressure on Ethereum’s dominance.

    Ethereum has long been a cornerstone of the digital asset market. As the second-largest cryptocurrency by market cap, it pioneered decentralized finance (DeFi), NFTs, blockchain gaming, and smart contracts. For years, rapid adoption and innovation fueled the narrative of unstoppable growth. However, recent trends indicate that momentum is slowing.

    In 2026, Ethereum faces a tougher environment. Weak price performance, declining network activity, rising competition, and shifting investor sentiment have raised doubts about whether it can maintain its previous growth trajectory.

    Ethereum Price Remains Under Pressure

    One of the clearest signs of slowing momentum is Ethereum’s market performance. Currently trading near $1,570, ETH has fallen roughly 68% from its cycle highs. This weak performance has disappointed many investors, especially as Bitcoin has fared much better in the same period.

    Ethereum’s total market capitalization now stands around $190 billion, with daily trading volume between $9 billion and $10 billion. Although price swings persist, a sustained upward move has yet to materialize. The lack of a strong recovery has created uncertainty, with many investors waiting for clearer signals before committing capital.

    Network Activity Has Fallen Sharply

    On-chain activity is a critical health metric for any crypto network, and Ethereum’s metrics are flashing red. Since February 2026, the number of active wallet addresses has plummeted nearly 46% — from a peak of about 795,000 to just 420,000.

    This decline is significant because active wallets represent real user engagement. Fewer transactions and lower participation suggest waning demand for the network. Ethereum’s success has always depended on heavy usage; the current slowdown raises concerns about organic growth.

    Competition Has Intensified

    Ethereum once dominated the blockchain sector with little competition, but that has changed. Networks like Solana, Avalanche, and Base now aggressively court developers and users with faster transactions and lower fees. These advantages attract projects seeking better user experience and cost efficiency.

    While Ethereum still leads in Total Value Locked (TVL) — a measure of capital deployed in DeFi — its lead is no longer as secure as it once was.

    Questions Around Ethereum’s Value Model

    The successful transition to Proof-of-Stake (The Merge) reduced energy consumption by over 99%, a major achievement. However, questions remain about Ethereum’s economic model. Unlike Bitcoin, which is increasingly viewed as digital gold, Ethereum’s value proposition is more complex.

    The network supports applications, but investors debate whether higher usage directly translates into ETH price appreciation. Additionally, the rise of Layer 2 solutions moves many transactions off the main blockchain. While this improves efficiency, it also creates uncertainty about how much value flows back to the native ETH token.

    Institutional Investors Show Mixed Signals

    Despite market weakness, some large institutions still show confidence. Crypto treasury company Sharplink recently purchased 10,000 ETH ($16 million), and Bitmine Immersion Technologies bought over 71,000 ETH — one of the largest purchases in 2026.

    Development Work Continues at a Strong Pace

    Ethereum still leads in developer activity. The Ethereum Foundation is working on the Glamsterdam network upgrade, which aims to restructure data processing and block building to improve base-layer performance. Developers also introduced Reth v0.1.0-alpha, a modular node system designed to boost overall efficiency.

    Investor Confidence Has Weakened

    Sentiment around Ethereum has clearly deteriorated. The ETH/BTC ratio has fallen to multi-year lows, meaning Ethereum continues to underperform Bitcoin. Analysts increasingly view Bitcoin as the stronger institutional asset, especially after spot ETF products drove demand.

    Global economic uncertainty and tighter liquidity have also reduced risk appetite across crypto. Altcoins like Ethereum typically suffer more during such periods.

    Why This Matters

    Ethereum’s slowdown represents a major structural shift in Web3. With active mainnet addresses dropping 46% and the ETH/BTC ratio hitting multi-year lows, the second-largest cryptocurrency must defend its market share against faster, cheaper competitors like Solana and Base.

    The Growth Story Has Slowed, But Not Ended

    Ethereum is not losing relevance, but its rapid growth phase has clearly decelerated. The network still leads in innovation, developer activity remains strong, and some institutional investors continue to accumulate.

    Nevertheless, Ethereum faces a difficult period. Dropping user activity, fierce competition, and shaken investor confidence pose serious challenges. The old narrative of unstoppable growth no longer holds the same weight.

    Frequently Asked Questions

    1. What are the main drivers behind Ethereum’s momentum loss in 2026?

    The slowdown stems from a 46% drop in active wallet addresses since February 2026, prolonged price stagnation, and aggressive competition from low-cost blockchains like Solana and Avalanche.

    2. Where does Ethereum’s price and market valuation stand right now?

    Ethereum trades near $1,570, roughly 68% below its historic highs. Market capitalization is about $190 billion, with daily trading volumes between $9–10 billion.

    3. Are institutional investors still buying ETH despite declining user activity?

    Yes. Sharplink acquired 10,000 ETH ($16 million), and Bitmine Immersion Technologies bought over 71,000 ETH — one of 2026’s largest trades.

    4. Why are Layer 2 solutions causing debate over Ethereum’s economic value?

    Layer 2 networks improve speed and cost by moving activity off the main chain, but they complicate the investment narrative by making it unclear whether Layer 2 growth boosts ETH’s price.

    5. How are developers responding to Ethereum’s growth challenges?

    Development remains highly active. The Ethereum Foundation is progressing with the Glamsterdam upgrade and launching Reth v0.1.0-alpha, a modular node system to improve network efficiency.

  • Big Tech’s Magnificent 7 Stocks Plunge $2.3 Trillion as AI Investment Doubts Mount

    Big Tech’s Magnificent 7 Stocks Plunge $2.3 Trillion as AI Investment Doubts Mount

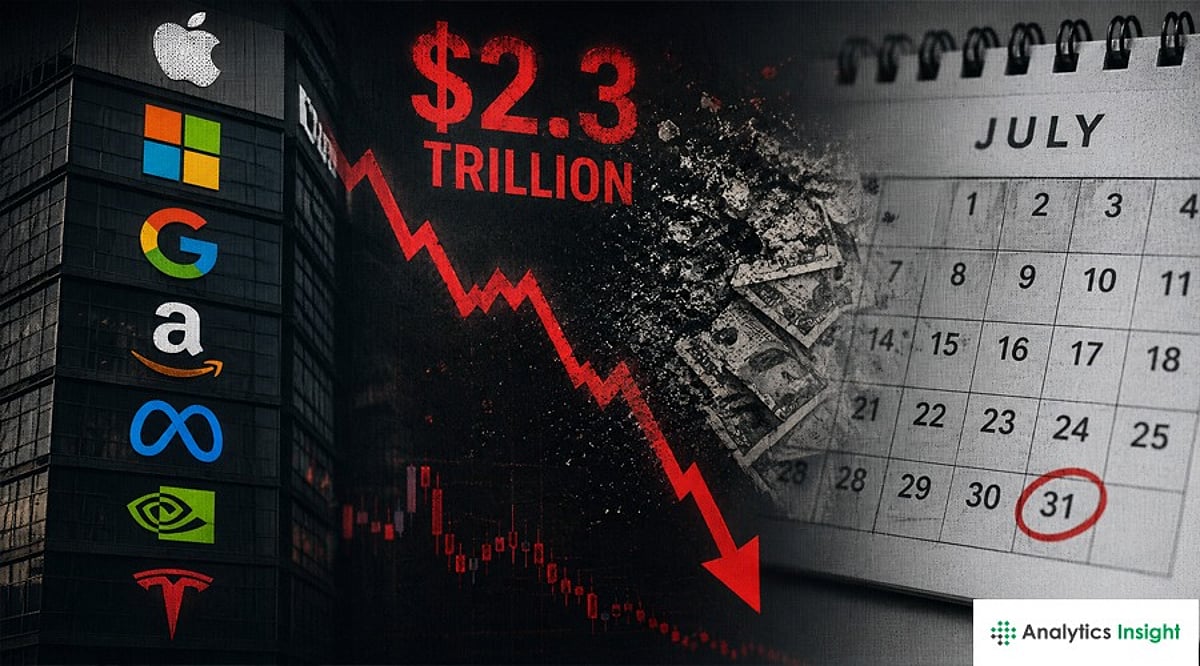
    June proved disastrous for the Magnificent 7 stocks as investor anxiety over massive AI spending and uncertain returns triggered a selloff that erased nearly $2.3 trillion in market value. The decline ranks among the steepest monthly losses ever recorded for Big Tech.

    The group—comprising Microsoft, NVIDIA, Apple, Alphabet, Amazon, Meta, and Tesla—had led the market for months on AI enthusiasm. However, June brought a sharp reversal as attention shifted from future promise to current spending and profitability.

    The Magnificent 7 Index fell roughly 10% in June, extending its decline to more than 13% from a mid-May peak. Investors now demand concrete evidence that billions poured into AI infrastructure will translate into higher earnings.

    Microsoft suffered the steepest drop among the seven, with its stock tumbling about 20% in June. NVIDIA lost nearly 13%, while Apple and Amazon each declined around 8%. The broad selloff reflects growing caution around companies investing heavily in AI without clear financial payoffs.

    Big Tech continues to pour capital into AI. Microsoft, Amazon, Alphabet, and Meta are expanding data centers and purchasing advanced AI chips to support future growth. Industry analysts estimate AI-related spending could exceed $700 billion in 2026. Such outlays have depressed free cash flow expectations, undermining investor confidence in valuations.

    Analysts believe the upcoming earnings season will be pivotal. Investors want to see that AI investments are boosting revenue rather than simply inflating costs. Wedbush analyst Dan Ives noted that the next earnings reports could clarify whether the AI investment cycle is on the right track.

    Recent market moves suggest a preference for tangible results over ambitious promises. Companies that successfully convert AI spending into stronger earnings may recover investor trust more quickly.

    Capital has also rotated toward AI hardware makers. Semiconductor and memory companies have outperformed the Magnificent 7 this month. The Philadelphia Semiconductor Index gained about 6% in June and is still up more than 90% year-to-date, indicating that investors currently favor businesses directly benefiting from AI demand.

    Many experts argue that the selloff does not signal the end of the AI story. Instead, the market is demanding clearer proof that expensive AI projects will generate improved profits. The coming round of earnings reports will be crucial in determining whether the Magnificent 7 rebound or remain under pressure for the rest of the year.