Tag: market cap

  • AI Reshapes Chip Industry: Top Semiconductor Companies by Market Cap

    AI Reshapes Chip Industry: Top Semiconductor Companies by Market Cap

    AI’s Impact on Semiconductor Valuations

    Artificial intelligence is fundamentally transforming how investors evaluate semiconductor companies. The industry now spans GPUs, memory, foundries, networking chips, manufacturing equipment, and advanced processors. Recent market-cap data underscores this shift, with several chipmakers reaching historic valuations as demand for AI infrastructure expands across data centers and increasingly complex computing workloads worldwide.

    Nvidia Leads the Pack

    Nvidia dominates the semiconductor rankings with a market capitalization of approximately $5.33 trillion. Its position reflects surging demand for accelerated computing, AI processors, and data center infrastructure. The company’s valuation is substantially larger than other listed semiconductor businesses, highlighting the financial importance of AI computing platforms and supporting technologies.

    TSMC Powers Advanced Manufacturing

    TSMC ranks second with a market cap of about $2.24 trillion. As the leading contract chip manufacturer for major technology companies, TSMC’s strategic importance has grown with the need for advanced processors — especially energy-efficient chips that can handle demanding AI workloads.

    Broadcom’s Networking Edge

    Broadcom appears among the largest with an estimated market capitalization of $1.72 trillion. Its portfolio includes networking and connectivity technologies that support large-scale computing infrastructure. As AI data centers expand, demand is rising not only for processors but also for high-speed networking and specialized components that connect complex systems.

    Memory Plays a Big Role

    Samsung and Micron hold market caps of approximately $1.20 trillion and $1.12 trillion respectively, while SK Hynix follows at around $907 billion. Their positions reflect the growing importance of memory technologies, particularly high-bandwidth memory (HBM), which is essential for demanding AI workloads and large-scale accelerated computing systems.

    Other Key Players

    AMD is shown at approximately $894 billion, ASML reaches $633 billion, CXMT stands at $565 billion, and Intel follows at about $547 billion. This ranking demonstrates that AI-related value extends beyond GPU manufacturers, encompassing processors, manufacturing equipment, and memory — all critical to producing advanced chips.

    AI Lifts the Entire Stack

    The semiconductor market is becoming increasingly interconnected as AI accelerates demand across multiple layers. Processor designers, memory manufacturers, foundries, networking companies, and equipment suppliers all support expanding AI infrastructure. The market-cap figures illustrate how investors are assigning significant value across this ecosystem, reflecting expectations for continued computing demand and technological investment.

  • AMD Reaches $1 Trillion Market Cap on Surging AI Chip Demand

    AMD Reaches $1 Trillion Market Cap on Surging AI Chip Demand

    AMD’s market value surpassed $1 trillion for the first time, driven by surging demand for AI chips and record data center sales.

    The chipmaker’s share price jumped approximately 10% on September 21, reaching a record high of $615.52. The stock gained about 25% in five trading sessions as investors focused on AMD’s AI chip and data center growth.

    Strong Financial Performance

    AMD reported second-quarter revenue of $11.54 billion, up 50% year-over-year. Data center sales reached $6.7 billion, more than double the figure from the same period last year. CEO Lisa Su stated that the company expects to double its data center sales again in 2027.

    AI Chips Drive Growth

    The growth is not just from traditional PC and server processors but increasingly from AI chips. Companies are heavily investing in AI computing, requiring more chips to run these systems. AMD is capitalizing on this demand to expand its data center business and compete for a larger share of the AI hardware market.

    AMD is shifting its strategy from selling individual chips to offering complete systems that include processors, AI accelerators, networking equipment, and other hardware. This approach provides customers with a comprehensive solution for building and running AI infrastructure.

    Market Position

    The $1 trillion milestone underscores how AI has transformed AMD’s business. However, the company still trails behind NVIDIA, which has a market valuation of over $5 trillion. AMD will need to refine its strategies to become a stronger competitor in the AI chip market.

  • NVIDIA Stock at $219: Key Drivers Behind Its $5.3 Trillion Market Cap and AI Spending Outlook

    NVIDIA Stock at $219: Key Drivers Behind Its $5.3 Trillion Market Cap and AI Spending Outlook

    NVIDIA (NVDA) closed near USD 219.34 on September 17, 2026, giving the company a market capitalization of roughly USD 5.30 trillion. The chipmaker became the first in history to cross the USD 5 trillion mark in October 2025, and it has stayed above that level ever since.

    Record Revenue and Data Center Growth

    NVIDIA’s fiscal Q2 2027 results showed record revenue of USD 96.2 billion, up 106% year-over-year. Data Center revenue reached USD 89.0 billion, up 117%, driven primarily by Blackwell systems and early production shipments of the next-generation Vera Rubin platform. GAAP gross margin came in at 75.0%, with diluted EPS of USD 2.46. The company guided Q3 revenue to USD 108.0 billion, plus or minus 2%, and noted that figure assumes no Data Center compute revenue from China.

    Trillion-Dollar Demand Outlook

    CEO Jensen Huang stated at NVIDIA’s GTC event that the company expects at least USD 1 trillion in demand and purchase orders for its Blackwell and Vera Rubin chips through 2027. This forward-looking outlook is not a signed order book, and analysts will watch actual shipments against that projection. NVIDIA’s disclosed purchase and supply commitments had climbed to about USD 279 billion by the end of fiscal Q2, reflecting the company’s efforts to lock in capacity.

    AI Spending Durability Under Scrutiny

    While demand for AI computing is evident, the key question is whether hyperscalers, AI labs, and enterprises can sustain the pace of capital spending. This uncertainty came into focus on September 14, when the Philadelphia Semiconductor index fell 5.9% and NVIDIA shares dropped about 3.4%. The selloff followed warnings from AI industry executives about the pace and economics of AI infrastructure spending, marking one of several sector-wide declines this year tied to debt-funded data center buildouts. NVIDIA’s future growth depends heavily on that spending pace holding up.

    China, Competition, and Valuation

    NVIDIA’s current guidance excludes Data Center compute revenue from China due to ongoing US export restrictions. Any policy shift could affect revenue, product mix, and margins. The company’s competitive edge rests on its CUDA software ecosystem, combined hardware and networking lineup, and deep ties with major cloud and AI customers. Custom chips from cloud providers, including Google’s TPU line, and AMD’s accelerators pose longer-term threats, though neither has slowed NVIDIA’s momentum so far. The stock’s low dividend yield reflects a focus on growth over shareholder payouts.

    Final Thought

    NVIDIA’s stock price reflects a company posting real, verified growth while carrying a demand outlook that assumes years of heavy AI infrastructure spending. The September selloff was a reminder that markets are pricing confidence in that spending pace, not just the chips themselves. The next earnings report, scheduled for November 25, will provide fresh evidence on whether Data Center growth holds its current speed and whether customer AI budgets remain strong.

  • CASHCAT Surges 120% to $86M Market Cap as Robinhood Chain Deposits Rise and Bybit Launches Perpetual Contract

    CASHCAT Surges 120% to $86M Market Cap as Robinhood Chain Deposits Rise and Bybit Launches Perpetual Contract

    CASHCAT, the cat-themed memecoin on Robinhood Chain, has rebounded sharply to an $86 million market cap after a 120% weekly gain. The token’s price reached approximately $0.087 with a daily trading volume of $9 million, though it remains below its July peak of $0.22. Created by outside developers using Robinhood’s former cat-with-cash logo, the project is described by its website as ‘fan fiction with a ticker.’

    CASHCAT became Robinhood Chain’s first breakout memecoin within a week of the mainnet launch on July 1, with early wallets recording seven-figure returns during the initial surge. However, launch activity has since declined. The Noxa launchpad stopped accepting new launches on July 11 and went offline two days later, having earned an estimated $12 million in fees. Daily token deployments across Robinhood Chain launchpads fell from roughly 35,000 in mid-July to nearly 10,000. Noxa still holds about $137,000 in CASHCAT and has not sold.

    According to DEXTools data, there are approximately 41,200 holders, with the entire 989 million supply in circulation. The Uniswap liquidity pool holds 2.47% of the supply, while the next largest wallets each hold between 1.3% and 1.5%. The liquidity pool now contains $5 million, compared with $6.6 million when CASHCAT had a $105 million valuation.

    Robinhood Chain Activity Rises

    Robinhood Chain’s total value locked (TVL) reached $774 million after rising 20% in seven days. Lending protocols accounted for 43% of TVL, while asset management represented 41.5%. Key players include Morpho with $332 million (supporting Robinhood’s on-chain earn product) and Ethena with $236 million. Stablecoin balances grew 14% weekly to $575 million.

    Bybit Adds Leveraged Trading

    Bybit has introduced a CASHCAT perpetual contract with up to 10x leverage, further boosting trading activity. However, questions remain about trading momentum after Robinhood stops covering gas fees around late September. The chain’s stated tokenized-asset total stands at $27.6 million, while another active-market measure reached $100 million, up from about $70 million in late July. During that earlier period, about 12 tokenized stocks each recorded more than $500,000 in daily trading, with GameStop’s tokenized stock generating $26 million alone.

    CASHCAT’s recovery comes amid growing Robinhood Chain deposits and stablecoin balances, yet declining token launches and the impending end of subsidized gas fees represent key tests for the ecosystem’s sustainability.

  • Amazon Hits $3 Trillion Market Cap as AI Fuels AWS Revenue Surge

    Amazon Hits $3 Trillion Market Cap as AI Fuels AWS Revenue Surge

    Amazon’s market capitalization crossed the $3 trillion threshold for the first time on August 3, 2026, following a strong second-quarter earnings report that highlighted the company’s accelerating cloud growth driven by artificial intelligence demand.

    The e-commerce and cloud computing giant’s stock gained approximately 5% to reach a record near $285, pushing its 2026 gains above 23%. The rally came after Amazon reported its fastest cloud growth in more than four years, with Amazon Web Services (AWS) revenue surging 37% year-over-year to $42.2 billion—well above the market estimate of $40.5 billion.

    Amazon became the fifth company to achieve a $3 trillion market capitalization, joining Apple, Microsoft, Alphabet, and NVIDIA. NVIDIA still holds the highest market value, near $5 trillion. Amazon first reached a $2 trillion valuation in June 2024, adding another trillion dollars in just over two years as cloud sales, advertising revenue, and retail activity expanded.

    AWS Revenue Beats Forecasts

    AWS generated $42.2 billion in second-quarter revenue, up 37% from the same period last year. The result exceeded market expectations and marked AWS’s strongest growth rate in 18 quarters. Analysts had expected about $40.5 billion, leaving the cloud unit nearly $1.7 billion above the consensus forecast.

    Total Amazon revenue reached approximately $200.6 billion, rising 20% from the previous year and surpassing Wall Street forecasts near $197 billion. The AWS contract backlog increased to $496 billion from $364 billion in the previous quarter, signaling strong future demand.

    Artificial intelligence workloads drove more demand for computing power, storage, and chips. Amazon said its AI and chip businesses each passed annual revenue run rates of $25 billion. AWS has also expanded agreements with OpenAI, Anthropic, Meta, and other corporate customers.

    Outside cloud services, Amazon reported strong growth. Advertising revenue increased 26% to $19.8 billion. The retail business also benefited from Prime Day sales and faster delivery services across more locations.

    Amazon Raises 2026 Spending Plan

    Amazon raised its 2026 capital expenditure forecast to $220 billion from $200 billion. Chief Executive Andy Jassy linked the increase partly to higher memory prices and continued investment in data centers, chips, and AI systems.

    “We will still not have enough capacity to meet all the demand we have in 2026,” Jassy said, adding that demand already booked for 2028 was ‘striking,’ pointing to long-term customer commitments.

    However, the higher spending affected cash flow. Amazon reported negative free cash flow of $7.6 billion, compared with positive free cash flow of $18.2 billion one year earlier. The company spent $54.2 billion on property and equipment during the quarter.

    Amazon’s results arrived during a broad review of technology spending. Microsoft also reported strong Azure growth, while Google Cloud posted faster sales growth. Investors focused on whether rising cloud revenue could keep pace with spending on servers, chips, and data centers.

    Amazon’s $3 trillion valuation placed the company among a small group of technology firms that have reached the level. Its latest market value followed stronger AWS growth, higher company revenue, and a larger infrastructure budget for 2026.

  • Solana Holds Near $73 as Market Cap Drops to $42.6B; ETF Inflows Return

    Solana Holds Near $73 as Market Cap Drops to $42.6B; ETF Inflows Return

    Solana (SOL) is trading at $73.38 as of Friday, down 0.93% over the past 24 hours, as the token tests the trendline support of a symmetrical triangle pattern on the daily chart. The broader cryptocurrency market remains cautious, with SOL’s market capitalization falling to $42.61 billion and daily trading volume declining 8.64% to $1.63 billion.

    ETF Flows Show Mixed Sentiment

    According to SoSoValue, U.S. spot Solana ETFs recorded net inflows of $403,890 on Thursday, marking the second consecutive session of positive flows. However, earlier in the week, Tuesday saw $18.07 million in net outflows, which were offset by Wednesday’s $19.06 million in inflows. This mixed pattern suggests institutional interest remains steady but cautious amid broader market volatility.

    Derivatives Data Points to Rising Buyer Demand

    Data from CoinGlass shows that Solana’s funding rate has increased to 0.0052%, up from 0.0041% the previous day, indicating growing demand among buyers for long positions. However, trading volume in derivatives has dropped nearly 25% over the past 24 hours to $5.20 billion, while open interest has eased by roughly 1% to $4.36 billion. This suggests a decline in overall activity even as the notional value of active contracts remains stable.

    DeFi Activity Cools Across Major Protocols

    On-chain data from DefiLlama reveals a cooling in Solana’s DeFi ecosystem. PumpSwap saw fees drop 28.1% over the past day and 31.54% over 30 days. Raydium AMM posted a 17.81% daily fee decline and a more significant 35.24% drop over 30 days. Orca DEX was down 50.26% over the past 30 days. Reduced on-chain trading activity typically weakens demand for SOL as a gas and staking asset. However, some protocols bucked the trend: HumidiFi posted a 32.87% increase in fee growth over seven days, while BisonFi surged 145.05% week-over-week.

    Technical Analysis: Symmetrical Triangle Points to Potential Breakout

    Solana maintains a mixed near-term bias as the price moves toward the upper end of a symmetrical pattern on the daily chart. The token is supported by a rising trendline near $72.95, while the overhead trendline coincides with the 50-day Exponential Moving Average (EMA) at $76.07. The Relative Strength Index (RSI) at 43.69 suggests modest downside pressure, and the Moving Average Convergence Divergence (MACD) remains below its signal line, indicating that rallies may be vulnerable.

    On the upside, a sustained close above the overhead cluster near the 50-day EMA at around $76.09 could target $93.61. Immediate support lies near the rising trendline around $72.95. A daily close below this area would expose weakness toward $67.50.

    Frequently Asked Questions

    Why is Solana trading within a symmetrical triangle pattern?

    A symmetrical triangle reflects a period of consolidation where buyers and sellers are evenly matched. A breakout above the upper trendline or a breakdown below support could determine Solana’s next major price direction.

    What do the latest Solana ETF flows indicate?

    According to SoSoValue, U.S. spot Solana ETFs recorded $403,890 in net inflows on Thursday after mixed flows earlier in the week. This suggests institutional interest remains steady despite broader market volatility.

    What does the funding rate reveal about trader sentiment?

    According to CoinGlass, Solana’s funding rate increased to 0.0052% from 0.0041%, indicating that traders are increasingly willing to pay a premium to maintain long positions, reflecting improving bullish sentiment.

    How is Solana’s DeFi ecosystem performing?

    DeFi activity has cooled, with protocols such as PumpSwap, Raydium, and Orca reporting lower fee generation over recent weeks. However, projects like HumidiFi and BisonFi have bucked the trend with strong weekly fee growth.

    What are the key support and resistance levels for Solana?

    Immediate support lies near the rising trendline around $72.95. On the upside, the first major resistance is the 50-day EMA near $76.09. A breakout above this level could target $93.61, while a break below support may expose $67.50.

  • Apple Hits $5 Trillion Market Cap, Becoming Second Company to Reach the Milestone

    Apple Hits $5 Trillion Market Cap, Becoming Second Company to Reach the Milestone

    Apple has crossed the $5 trillion market value mark after a steady rise in its share price, becoming only the second company to reach the historic milestone. The iPhone maker’s market capitalization surged past the $5 trillion threshold, making it the world’s most valuable company, surpassing NVIDIA.

    The jump came after Apple’s shares rose 0.2 percent to $337.7, bringing its market capitalization to $4.96 trillion. With a session high of $342.89, Apple’s market value stood at $5.036 trillion. Including session gains, Apple stock has jumped 24% so far this year, outperforming the other six of the ‘Magnificent 7,’ which include Microsoft, Amazon, Alphabet, Meta Platforms, Tesla, and Nvidia.

    Apple is ready to report its third-quarter earnings after the market close on Thursday. Analysts expect the company will jump more than 15% from the previous year.

    Staying on top will be the real test. The Cupertino-based tech giant has struggled for years to build its own AI models. More recently, Google has used its technology to roll out new services, such as a revamped Siri, that have saved it from the massive infrastructure spending that tech investors so often fear. Dipanjan Chatterjee, vice president and principal analyst at Forrester, said, “Apple has resisted the AI spending race, betting that customer experience – not infrastructure investment – will ultimately determine the winners.”

  • Best Cryptocurrency Investments for July 2026: Top Coins by Market Cap

    Best Cryptocurrency Investments for July 2026: Top Coins by Market Cap

    As we move into July 2026, the cryptocurrency market continues to evolve, with established digital assets maintaining their dominance. Here’s a look at the largest coins by market cap that are leading the crypto world this month.

    Bitcoin (BTC)

    The world’s largest cryptocurrency continues to dominate as digital gold, offering a store of value and a hedge against inflation.

    Ethereum (ETH)

    The leading blockchain powering DeFi, NFTs, and thousands of decentralized applications remains a top investment choice.

    Tether (USDT)

    The most widely used stablecoin for trading and preserving value, providing liquidity and stability in volatile markets.

    XRP

    Designed for fast, low-cost international payments and financial institutions, XRP continues to gain traction in cross-border transactions.

    BNB

    Binance’s native token continues to power one of the world’s largest crypto ecosystems, offering utility across trading, DeFi, and more.

    Solana (SOL)

    Known for lightning-fast transactions and growing developer adoption, Solana is a strong contender for scalable blockchain solutions.

    Dogecoin (DOGE)

    The meme coin that remains popular thanks to its strong community support and increasing real-world use cases.

    Cardano (ADA)

    A research-driven blockchain focused on security, sustainability, and scalability, Cardano offers a methodical approach to development.

    These digital assets represent the top crypto investments for July 2026, each with unique strengths and growing ecosystems. For the latest news and updates, join our WhatsApp channel.

  • Top 8 Cryptocurrencies Over $10 Billion Market Cap in 2026: Performance and Adoption

    Top 8 Cryptocurrencies Over $10 Billion Market Cap in 2026: Performance and Adoption

    The cryptocurrency market continues to evolve, with large-cap assets maintaining their dominance through strong adoption and technological innovation. In 2026, several cryptocurrencies with market capitalizations exceeding $10 billion are leading the charge. Here’s a closer look at the best performers.

    Bitcoin (BTC)

    As the world’s largest cryptocurrency, Bitcoin remains the benchmark for long-term investors. Its established track record and institutional adoption solidify its position as a store of value.

    Ethereum (ETH)

    Ethereum dominates the decentralized finance (DeFi) and smart contract space. Continuous network upgrades, including scalability improvements, enhance its utility and developer appeal.

    Solana (SOL)

    Solana is known for lightning-fast transactions and a rapidly expanding developer ecosystem. Its high throughput and low fees make it a favorite for decentralized applications.

    XRP

    XRP continues to expand cross-border payment solutions, attracting growing institutional interest. Its focus on efficient global transactions keeps it relevant in the financial sector.

    BNB

    BNB powers one of the world’s largest blockchain ecosystems, the Binance platform. It offers multiple real-world utilities, including transaction fee discounts and participation in token sales.

    Dogecoin (DOGE)

    Dogecoin remains one of the most recognized community-driven digital assets. Its widespread acceptance and active community contribute to its enduring popularity.

    Cardano (ADA)

    Cardano focuses on research-driven blockchain innovation and sustainable scalability. Its peer-reviewed approach and commitment to interoperability set it apart.

    Chainlink (LINK)

    Chainlink provides secure blockchain oracles that connect smart contracts with real-world data. Its critical role in DeFi and enterprise solutions ensures continued demand.

    These large-cap cryptocurrencies are not only performing well but also driving the next wave of blockchain adoption. Investors and enthusiasts should keep an eye on their developments throughout 2026.

  • Hyperliquid HYPE Surpasses Dogecoin in Market Cap: Investors Shift Focus to Utility-Driven Cryptos

    Hyperliquid HYPE Surpasses Dogecoin in Market Cap: Investors Shift Focus to Utility-Driven Cryptos

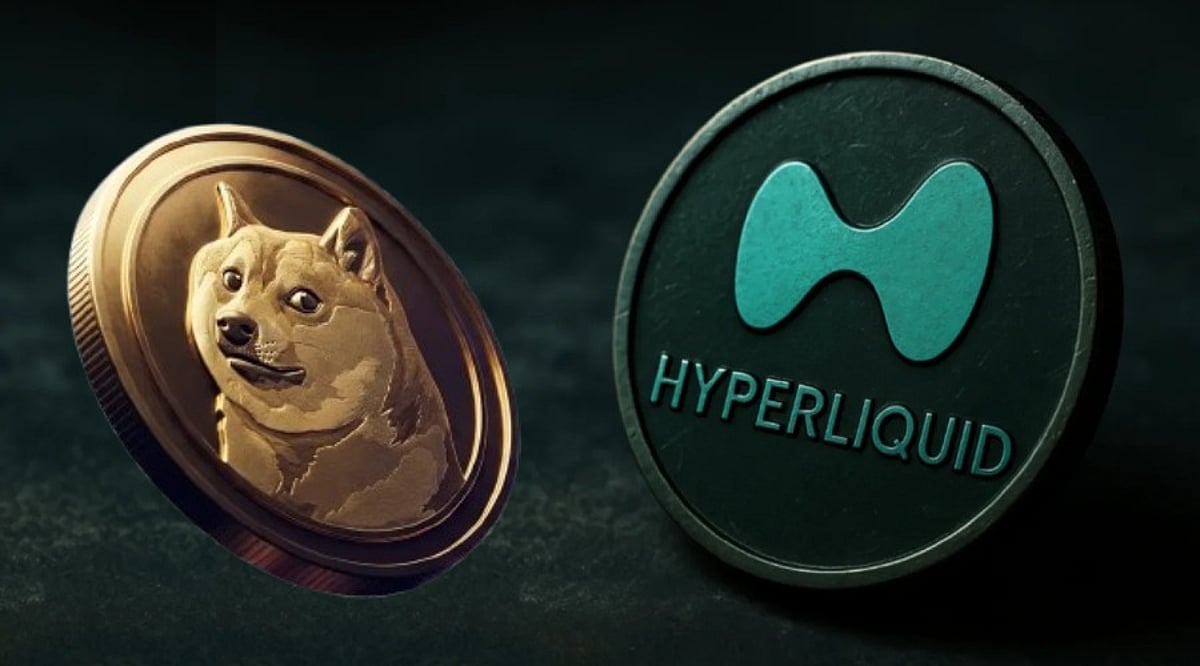
    Hyperliquid has achieved a significant milestone in the cryptocurrency market. Its native token, HYPE, has overtaken Dogecoin (DOGE) in market capitalization, entering the top 10 cryptocurrencies by market value. This development underscores a broader trend: investors are increasingly valuing projects with real revenue and strong fundamentals over those driven solely by community hype.

    According to recent data, Hyperliquid’s market cap stands at approximately $16 billion, slightly ahead of Dogecoin’s $15.9 billion. While the gap is narrow and rankings may fluctuate, the shift signals growing confidence in Hyperliquid’s business model.

    Strong Price Growth and Trading Activity

    HYPE has experienced remarkable price appreciation. Trading between $67 and $69, with an all-time high near $76.70, the token has surged over 1,600% from its lowest point. Daily trading volumes range from $480 million to over $1.1 billion, reflecting robust investor interest and liquidity.

    Revenue Generation Sets Hyperliquid Apart

    Unlike many cryptocurrencies that rely on market sentiment, Hyperliquid generates substantial revenue through its decentralized perpetual futures exchange. In the first quarter of 2026, the platform reported approximately $215 million in protocol revenue. The second quarter had already surpassed $104 million before its end, placing Hyperliquid among the top revenue-generating DeFi projects.

    This revenue stream provides a solid financial foundation, reducing dependence on speculative trading.

    Token Buybacks Create Sustained Demand

    A key feature of Hyperliquid is its token buyback mechanism. The platform allocates 99% of protocol fees (excluding certain builder and unit fees) to an Assistance Fund, which purchases HYPE tokens from the open market. This process creates consistent demand, directly linking platform success to token value—similar to corporate share buybacks.

    Institutional Interest Grows

    Traditional financial institutions are taking notice. The launch of the 21Shares Hyperliquid ETF (THYP) on Nasdaq and the Bitwise Hyperliquid ETF (BHYP) on the New York Stock Exchange has made HYPE accessible to a broader investor base. Some products also offer staking rewards, adding further appeal. Institutional support brings larger capital pools and enhances market confidence.

    Why Dogecoin Faces Challenges

    Dogecoin remains a well-known cryptocurrency with a loyal community and strong brand. However, it lacks protocol revenue, has an inflationary supply, and does not feature buybacks linking network activity to token demand. Its value largely depends on community support and market sentiment.

    In contrast, Hyperliquid combines exchange services, governance, staking, and the growing HyperEVM ecosystem, offering multiple reasons for investors to hold the token beyond speculation.

    Future Growth and Risks

    Hyperliquid continues to expand with developments like HyperEVM for decentralized applications, HIP-3 permissionless perpetual markets, and synthetic asset trading including pre-IPO contracts. These innovations could drive further network activity.

    However, risks remain. Future contributor token unlocks may increase circulating supply and cause selling pressure. Regulatory changes could impact decentralized derivatives platforms. Additionally, the current valuation relies on sustained trading activity and revenue growth; any slowdown could affect investor confidence.

    A New Direction for Crypto

    Hyperliquid’s ascent past Dogecoin is not a mere statistical anomaly. It represents a market shift toward projects with real revenue, active ecosystems, and long-term value propositions. While Dogecoin’s cultural impact is undeniable, HYPE’s rise suggests that utility-based cryptocurrencies may lead the next wave of digital asset development.

    FAQs

    1. Why did HYPE overtake Dogecoin? HYPE’s strong revenue generation, buyback mechanism, and growing ecosystem boosted investor confidence and market value.

    2. What makes Hyperliquid different from Dogecoin? Hyperliquid generates protocol revenue, supports staking, governance, and token buybacks, while Dogecoin primarily relies on community support and market sentiment.

    3. How do HYPE buybacks work? Most protocol fees are used to buy HYPE tokens from the open market, creating consistent demand.

    4. Why are institutions interested in Hyperliquid? The launch of HYPE-focused ETFs and the platform’s revenue-generating business model have attracted traditional investors.

    5. What risks should investors consider? Potential token unlocks, regulatory changes, and any decline in trading activity or protocol revenue could impact HYPE’s future performance.