Tag: Market sentiment

  • Bitcoin Surpasses $65,000 as ETF Inflows Surge and Market Sentiment Recovers

    Bitcoin Surpasses $65,000 as ETF Inflows Surge and Market Sentiment Recovers

    Bitcoin climbed above the key $65,000 resistance level on Wednesday as ETF inflows increased and market sentiment moved out of fear. BTC traded near $66,267, almost 15% above its lowest level this year. The move placed Bitcoin near its highest level since June 16. It also brought the $70,000 mark back into focus as the price approached the upper boundary of an ascending channel.

    ETF Inflows Support Bitcoin’s Recovery

    United States spot Bitcoin ETFs recorded $203 million in inflows on Tuesday. That marked the sixth consecutive day of net inflows across the funds. Over the six days, the ETFs attracted more than $928 million. Monthly inflows reached over $628 million and could exceed $1 billion if the current pace continues.

    The latest activity follows two difficult months for the products. The funds lost more than $4.5 billion last month and another $2.4 billion one month earlier. Demand also spread across several altcoin ETFs. Ethereum ETFs added more than $37 million on Tuesday, lifting their monthly total to $309 million.

    Meanwhile, XRP ETFs gained $12.3 million this month. Solana ETFs recorded about $13 million over the same period. Investors have returned after Bitcoin’s steep decline from its previous peak. At this year’s low, the cryptocurrency had fallen 55% from its October high.

    Fear and Greed Index Moves Toward Neutral

    The Crypto Fear and Greed Index rose from 17 to 40. That shift moved the market from extreme fear into neutral territory. The gauge tracks price momentum among the ten largest cryptocurrencies. It also measures implied volatility, put-and-call activity, and social media trends.

    Historically, Bitcoin has often recovered after the index entered extreme fear. It has also weakened when the gauge reached greed or extreme greed. Can Bitcoin maintain its rebound as sentiment improves and ETF demand continues?

    Several major institutions have issued bullish forecasts. Standard Chartered expects Bitcoin to reach $100,000, while Bernstein has set a $150,000 target. Strategy has also avoided further Bitcoin sales after selling more than $200 million earlier this month. The company has made no additional sales since then.

    Technical Pattern Puts $70,000 in Focus

    Bitcoin has moved higher within an ascending channel on the four-hour chart. The price now trades near the channel’s upper boundary. BTC also moved slightly above the 50-period exponential moving average. In addition, the chart formed an inverted head-and-shoulders-like pattern.

    That pattern often appears before further price gains. Still, recent market action shows that Bitcoin’s rebound has started to lose momentum. Further gains would require a clear move above the channel’s upper boundary. Such a breakout would place the psychological $70,000 level next on the chart.

    Conclusion

    Bitcoin’s move above $65,000 reflects renewed ETF demand, improving market sentiment, and stronger technical positioning. However, momentum remains near a key channel boundary, making $70,000 the next major test. Investors should monitor ETF flows and wait for a confirmed breakout before assessing further gains.

  • Bitcoin Dips Below $63,500 as Hyperliquid Plunges Ahead of Key CLARITY Act Hearing

    Bitcoin Dips Below $63,500 as Hyperliquid Plunges Ahead of Key CLARITY Act Hearing

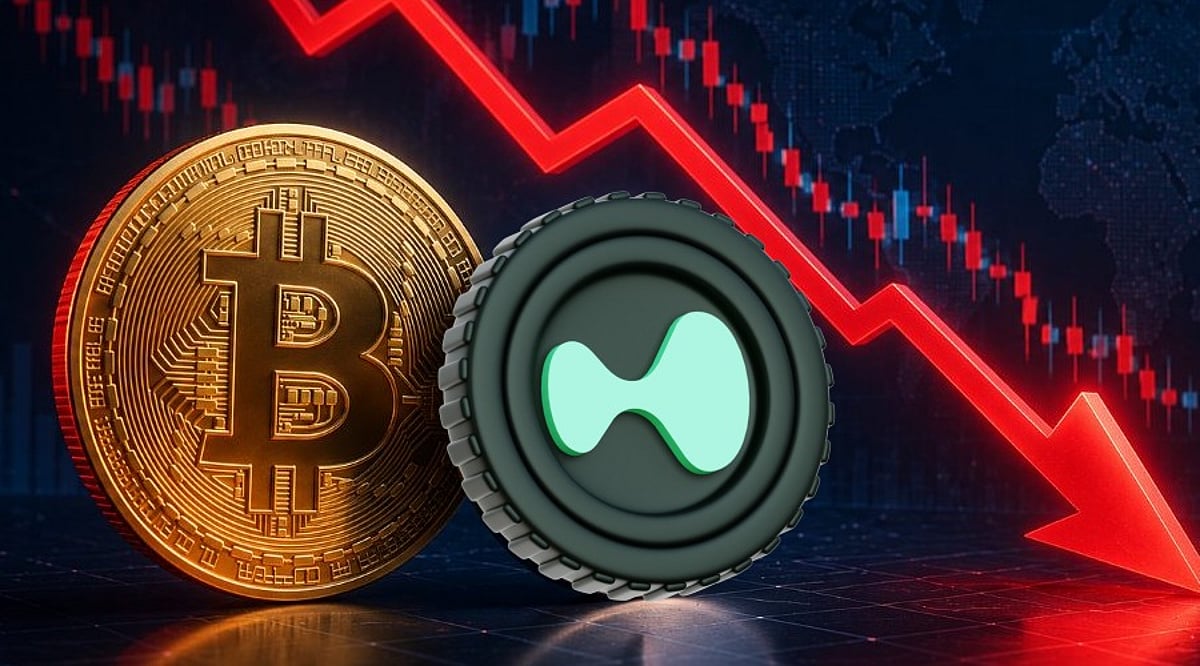
    Bitcoin slipped below $63,500 on Friday as a broader risk-off sentiment weighed on digital assets. The largest cryptocurrency traded near $63,437, down 1.72% in the past 24 hours, while Hyperliquid led losses with a sharp decline of over 9%. Traders are now focused on today’s CLARITY Act hearing before the House Financial Services Committee, which could shape digital asset regulation.

    Bitcoin Price Today

    Bitcoin is currently trading at $63,437.09, according to CoinMarketCap data. The $63,000 level remains key support, with a break below exposing $60,000. Resistance is seen at $65,000 to $67,000.

    Analyst Insights

    Akshat Siddhant, Lead Quant Analyst at Mudrex: Bitcoin pulled back from a three-week high, with on-chain data showing realized losses among long-term holders may have peaked. Spot Bitcoin ETFs logged nearly $290 million in net inflows over two sessions.

    Vikram Subburaj, CEO of Giottus: Bitcoin near $63,500, down 1.9%. Rising oil prices and US-Iran tensions outweighed softer inflation data. A $424.7 million ETF outflow on July 13 was followed by modest inflows.

    CoinSwitch Markets Desk: BTC remains range-bound as loss realization among one-to-two-year holders cools. Resistance near $67,000, with geopolitical uncertainty capping risk appetite.

    Nischal Shetty, founder of WazirX: Bitcoin near $63,352, with the Fear and Greed Index at 36. Immediate resistance at $64,500-$64,800, support near $62,800.

    Riya Sehgal, Research Analyst at Delta Exchange: Bitcoin’s rejection from $65,200-$65,500 signals weakening momentum. Next support at $61,800-$62,300 if $63,000 fails.

    Top 10 Coins at a Glance

    • Biggest Losers: Hyperliquid (HYPE) -9.53%, Ethereum (ETH) -3.59%, Dogecoin (DOGE) -2.1%
    • Relative Outperformers: USDC (stable), USDT (flat), TRON (TRX) -0.5%

    Key Market Drivers

    CLARITY Act Hearing

    The House Financial Services Committee meets today to discuss the Digital Asset Market CLARITY Act, which would classify Bitcoin, Ethereum, and XRP as commodities. Passage could remove regulatory overhang.

    Hyperliquid Decline

    Hyperliquid dropped over 9% amid profit-taking after a strong seven-day rally, with rising oil prices adding pressure.

    Bitcoin ETF Flows

    US spot Bitcoin ETFs recorded $107.8 million in net inflows on July 15, following a sharp $424.66 million outflow on July 13. BlackRock’s IBIT accounted for 75% of inflows.

    Whale Activity

    A dormant Bitcoin whale moved 5,908 BTC to a new wallet, not an exchange, signaling accumulation rather than selling intent.

    Oil Prices & Geopolitical Risk

    Brent crude climbed toward $85, reviving inflation concerns and weighing on risk assets. The Nasdaq and semiconductor stocks fell sharply, with crypto mirroring the risk-off tone.

    Investor Outlook

    Bitcoin holds near $63,437. A close above $65,000 could target $67,000, while a slip below $63,000 risks $60,000. Ethereum trades near $1,848, structurally constructive above $1,790 with resistance at $1,940. The CLARITY Act hearing is the key catalyst.

  • Bitcoin Slips Beneath $63,000: Can BTC Recover from $62,700 Support?

    Bitcoin Slips Beneath $63,000: Can BTC Recover from $62,700 Support?

    Bitcoin continues to face selling pressure, trading near $62,700 after losing key support levels. Technical indicators remain bearish, but the Relative Strength Index (RSI) has entered oversold territory, suggesting selling momentum may be exhausting. Investors are now watching crucial support levels, ETF flows, and macroeconomic events for direction.

    Current Market Overview

    As of July 17, 2026, Bitcoin is trading around $62,724, struggling to reclaim the $64,500–$65,000 resistance zone. The cryptocurrency has been confined to a narrow range of $62,500–$64,700, reflecting cautious market sentiment. Traders are weighing recent US inflation data, interest rate expectations, and global political uncertainties, which have kept buying activity limited.

    Bitcoin Chart Analysis

    The 15-minute BTC/USD chart reveals a bearish pattern with lower highs and lower lows, indicating persistent selling pressure. A brief push toward $64,800 earlier in the session was quickly reversed, and Bitcoin fell below the critical $63,000 level. Bollinger Bands continue to slope downward, with the price hugging the lower band—a sign that sellers remain in control. Any recovery would require a clear breakout above the bands’ midline.

    RSI Signals Oversold Conditions

    The RSI currently stands at 29.7, placing Bitcoin in the oversold zone (below 30). While this does not guarantee an immediate reversal, it often indicates that selling pressure is overextended. Traders typically look for the RSI to climb back above 40 or 50 alongside bullish price action before confirming a trend change. For now, a short-term bounce is possible if buyers step in.

    Key Price Levels to Watch

    • Support: $62,500 (critical), $62,200, $61,800. A break below these could open the door to $61,500–$61,000.
    • Resistance: $63,000 (immediate), $63,500, $64,000. A sustained move above $64,000 would signal renewed bullish momentum.

    Market Sentiment and External Factors

    Overall sentiment remains mixed. Recent US inflation data has eased fears of aggressive rate hikes, providing some support for risk assets like Bitcoin. However, global political tensions and lingering financial market uncertainty continue to cap gains. Institutional investors are closely monitoring Bitcoin ETF flows, central bank decisions, and upcoming economic reports. The $62,500–$63,000 zone is viewed as a key support range, while resistance lies between $65,300 and $65,750.

    Latest Bitcoin News

    Bitcoin has traded in a tight range over the past few sessions as investors balance positive inflation data with geopolitical concerns. Market experts remain divided—some see the current consolidation as a foundation for a recovery, while others anticipate another leg down before a stronger rally. ETF activity, US economic data, and Federal Reserve policy updates are expected to generate fresh volatility.

    Future Outlook

    Bitcoin remains under bearish pressure below key resistance. The oversold RSI suggests that buyers may attempt a comeback, but a decisive move above $62,500 is critical for a bullish reversal. If Bitcoin can hold this support and push above $64,000, it could trigger more aggressive buying. Conversely, a drop below $62,200 could lead to a decline toward the $61,500–$61,000 zone. The next few sessions will be pivotal.

    Frequently Asked Questions

    1. What is Bitcoin’s current price? Bitcoin trades near $62,724 at the time of this analysis.
    2. Why is Bitcoin falling? Weak market sentiment, profit-taking, and global economic uncertainty have kept sellers in control.
    3. Is Bitcoin oversold now? Yes, the RSI near 29.7 places Bitcoin in oversold territory.
    4. What are the important support and resistance levels? Support at $62,500, $62,200, $61,800; resistance at $63,000, $63,500, $64,000.
    5. What should traders watch next? Whether Bitcoin holds above $62,500, along with ETF flows, US economic data, and Federal Reserve policy updates.

    Disclaimer: This article is for informational purposes only and does not constitute financial advice. Cryptocurrency investments are risky. Always conduct your own research (DYOR) before making investment decisions.

  • Ethereum Rebounds on Double Bottom Pattern, Eyes $2,163 Target

    Ethereum Rebounds on Double Bottom Pattern, Eyes $2,163 Target

    Ethereum has staged a notable recovery, rebounding from a key support level and forming a bullish double bottom pattern on the daily chart. This technical setup, characterized by two consecutive lows around the same price zone followed by a breakout above the neckline, suggests that selling pressure has exhausted and buyers are gaining control. Analysts now see a clear path toward the $2,163 target, provided the momentum holds.

    At press time, ETH is trading near $1,920, up roughly 2.5% in the past 24 hours. The cryptocurrency maintains a market cap of about $232 billion, with 24-hour trading volume exceeding $12 billion, signaling renewed investor interest after a period of subdued activity.

    Double Bottom Pattern Signals Bullish Reversal

    The double bottom pattern formed after Ethereum tested the $1,850–$1,870 support zone twice. Both times, buyers stepped in to defend the level, creating a W-shaped structure. The pattern was confirmed when ETH broke above the neckline resistance, and the measured move target—derived from the distance between the support and the neckline—points to $2,163.

    Key Levels to Watch

    The first major hurdle is the psychological $2,000 mark. A sustained close above this level could accelerate buying and open the door to $2,163. Beyond that, the next resistance sits near $2,250, where previous selling pressure emerged. On the downside, support remains solid between $1,870 and $1,900. As long as ETH stays above this zone, the bullish structure remains intact.

    Institutional Demand and Network Fundamentals

    Institutional interest in Ethereum remains strong. Large investment firms continue to accumulate ETH, viewing it as more than just a digital asset—it powers thousands of decentralized applications. The growing amount of staked Ether also reduces circulating supply, providing a tailwind for prices when demand rises.

    Ethereum’s development roadmap includes upgrades planned through 2029 aimed at improving speed, security, and scalability. These enhancements reinforce long-term confidence among investors and maintain Ethereum’s dominant position in DeFi, stablecoins, and tokenized assets.

    Broader Market Sentiment Lifts Ethereum

    The overall cryptocurrency market has turned more positive. Bitcoin’s stability has allowed altcoins like Ethereum to rally. Improved economic conditions and reduced uncertainty have encouraged fresh capital inflows. This shift in sentiment, combined with technical strength, supports the case for continued upside.

    With the double bottom breakout confirmed, rising trading volumes, institutional backing, and ongoing network upgrades, Ethereum’s recovery appears well-supported. The $2,000 resistance is the immediate focus; a break above it could pave the way toward the $2,163 technical target.

  • XRP Sentiment Hits Five-Week High as Whales Accumulate and Institutional Interest Grows

    XRP Sentiment Hits Five-Week High as Whales Accumulate and Institutional Interest Grows

    XRP has seen a clear improvement in market sentiment, with trader confidence reaching its highest level in five weeks. After a long phase of slow price movement and cautious trading, many investors now expect the digital asset to recover. The latest market data shows that conversations around XRP have become much more positive, which has helped improve the overall mood across the crypto market.

    Better Market Mood Brings Fresh Hope

    The recent change in sentiment comes after XRP spent several weeks below its earlier highs. During that time, many traders waited on the sidelines as the market lacked strong momentum. Now, the situation has started to change as buying interest slowly returns.

    Many analysts believe that improving confidence could support a price recovery if the broader cryptocurrency market remains stable. A stronger market mood often attracts more buyers, especially when other important indicators also begin to improve.

    Institutional Interest Remains Strong

    Another reason behind the growing optimism is the continued interest from large financial players. Ripple’s payment network and blockchain services continue to attract attention from institutions that see long-term value in the ecosystem.

    Reports also show that investment products linked to XRP continue to receive fresh capital. This steady flow of money suggests that professional investors still view XRP as an asset with long-term potential, even after recent price weakness. Their confidence has helped support the market during periods of high volatility.

    Large Investors Continue to Accumulate XRP

    On-chain data also paints a positive picture. Large XRP holders, often called whales, have continued to add more tokens to their wallets during the recent market slowdown. The number of wallets that hold large amounts of XRP remains close to record levels.

    This trend is important since major investors usually make decisions based on long-term expectations rather than short-term price swings. Their continued accumulation suggests that they expect higher prices in the future instead of preparing to sell.

    Lower Exchange Supply Supports the Market

    Another encouraging signal comes from cryptocurrency exchanges. Recent data shows that fewer XRP tokens remain available on exchanges compared to earlier periods. This means more investors have moved their holdings into private wallets instead of keeping them ready for sale.

    A lower exchange balance can reduce selling pressure as fewer coins are immediately available for trading. If buying demand continues to grow while available supply remains lower, prices may receive additional support.

    Futures Market Shows Rising Confidence

    The derivatives market also reflects stronger interest in XRP. Futures trading volume has increased, while open interest has continued to move higher. Rising open interest means that new money has entered the market rather than existing traders simply closing and reopening positions.

    Technical Picture Begins to Improve

    Technical analysts have also noticed signs of strength. XRP has managed to hold several important support levels after weeks of sideways trading. Buyers have repeatedly stepped in whenever the price moved close to these areas.

    As long as these support zones remain intact, many analysts believe XRP has a better chance of testing higher resistance levels. A successful move above those barriers could attract additional buyers and increase upward momentum.

    Stronger Crypto Market Adds More Support

    The wider cryptocurrency market has also played an important role in improving XRP’s outlook. Bitcoin and Ethereum have both attracted fresh buying interest after earlier corrections. When the two largest cryptocurrencies perform well, investors often move part of their capital into large altcoins such as XRP.

    This rotation of funds has historically benefited XRP during previous market recoveries. If overall market confidence continues to improve, XRP could receive additional support from broader investor demand.

    Ripple Expands Its Ecosystem

    Ripple has also continued to strengthen its business outside of price action. The company recently joined projects that focus on open payment standards for artificial intelligence and digital payment systems. This step highlights Ripple’s effort to expand the real-world use of blockchain technology.

    Risks Still Remain

    Despite the stronger sentiment, risks have not disappeared. Cryptocurrency markets remain highly volatile and continue to react to global economic conditions, interest rate expectations and regulatory news.

    Market experts also warn that very high optimism can sometimes lead to short-term price corrections. When too many traders expect prices to rise, the market may pause before the next major move. For that reason, investors continue to watch trading volume, on-chain activity and institutional demand for confirmation that the recent optimism has solid support.

    Why This Matters

    Retail euphoria historically serves as a contrarian indicator; thus, the stark divergence between XRP’s five-week sentiment peak and its stagnant price action demands immediate caution, despite a 3.02 bullish ratio.

    Outlook Remains Positive

    Several indicators can influence XRP’s trajectory in the next few weeks. Some of the primary drivers of further progress include continued institutional inflows, a broader adoption of the technology, the formation of new payment partnerships and favorable regulatory updates. Simultaneously, higher levels of activity and a break above the critical resistance thresholds would strengthen arguments for a sustained rally.

    FAQs

    1. Why has XRP sentiment improved? Positive social media discussions, whale accumulation, and stronger market activity have boosted investor confidence.
    2. What does the 3.02 bullish-to-bearish ratio mean? It means there are about 3.02 positive comments for every negative comment about XRP on social media.
    3. Why are whale wallets important? Large investors often make long-term investment decisions, so their accumulation is viewed as a positive market signal.
    4. How do lower exchange balances affect XRP? Fewer coins on exchanges can reduce selling pressure if buying demand continues to increase.
    5. Can positive sentiment guarantee a price rally? No. Positive sentiment supports optimism, but price movements also depend on market conditions, trading volume, and broader economic factors.
  • Bitcoin Nears $65,000 Resistance After Rebounding to $64,900 – Key Levels to Watch

    Bitcoin Nears $65,000 Resistance After Rebounding to $64,900 – Key Levels to Watch

    Bitcoin has staged a strong recovery from the $64,500 support zone and is now trading around $64,870–$64,900. The cryptocurrency is once again testing the critical $65,000 resistance level, with bulls hoping to break through and open the door to further gains.

    Market Overview

    Bitcoin traded near $64,870 during the latest session, posting a modest gain after buyers stepped in near the $64,400–$64,500 area. The price recovered most of its earlier losses and now sits above several key moving averages, signaling renewed buying interest. The battle between sellers and buyers continues around $64,900, but the market tone has clearly improved.

    Technical Analysis

    The short-term chart looks promising for Bitcoin. The price has moved above its 20-day and 50-day moving averages, indicating buying dominance. Bitcoin also tested the 200-day moving average around $64,870, which acts as the most immediate resistance. A clean break above this level could trigger a push to $65,000 and beyond. However, failure to follow through might cause a brief consolidation.

    The Relative Strength Index (RSI) remains above 60, currently near 69, reflecting good market strength. This reading also suggests the rally has been rapid and the market may need time to absorb gains before continuing higher. Volume surged during the recovery, indicating strong conviction among traders.

    Key Price Levels

    • Immediate resistance: $64,900, followed by the psychological $65,000 level.
    • Upside targets: $65,200 and then $65,400 if $65,000 is breached.
    • Immediate support: $64,700, then $64,500 (the level where buyers previously stepped in).
    • Secondary support: $64,300.

    Market Sentiment

    Confidence has improved after Bitcoin recovered from earlier weakness. Buyers defended the $64,500 support and pushed the price back into a crucial resistance zone. The formation of higher lows suggests demand is strengthening. Still, a move above $64,900 is necessary to confirm a stronger rally. As long as Bitcoin holds above $64,500, the short-term outlook remains optimistic.

    Latest Bitcoin Market Data

    Bitcoin is trading around $64,850–$64,900. The total market capitalization stands near $1.3 trillion, with daily trading volume exceeding $27 billion. These figures indicate continued strong interest from traders and investors despite recent volatility.

    The broader cryptocurrency market also received support from softer-than-expected US inflation data, which eased fears of aggressive interest rate hikes. A weaker US dollar further bolstered demand for Bitcoin.

    Institutional Activity and Regulatory News

    Spot Bitcoin ETFs have recorded fresh net inflows after a period of withdrawals, signaling renewed institutional interest. Investors are also closely watching the progress of cryptocurrency regulation in the United States. Any advancements in regulatory clarity could significantly influence future institutional participation and the overall digital asset market.

    Price Outlook

    Bitcoin is at a critical juncture. The technical picture has improved, but the market needs a decisive close above $64,900–$65,000 to ignite the next rally. If buyers succeed, the price could target $65,200 and $65,400. If sellers defend the current resistance, Bitcoin may retreat to $64,700 or $64,500 before another attempt. The RSI near 69 suggests strong momentum but also hints at potential short-term profit-taking.

    Final Thoughts

    Bitcoin has staged a solid rebound from the day’s low, backed by increasing volume and a move above key moving averages. Buyers successfully defended the $64,500 support, which now acts as the short-term trend anchor. Breaking above $65,000 will be the next big test. A successful breakout would confirm bullish momentum, while a failure may lead to renewed testing of support levels in the coming sessions.

    Frequently Asked Questions

    1. What is Bitcoin’s current price?
    Bitcoin is trading around $64,850–$64,900.
    2. What is the next major resistance level?
    The immediate resistance is $64,900, followed by the key psychological level at $65,000.
    3. Where is the strongest support?
    The main support zone is around $64,500, with additional support near $64,300.
    4. Why did Bitcoin recover?
    The recovery was driven by strong buying near support, higher trading volume, ETF inflows, and improved market sentiment following softer US inflation data.
    5. What should traders watch next?
    Watch whether Bitcoin can close above $65,000. A successful breakout could push the price toward $65,200 and $65,400.
  • XRP Bullish Sentiment Surges as XRP Ledger Exceeds 8 Million Active Accounts

    XRP Bullish Sentiment Surges as XRP Ledger Exceeds 8 Million Active Accounts

    The XRP Ledger (XRPL) has achieved a significant milestone, surpassing 8 million activated accounts for the first time. This growth comes amid rising bullish sentiment, increased DeFi activity, and a notable shift in stablecoin liquidity toward alternative Layer-1 networks.

    Market Rotation Fuels Altcoin Interest

    Current market data indicates conditions typical of an altcoin season. While Bitcoin dominance has risen above 59% for three consecutive weeks, Ethereum dominance has also gained, lifting the ETH/BTC ratio by over 10% in the past three weeks. This suggests capital is rotating beyond Bitcoin, spreading to other major cryptocurrencies.

    According to AMBCrypto, fear of missing out (FOMO) surrounding XRP and Ethereum has reached its highest level in five weeks, while Bitcoin sentiment remains neutral. XRP currently leads Ethereum in bullish discussions, with a 3.02-to-1 bullish-to-bearish comment ratio compared to Ethereum’s 2.31-to-1.

    On-Chain Activity Strengthens

    The XRP/BTC ratio has been consolidating around the 0.000015 level for nearly 10 weeks, indicating potential long-term accumulation rather than short-term speculation. Meanwhile, on-chain metrics are improving. DeFiLlama data shows total value locked (TVL) on XRPL increased by over 3% in the last 24 hours, while stablecoin supply on the network grew by more than 6%, bringing nearly $1 billion back into the ecosystem.

    In contrast, over $2 billion in stablecoins left the Ethereum network during the same period, suggesting liquidity is shifting toward XRPL and other Layer-1 alternatives. If this trend continues, XRP could benefit from stronger network participation beyond mere sentiment.

    XRPL Crosses Historic User Milestone

    The XRP Ledger has officially exceeded 8 million activated accounts, reaching 8,000,688 wallets. According to XRPScan, these wallets collectively hold 67.526 billion XRP, representing the token’s circulating supply. Unlike previous reports that counted all ever-created wallets (including deleted ones), this milestone counts only activated accounts, marking the first official time the network has achieved this level of active participation.

    With improving DeFi metrics, growing stablecoin liquidity, and extended XRP/BTC consolidation, the network is drawing increased attention. Investors will watch closely to see if these fundamentals translate into sustained market strength.

  • Bitcoin Price at a Crossroads: Bullish Breakout or Bearish Breakdown Ahead?

    Bitcoin Price at a Crossroads: Bullish Breakout or Bearish Breakdown Ahead?

    Bitcoin is trading near $62,550 at a critical juncture, with market participants closely watching for the next major move. A decisive break above the $64,000–$65,000 resistance zone could propel prices toward $70,000–$71,000, while a drop below the $62,000 support level may trigger a decline to $58,000–$60,000 or even lower.

    Why This Price Zone Matters

    The current price range is one of the most important technical areas for Bitcoin. Buyers and sellers are both active near this level, making every price move significant. A strong support area often prevents deeper declines, while resistance levels slow or stop upward momentum. Bitcoin now stands between these two zones, and the next breakout or breakdown could determine the market’s direction for days or weeks ahead.

    The Bullish Scenario

    If Bitcoin holds above the $62,000–$63,000 support area, confidence could return to the market. The next major challenge sits between $64,000 and $65,000. A successful move above this range could attract fresh buying interest from institutional investors and improve overall sentiment. Strong inflows into Bitcoin exchange-traded funds (ETFs) and a favorable global economic environment—such as lower interest rate expectations—could further support this upward move. In this case, Bitcoin could first target $65,600, followed by the psychologically significant $70,000–$71,000 range.

    The Bearish Scenario

    If Bitcoin fails to maintain support at $62,000, selling pressure could intensify. A decisive close below this level might trigger a rapid decline. Additional bearish triggers include continued outflows from Bitcoin ETFs, a stronger US dollar, higher government bond yields, and renewed economic uncertainty. Should selling pressure increase, Bitcoin could fall toward the $58,000–$60,000 support zone. If that level breaks, the next target would be $55,000–$57,000, further delaying any bullish recovery.

    Key Price Levels to Watch

    • Current price: ~$62,550
    • Resistance: $64,000–$65,000, then $65,600 and $70,000–$71,000
    • Support: $62,000, then $58,000–$60,000 and $55,000–$57,000

    These levels serve as the main guide for traders as the market awaits its next major move.

    Market Sentiment Remains Mixed

    Investor sentiment is balanced. Some remain optimistic about a new bull run due to enduring long-term confidence in cryptocurrencies. Others are cautious, watching for clearer signals amid global economic uncertainty. This week’s trading shows Bitcoin remaining relatively stable despite ETF outflows, suggesting underlying demand remains intact.

    Final Outlook

    Bitcoin is at a pivotal moment. A breakout above $64,000–$65,000 could boost sentiment and lead to gains toward $65,600 and eventually $70,000–$71,000. Conversely, failure to hold $62,000 would likely intensify selling pressure, driving prices toward $58,000–$60,000 and possibly $55,000–$57,000. The coming sessions will reveal whether buyers regain control or sellers take over.

    Frequently Asked Questions

    1. What is Bitcoin’s current price?

    Bitcoin is trading around $62,550, reflecting ongoing market fluctuations influenced by investor sentiment, macroeconomic factors, institutional demand, and overall crypto market activity.

    2. What is the next resistance level for Bitcoin?

    Immediate resistance lies between $64,000 and $65,000. A breakout above this zone could signal strong bullish momentum and attract additional buying interest.

    3. What happens if Bitcoin breaks above $65,000?

    If Bitcoin convincingly breaks above $65,000, the next upside targets are around $65,600 and the psychologically important $70,000–$71,000 range. Strong trading volume would be needed to confirm the move.

    4. What happens if Bitcoin falls below $62,000?

    A drop below $62,000 would target the $58,000–$60,000 support zone. Further selling could push prices to $55,000–$57,000 before buyers potentially step in.

    5. Why is this price range important?

    This range represents a major technical decision point. A breakout above resistance could trigger a bullish trend, while a breakdown below support may lead to further losses, making this a crucial period for Bitcoin traders and investors.

  • Bitcoin Open Interest Surges to New Peaks as Bullish Sentiment Returns

    Bitcoin Open Interest Surges to New Peaks as Bullish Sentiment Returns

    Bitcoin continues to trade near the $64,000 mark, supported by elevated open interest and positive funding rates. Strong market participation and improving investor confidence are driving the recovery, with traders focused on key resistance and support levels.

    Key Takeaways

    • Strong market participation keeps Bitcoin open interest at elevated levels.
    • Positive funding rates reflect continued bullish sentiment among traders.
    • The $64,200–$64,500 resistance and $63,000 support remain crucial price levels.

    After a period of volatility, Bitcoin has entered a stronger trading phase. Over the past 24 hours, the world’s largest cryptocurrency has held close to the $64,000 level, boosting confidence across the crypto market. Over the last seven days, Bitcoin has gained roughly 6%, restoring optimism after heavy selling earlier. Market experts note that the steady rise is encouraging traders to return with fresh enthusiasm.

    The latest price action has attracted attention as Bitcoin successfully holds important support levels. Buyers are entering the market while selling pressure eases compared to recent weeks. This balance has created a healthier environment, giving investors more certainty about Bitcoin’s short-term trajectory.

    Open Interest Remains at Elevated Levels

    One of the clearest indicators of growing confidence is Bitcoin’s open interest — the total number of active futures and options contracts across exchanges. High open interest typically signals that more traders have entered the derivatives market, anticipating larger price moves. Current data shows open interest remains high, reflecting strong participation from both retail traders and institutional investors. While no trusted report has confirmed a new all-time high in the last 24 hours, the current figures still point to robust market activity. A high open interest often indicates fresh capital entering the market, supporting stronger trading volume and liquidity.

    Positive Funding Rates Support Bullish Sentiment

    Another key metric is funding rates. Over the past 24 hours, funding rates have stayed positive on major exchanges. This means traders holding long positions pay a small fee to those holding short positions — a pattern that emerges when the majority expects prices to rise. Analysts view this as a sign of improved confidence. However, they also caution that extremely high funding rates can suggest excessive optimism, which may increase the risk of a sudden correction.

    Price Levels Remain Important

    Bitcoin is currently trading near the resistance zone between $64,200 and $64,500. A breakout above this level could open the door to $66,000. On the other hand, the $63,000 level remains key support. Falling below that could trigger selling pressure and interrupt the recovery.

    Investor Confidence Continues to Improve

    Investor confidence has gradually returned as Bitcoin recovers from recent lows. The improvement isn’t solely price-driven — stable derivatives activity, positive funding rates, and stronger buying interest have all contributed. Market sentiment indicators have also improved, suggesting investors are more comfortable with Bitcoin’s current position and expect stability unless economic conditions shift sharply.

    High Open Interest Also Brings Risk

    While elevated open interest reflects confidence, it also carries risks. A large number of leveraged positions can increase volatility if prices move unexpectedly. Rising open interest alongside rising prices usually signals fresh capital and healthy growth. However, if prices fall while open interest remains high, leveraged traders may face forced liquidations, accelerating declines.

    Why This Matters

    This market behavior signals a healthy return of trader optimism and liquidity. The combination of elevated open interest and positive funding rates shows fresh capital actively entering the market, positioning Bitcoin for a potential breakout toward $66,000 if key support holds.

    Outlook Remains Positive

    Bitcoin has entered the week with momentum, trading above $64,000 with strong participation. Elevated open interest, positive funding rates, and improved sentiment point to growing confidence. While no credible news has confirmed a new all-time high for open interest in the last 24 hours, current derivatives activity suggests a healthy market. A breakout above $64,200–$64,500 could shift focus to $66,000, while holding above $63,000 would support further recovery.

    Frequently Asked Questions

    1. What is Bitcoin open interest? Bitcoin open interest is the total number of active futures and options contracts that remain open across crypto exchanges.
    2. Why does high open interest matter? High open interest usually shows greater market participation and often signals that traders expect larger price movements.
    3. What do positive funding rates indicate? Positive funding rates suggest that more traders expect Bitcoin prices to rise than fall.
    4. Which price levels are important now? The key resistance lies between $64,200 and $64,500, while $63,000 remains the major support level.
    5. Has Bitcoin reached a new all-time high in open interest? No trusted report published within the last 24 hours confirms a new all-time high, although open interest remains at elevated levels.
  • XRP Price Analysis: Will the $1 Support Level Hold or Break in 2026?

    XRP Price Analysis: Will the $1 Support Level Hold or Break in 2026?

    XRP has reached one of the most pivotal points of 2026. The $1 price level has become the main area that traders and investors now watch daily. This level has historically acted as strong support, with many buyers entering around this price. After several months of volatility, XRP now sits close to this critical mark. The coming weeks could determine whether the token begins a new recovery or suffers a deeper decline.

    As of early July 2026, XRP trades just above $1 after a nearly 20% drop during June. This decline occurred despite Ripple achieving several positive milestones this year. The broader cryptocurrency market remains cautious, with many investors shifting to safer assets, reducing demand for digital currencies.

    Why the $1 Support Level Matters

    The $1 level is more than a round number. It has become a strong psychological support area because buyers have stepped in near this price multiple times before. If XRP stays above $1, confidence could gradually return, potentially pushing the price toward $1.15 and then testing the $1.20 resistance.

    However, if XRP falls below $1 and closes there for several days, more selling may follow. Many traders place stop-loss orders near this support zone. Once triggered, the price could drop quickly, with the next major support near $0.80 becoming the likely target.

    Ripple Shows Strong Business Growth

    Despite XRP’s price struggles, Ripple has made solid progress in 2026. The company expanded its payment network and continued developing new products for banks and financial institutions. Activity on the XRP Ledger has increased significantly, with daily transactions now reaching nearly three million. More businesses use the network for tokenized real-world assets, automated market maker pools, and RLUSD settlements. Tokenized assets on the blockchain now represent hundreds of millions of dollars, demonstrating that Ripple continues to build useful services even when XRP’s price performance remains weak.

    XRP ETFs Bring Institutional Money

    One of the biggest developments for XRP came with the launch of spot XRP exchange-traded funds (ETFs) in late 2025. These products have attracted around $1.48 billion in total inflows, opening the door for more institutional investors to gain exposure to XRP without directly buying the cryptocurrency. This steady flow has supported market confidence for much of the year. However, recent sessions recorded the first notable outflows after months of steady demand, indicating that large investors have also become more cautious amid recent market weakness.

    Regulation Could Shape XRP’s Future

    Government rules remain a major factor affecting XRP. Investors closely watch new cryptocurrency laws in the United States. Clear regulations could make it easier for financial companies to invest in digital assets with greater confidence. Several proposals have raised hopes for better legal clarity during 2026, but delays in new legislation have tempered market excitement. Many experts believe stronger regulatory support could attract more institutional money into XRP, though market conditions and the overall economy will still play a major role in future price movements.

    Technical Charts Show Mixed Signals

    Technical indicators suggest selling pressure has started to ease. The Relative Strength Index (RSI) has recovered from oversold levels, often meaning sellers may lose strength after a sharp decline. Trading volume has also decreased during recent price drops, which can indicate fewer traders are willing to sell at current prices. However, XRP still trades below several important moving averages, so analysts have not confirmed a long-term bullish trend.

    The first resistance area stands between $1.08 and $1.10. If buyers push above this range, XRP may move toward $1.18 and then $1.20. A stronger rally could later send the token into the $1.30 to $1.45 range. Conversely, failure to defend $1 may increase selling pressure and pull the price closer to $0.80.

    The Overall Crypto Market Still Controls XRP

    Ripple’s business growth has improved during 2026, but XRP still follows the direction of the wider cryptocurrency market. Bitcoin and other major digital assets have faced heavy pressure as investors remain cautious about global economic conditions and interest rate expectations. This cautious mood has reduced the amount of money entering cryptocurrencies. Positive news about Ripple has helped support confidence but has not been strong enough to create a lasting rally. Many market experts believe XRP needs both stronger market sentiment and continued business growth before a major recovery becomes possible. Institutional demand through ETFs has provided some support, but that alone may not push prices much higher unless the overall crypto market also turns positive.

    Why This Matters

    XRP hovering near the $1 psychological threshold represents a make-or-break crossroads for 2026. While Ripple utility expands via three million daily ledger transactions and $1.48 billion in spot ETF inflows, broader macroeconomic risk aversion threatens a breakdown toward $0.80 if this pivotal support fails.

    Final Outlook for XRP in 2026

    The rest of 2026 could become one of the most important periods for XRP. The $1 support level now stands at the center of market attention. If buyers keep control of this area, XRP could slowly recover toward $1.20 and later move into the $1.30 to $1.45 range if the broader cryptocurrency market improves. A clear break below $1 would weaken the technical outlook and may open the door for a decline toward $0.80. Ripple continues to report strong business growth, higher network activity, and rising institutional interest through XRP ETFs. These positive developments support the long-term outlook. However, short-term price movement still depends on investor confidence and the direction of the overall cryptocurrency market.

    Frequently Asked Questions

    1. Why is the $1 price mark so critical for XRP right now?

    The $1 mark is a major psychological and technical support line. Holding above it keeps a recovery toward $1.20 alive, whereas closing underneath it risks triggering mass stop-loss selling orders.

    2. How have the newly launched spot XRP ETFs impacted the market?

    Spot ETFs have pulled in $1.48 billion in net inflows since late 2025. These investment funds provide solid underlying structural demand by giving large institutional investors direct exposure to XRP.

    3. Is Ripple’s real-world business adoption actually expanding?

    Yes. Independent of price, the XRP Ledger averages nearly three million daily transactions. This operational growth is driven by automated market maker pools, tokenized real-world assets, and RLUSD stablecoin settlements.

    4. What happens from a technical standpoint if the $1 support level breaks?

    Consecutive daily closes below $1 would invalidate the current market structure. This technical failure would give short-sellers total control, likely exposing the cryptocurrency to a deeper correction toward $0.80.

    5. What macro factors are keeping XRP from staging a major breakout?

    XRP remains tied to the broader crypto market. Digital assets face persistent selling pressure amid global economic uncertainty, and cautious interest rate expectations have reduced capital flowing into riskier assets.