

Tag: market structure

  • How to Read Market Footprints: Using Price Action, Volume, and Liquidity for Smarter Trades

    How to Read Market Footprints: Using Price Action, Volume, and Liquidity for Smarter Trades

    Financial markets rarely operate without leaving behind evidence. All breakouts, reversals, and trends start long before they become visible in the price action. Professional traders spend time studying the signs that precede a strong rally or sudden crash, while many retail traders only react to the results. These signals—known as market footprints—reveal the positions of other traders (buyers or sellers) and offer clues about where the price is likely to head next.

    Rather than trying to predict the future, market footprints help traders interpret probability by observing market activity.

    What Is a Market Footprint?

    Market footprints refer to the traces left by institutional and retail trading activity. They are not a single indicator but a broad set of factors that influence price action, trading volume, liquidity, market structure, volatility, and order flow. Individually weak, when combined they provide valuable insight into shifting market sentiment.

    For example, if a stock repeatedly tests a resistance level while volume increases, it may signal growing buying interest or accumulation. Conversely, a sudden liquidity sweep—where the price falls below support and then quickly rises—can indicate entry by larger market participants.

    Studies have found a relationship between trading volume and price volatility. According to a study published in the Journal of Financial and Quantitative Analysis, trading volume is one of the first indicators of changing market conditions, as unusual jumps in trades are typically followed by heightened price volatility.

    Why Professional Traders Watch Market Structure

    Experienced traders don’t chase the price after a breakout. Instead, they watch the market’s action just before the move. They ask questions such as:

    • Is trading volume confirming the price move?
    • Have prices moved from low highs to higher highs?
    • Are there any key support or resistance levels forming liquidity?
    • Is volatility picking up after consolidation?

    These questions help traders determine if a move is driven by genuine buying and selling interest or by short-term noise.

    Liquidity is also crucial. According to market structure research, liquidity isn’t only about trade volume—it also includes price impact, bid-ask spreads, and execution quality. In times of high volatility, understanding how liquidity dynamics shift is essential for accurate price interpretation.

    Why This Matters

    Understanding how the market leaves footprints helps traders avoid emotional decisions and adopt a more data-driven, evidence-based approach. By studying price action, volume, liquidity, and market structure together, traders can spot higher-probability trades, manage risk more effectively, and avoid chasing moves that have already played out.

    Final Thoughts

    There is no sure way to predict the next market move. However, by using multiple pieces of evidence, traders can make more informed decisions rather than relying on speculation. Markets rarely announce their intentions—they reveal them through participation, momentum, and liquidity changes. Learning to read these footprints allows traders to adopt a structured, data-driven approach to trading.

    Frequently Asked Questions

    1. What are market footprints in trading?

    Market footprints are subtle signals left by buying and selling activity before a major price move occurs. They include changes in price action, volume, liquidity, volatility, and market structure that help assess market sentiment.

    2. Why is trading volume important when analyzing markets?

    Trading volume shows the level of participation behind a price move. Rising volume often confirms the strength of a trend or breakout, while weak volume may indicate a move lacks conviction and could reverse.

    3. What is market structure, and why does it matter?

    Market structure refers to the sequence of higher highs, higher lows, lower highs, and lower lows on a price chart. It helps traders identify whether the market is in an uptrend, downtrend, or consolidation phase before making decisions.

    4. How does liquidity influence price movements?

    Liquidity determines how easily assets can be bought or sold without significantly affecting price. Areas with high liquidity often become important support or resistance zones where institutional traders may enter or exit positions.

    5. Can market footprints accurately predict future price movements?

    No. Market footprints do not predict the future with certainty. Instead, they help traders evaluate probabilities by combining multiple technical signals, enabling more informed and disciplined trading decisions while managing risk effectively.
  • How Crypto Derivatives Drove $20.57 Trillion in Trading Volume in Q1 2026

    How Crypto Derivatives Drove $20.57 Trillion in Trading Volume in Q1 2026

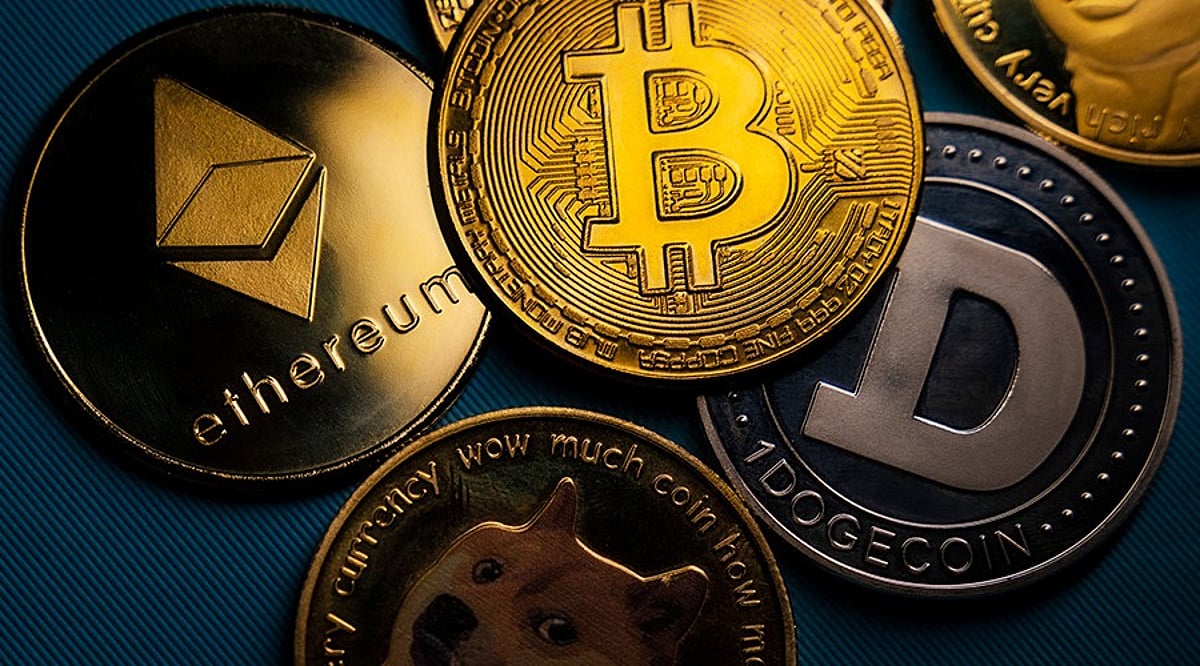
    Despite a 22.30% drop in the combined cryptocurrency market cap from $2.96 trillion to $2.3 trillion in the first quarter of 2026, trading activity surged to a staggering $20.57 trillion. This massive capital turnover was driven not by retail spot buying but by an institutional pivot toward derivatives, which now command nearly 90% of total volume. The market has shifted from simple accumulation to complex hedging, yield strategies, and professional risk management.

    The Institutional Pivot to Complex Instruments

    Capital behavior in early 2026 confirms that sophisticated counterparties dictate price discovery. Over-the-counter data from Wintermute shows options notional trading grew 3.8x, and trade counts expanded 2.1x compared to early 2025. These metrics point to a decisive move toward systematic yield generation and structured execution rather than simple directional spot bets. Demand for capital-efficient exposure also pushed the number of CFD underlying tokens from 15 to 46 over the past year, indicating institutions are diversifying beyond major assets into broader markets.

    Operating in this environment requires highly reliable infrastructure. Large-scale execution naturally filters out venues with thin order books, forcing market makers and asset managers to operate where execution certainty is guaranteed. “As trading activity normalized in Q1, market structure became clearer: derivatives continued to lead price discovery, while liquidity consolidated on platforms able to support scale,” notes Binance Co-CEO Richard Teng. “In a lower-volume environment, Binance’s consistent leadership across both spot and perpetual markets reflects the value users place on deep liquidity and reliable execution.”

    Absorbing the ETF and Treasury Inflows

    The influx of structured capital helps explain the persistent demand for derivative instruments. According to Grayscale, spot crypto exchange-traded products have recorded net inflows of $87 billion since January 2024. As traditional funds enter the digital asset space, authorized participants and market makers must immediately hedge their massive exposures to maintain delta-neutral positions. Spot markets simply cannot support this level of sustained institutional hedging. These entities rely heavily on deep perpetual futures markets to manage risk efficiently.

    CryptoQuant data demonstrates this imbalance clearly: perpetual futures generated $3.5 trillion in monthly volume by the end of Q1, entirely surpassing the $0.8 trillion processed in spot markets. Derivatives act as the primary sponge for these massive institutional flows. Market makers facilitating ETF transactions or managing corporate treasury allocations use perpetual swaps and options to lock in pricing and minimize volatility exposure. The underlying market structure has fundamentally adapted to support traditional financial mechanics, moving the core of crypto trading permanently into the derivatives sector.

    Centralization of the $4.5 Trillion Surge

    As overall activity pulled back, liquidity became distinctly concentrated. Total centralized exchange trading volume cooled 48% from its October 2025 peak, settling at $4.3 trillion in March 2026. Rather than fragmenting during this slowdown, institutional volume clustered on the most liquid venues to minimize counterparty risks. Reporting from CoinGlass confirms this structural consolidation: Binance captured 34.9% of the Top 10 derivatives volume, processing roughly $4.90 trillion for the quarter.

    Looking specifically at the perpetual futures sector, Binance leads with $1.4 trillion in monthly volume, effectively doubling the $0.7 trillion handled by OKX. This concentration culminated in Binance recording a cumulative 2026 perpetual volume of $4.5 trillion by the end of March. This market share distribution is a direct result of institutional demand for deep, slippage-free order books. High-frequency trading systems and advanced hedging strategies break down on platforms lacking sufficient depth. Asset managers and proprietary trading firms direct capital toward venues that can consistently support large-scale derivative execution without compromising entry and exit pricing.

    The Future of Market Mechanics

    The first quarter of 2026 indicates a paradigm shift. The historical four-year cycle driven by retail spot accumulation has been replaced by steady, derivative-heavy institutional volume. As exchange-traded funds, corporate treasuries, and hedge funds become prominent market participants, their operational requirements command how the entire industry functions daily. Trading volume now favors efficiency and depth over speculative retail momentum. Strict risk protocols demand robust platforms. As the ecosystem matures, venues offering the deepest liquidity across futures, options, and spot markets will command the space regardless of underlying price action. Liquidity naturally begets liquidity. The infrastructure that successfully absorbs this institutional complexity will remain the primary engine of cryptocurrency price discovery moving forward.