

Tag: moving averages

  • Bitcoin Technical Analysis Explained: How Traders Read Price, Momentum and Leverage

    Bitcoin Technical Analysis Explained: How Traders Read Price, Momentum and Leverage

    What Bitcoin technical analysis actually does

    Bitcoin technical analysis is a framework for reading market direction through price action, trading volume, momentum and historical patterns instead of corporate earnings or balance-sheet fundamentals. Because BTC has no cash flows to value, chart-based tools carry more weight than they do in equity markets.

    Traders use these tools to map trends, locate probable support and resistance zones, and gauge whether a move is backed by broad participation. The key caveat: indicators describe the market as it is right now. They do not forecast Bitcoin’s next price with certainty. Their value comes from stacking several signals together, reading them against the wider market backdrop, and applying strict risk control.

    Support and resistance: mapping where buyers and sellers showed up

    Support is a price band where buying has repeatedly absorbed selling. Resistance is the mirror image — a zone where sellers previously stepped in. These bands tend to form around prior swing highs and lows, heavy-volume trading areas, and the average cost basis of holders.

    Recent on-chain data offers a working example. Glassnode reported on September 23 that BTC had climbed above a large long-term-holder supply cluster near $84,000–$85,000. The next meaningful on-chain hurdle sat around the mean MVRV price, close to $96,700. Glassnode also flagged the $95,000–$97,000 band as significant, where options positioning and on-chain valuation metrics overlap.

    Treat these as zones, not precise reversal points. Price frequently overshoots or stalls just short of a level before reacting.

    Moving averages for trend direction

    Moving averages flatten out short-term noise so the underlying trend is easier to see. The 50-day MA is the standard gauge for medium-term momentum; the 200-day MA frames the longer-term picture.

    • Sustained trading above these lines suggests strengthening momentum.
    • Extended periods below them point to deteriorating conditions.
    • Crossovers between the short and long averages draw attention, but they generate plenty of false signals in choppy markets.

    Momentum: the Relative Strength Index

    The RSI scores the speed and size of recent price changes on a 0–100 scale. Readings above 70 are traditionally labeled overbought; readings below 30 are labeled oversold.

    Bitcoin is prone to staying overbought or oversold far longer than conventional thresholds imply, especially during powerful trends. That makes RSI far more useful as a confirmation tool — read alongside price structure and volume — than as a standalone buy or sell trigger.

    Volume as a participation check

    Volume reveals how much conviction sits behind a price move. During September’s recovery, BTC spot volume more than doubled from its August low. The pickup appeared across multiple exchanges, which points to broad market involvement rather than activity concentrated on a single venue.

    Derivatives: the leverage layer

    Futures and options now sit at the center of crypto technical analysis.

    • Open interest tracks outstanding derivative positions.
    • Funding rates hint at whether leveraged traders are leaning long or short.
    • Liquidations show where forced exits could amplify price swings.

    Glassnode reported in September that Bitcoin futures open interest stayed elevated, while options open interest stood near $41 billion. Together, these figures help traders judge how much leverage is embedded in the market and where volatility could spike.

    Why a multi-signal approach matters

    No single indicator tells the whole story. Combining support zones, moving averages, momentum, volume and derivatives gives a fuller read on market structure — enough to identify trend shifts, assess risk and sketch out plausible scenarios without pretending to predict the future.

    Risk management remains the non-negotiable piece. Position sizing and stop placement matter more than any signal, because technical analysis can be wrong for extended stretches.

    Frequently asked questions

    What is Bitcoin technical analysis?

    It is the study of historical price action, volume and market behavior to identify trends and potential trading levels. Unlike fundamental analysis, it focuses on market data rather than estimating Bitcoin’s intrinsic value.

    How do support and resistance work in BTC trading?

    Support is a zone where buying pressure has historically increased; resistance is where selling pressure has appeared. Traders derive them from prior highs and lows, high-volume areas and holder cost bases.

    Why are moving averages used?

    They smooth short-term volatility so broader trends are easier to read. The 50-day average reflects medium-term momentum, while the 200-day average captures longer-term direction.

    What does RSI tell Bitcoin traders?

    RSI measures the speed and magnitude of recent price moves. Above 70 is traditionally viewed as overbought and below 30 as oversold, though neither reading guarantees a reversal.

    Why do volume and derivatives matter?

    Volume shows how much participation supports a move. Futures and options data — open interest, funding rates and liquidations — reveal whether price action is driven by spot demand or leveraged positioning.

    Disclaimer: This article is for informational purposes only and does not constitute financial or investment advice. Cryptocurrency assets carry significant risk, including the potential loss of all invested capital. Always conduct your own research before investing.

  • Tesla (TSLA) Technical Analysis: Bearish Pressure Mounts as Stock Tests Critical $368 Support

    Tesla (TSLA) Technical Analysis: Bearish Pressure Mounts as Stock Tests Critical $368 Support

    Tesla (TSLA) continues to face significant selling pressure, with the stock trading near $369.56 and exhibiting a clear bearish trend on its 30-minute chart. A combination of weak moving averages, low Relative Strength Index (RSI), strong selling volume, and repeated lower highs suggests that downside momentum remains intact. The $368–370 zone now serves as a critical support area that bulls must defend to prevent further declines.

    Key Technical Takeaways

    • Tesla is forming consistent lower highs and lower lows, confirming a bearish trend.
    • The RSI is near 24.67, indicating weak momentum and an oversold condition.
    • Immediate support lies at $368–370, while resistance levels are at $376 and $386.

    Price Action Remains Weak

    On the 30-minute chart, Tesla’s price action shows a steady series of lower highs and lower lows. Every attempted recovery fails to surpass the previous high, allowing sellers to regain control quickly. This pattern keeps the stock under persistent downward pressure as the latest trading session concludes.

    Moving Averages Signal Continued Weakness

    The moving averages reinforce the bearish outlook. The stock consistently trades below both the short-term and long-term moving averages, with the shorter average positioned below the longer one—a classic bearish signal. Each minor rally stalls at these moving averages, which now act as resistance rather than support. Until TSLA closes decisively above these levels, the trend remains negative.

    Bollinger Bands Highlight Downside Volatility

    Bollinger Bands reveal heightened volatility during sharp price moves. Earlier sessions featured wide bands after large declines, followed by a period of contraction before another selling wave. The latest candles are hugging the lower Bollinger Band, confirming that sellers retain control. While price near the lower band can occasionally trigger a short-term bounce, strong bearish trends often keep the stock pinned near this zone for extended periods.

    Volume Confirms Bearish Dominance

    Volume analysis supports the bearish narrative. Large red candles appear with elevated trading volume during sharp declines, indicating strong seller participation. Although green candles appear intermittently, their associated volume is significantly lower than selling volume. As a result, each recovery attempt loses momentum quickly, and the stock fails to build any lasting rebound.

    RSI Signals Oversold but Not Reversal

    The RSI stands near 24.67, well below the neutral 50 level and close to the oversold threshold of 30. While an oversold reading can sometimes precede a short-term bounce, it does not confirm a trend reversal. A sustained recovery would require stronger price action, higher buying volume, and a move above key resistance levels.

    Price Structure Favors Sellers

    The chart shows multiple failed recovery attempts. After an initial drop, Tesla attempted to climb back toward $415–420 before sellers returned. Another rally near the middle of the chart also stalled below the prior high. This series of lower peaks confirms that bullish momentum continues to fade, with sellers defending each resistance zone effectively.

    Key Support and Resistance Levels

    • Support: $368–370 – The stock has found temporary stability here, but repeated tests weaken this level. A breakdown below this zone could trigger further downside.
    • Resistance 1: $376 – Near the short-term moving average.
    • Resistance 2: $386 – Where the longer-term moving average and previous price congestion converge.

    A strong close above both resistance levels would improve the technical outlook and could signal that buyers are regaining control.

    Overall Outlook

    The overall technical picture remains bearish. Lower highs, lower lows, weak moving averages, strong selling volume, and a low RSI all point to continued downside pressure. Tesla remains one of the most volatile large-cap technology stocks, and factors such as earnings reports, EV demand, market sentiment, economic data, and regulatory updates can rapidly shift price direction.

    For now, the chart continues to favor sellers. A more constructive outlook would require a sustained move above the key resistance levels, supported by higher buying volume and improving momentum. Until then, downside risk remains the dominant theme.

    Frequently Asked Questions

    1. What is the current trend for Tesla stock? Tesla remains in a bearish trend with consistent lower highs and lower lows.
    2. What does the RSI indicate? The RSI near 24.67 reflects weak momentum and an oversold condition.
    3. What is the nearest support level? The closest support zone is around $368–370.
    4. Which resistance levels are important? Immediate resistance is near $376, followed by stronger resistance around $386.
    5. What could improve Tesla’s technical outlook? A sustained move above key resistance levels with stronger buying volume could signal a positive trend change.
  • XRP Price Analysis: Crucial Support and Resistance Levels Traders Must Monitor

    XRP Price Analysis: Crucial Support and Resistance Levels Traders Must Monitor

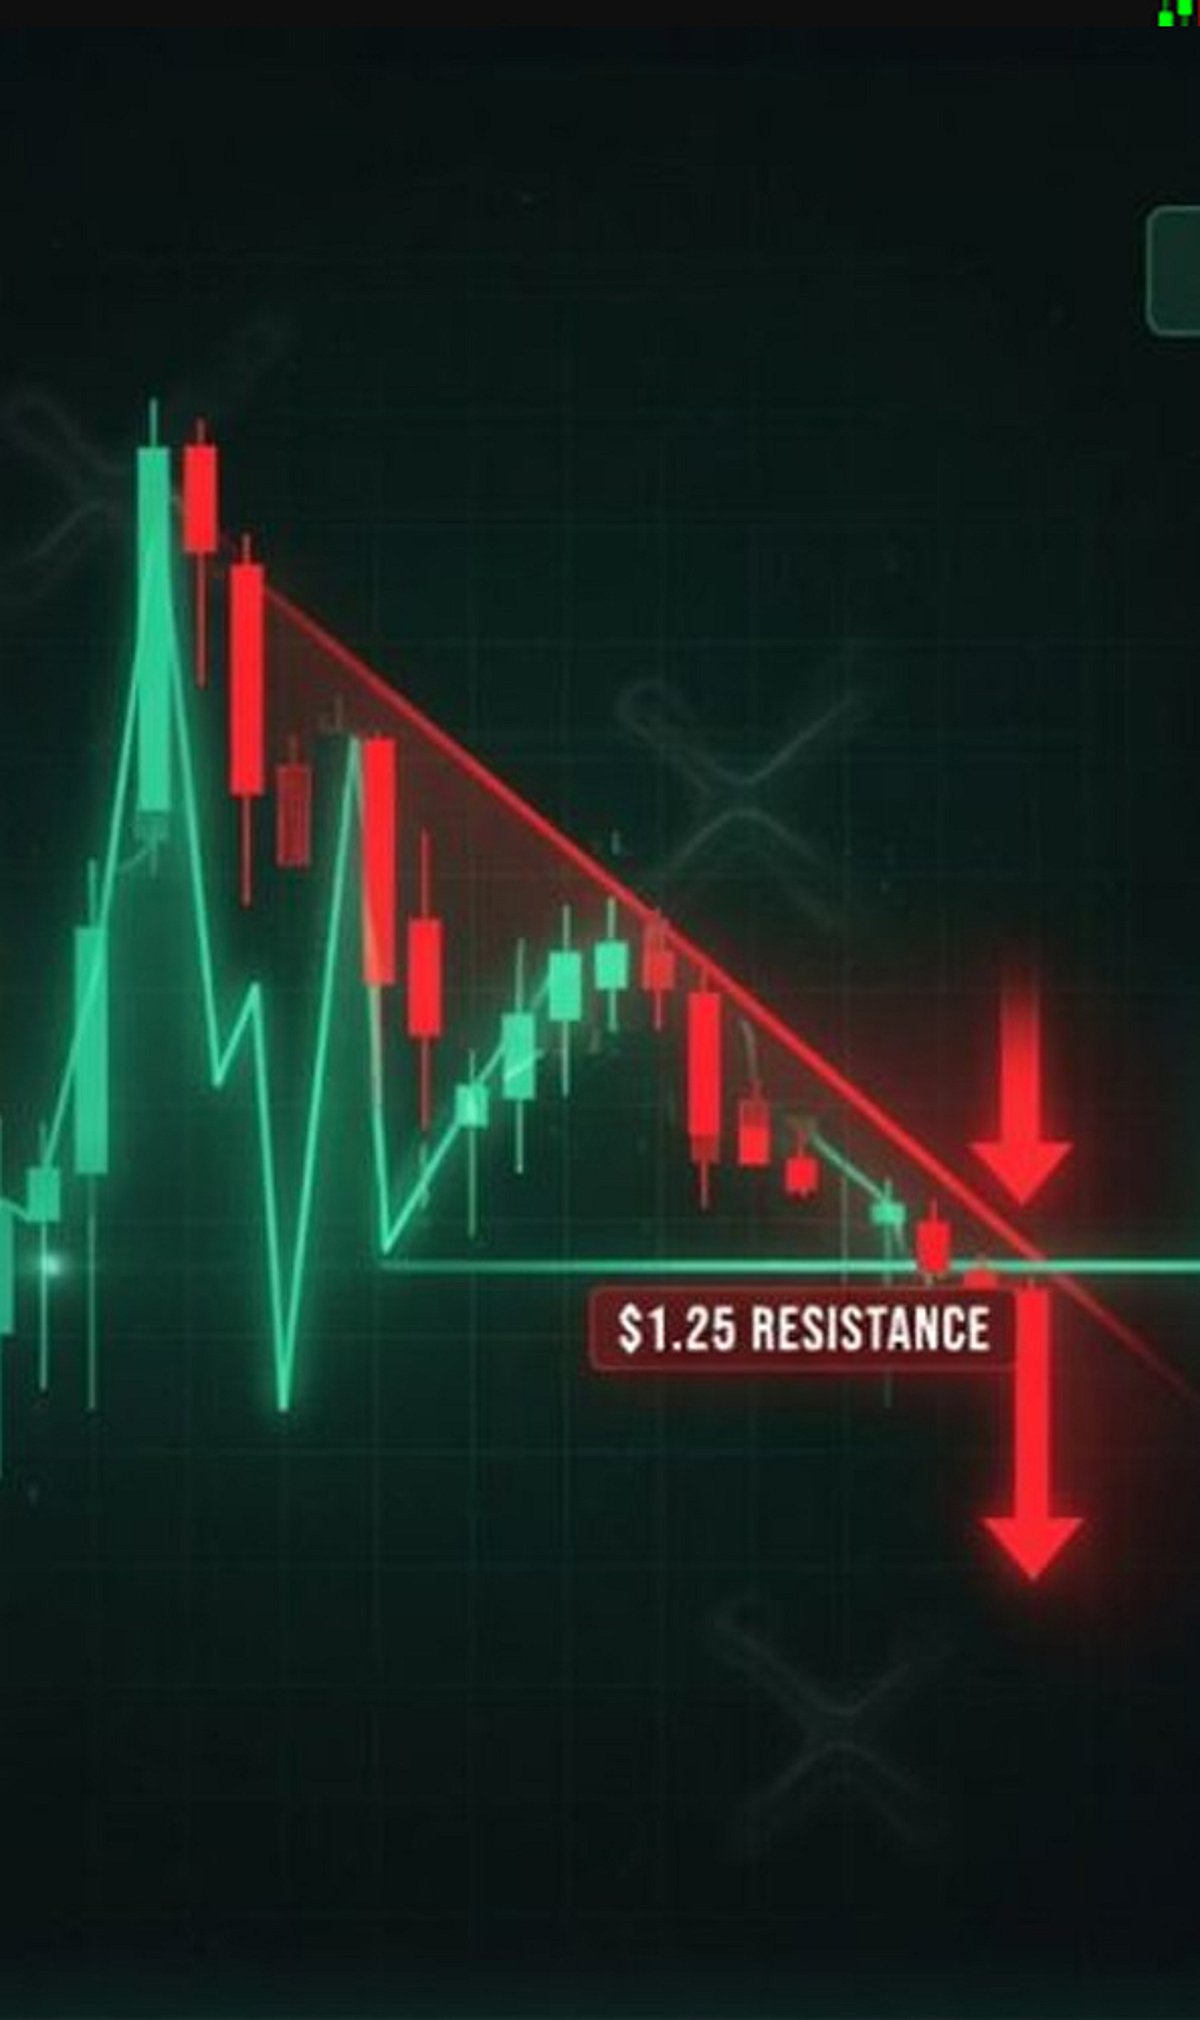
    XRP’s price action is approaching a critical juncture, with several technical and on-chain indicators offering clues about its next major move. Traders should keep a close watch on these key levels and signals to navigate potential volatility.

    Major Support Zone

    Strong buying interest has been observed near recent support levels, which may help prevent deeper declines. However, losing this zone could trigger increased selling pressure and heightened volatility.

    Key Resistance Level

    A decisive close above resistance, accompanied by rising trading volume, could confirm renewed bullish momentum and attract additional institutional and retail participation.

    Trading Volume

    Higher trading volumes during price moves typically validate breakouts, while weak volume often indicates false moves and short-lived momentum. Always confirm breakouts with volume.

    Moving Averages

    Watch the 50-day and 200-day moving averages closely. Crossovers often signal trend changes and provide important dynamic support or resistance levels.

    Relative Strength Index (RSI)

    The RSI helps identify overbought and oversold conditions, enabling traders to anticipate possible trend reversals or continuation before major price movements.

    Market Sentiment

    Regulatory developments, ETF expectations, and broader cryptocurrency sentiment significantly influence XRP’s price direction and short-term trading opportunities.

    Whale Activity

    Large wallet transactions and exchange inflows often precede significant price swings, making on-chain monitoring essential for active XRP traders.

    Bitcoin Correlation

    XRP frequently follows Bitcoin’s broader market trend. Strong Bitcoin rallies or corrections can quickly impact XRP’s momentum and investor confidence.

    Breakout Confirmation

    Traders should wait for sustained price action above resistance or below support, supported by strong volume, before confirming a new trend.