Tag: price analysis

  • XRP Price Today: Breakout Setup Strengthens as SEC and CFTC Classify It as a Digital Commodity

    XRP Price Today: Breakout Setup Strengthens as SEC and CFTC Classify It as a Digital Commodity

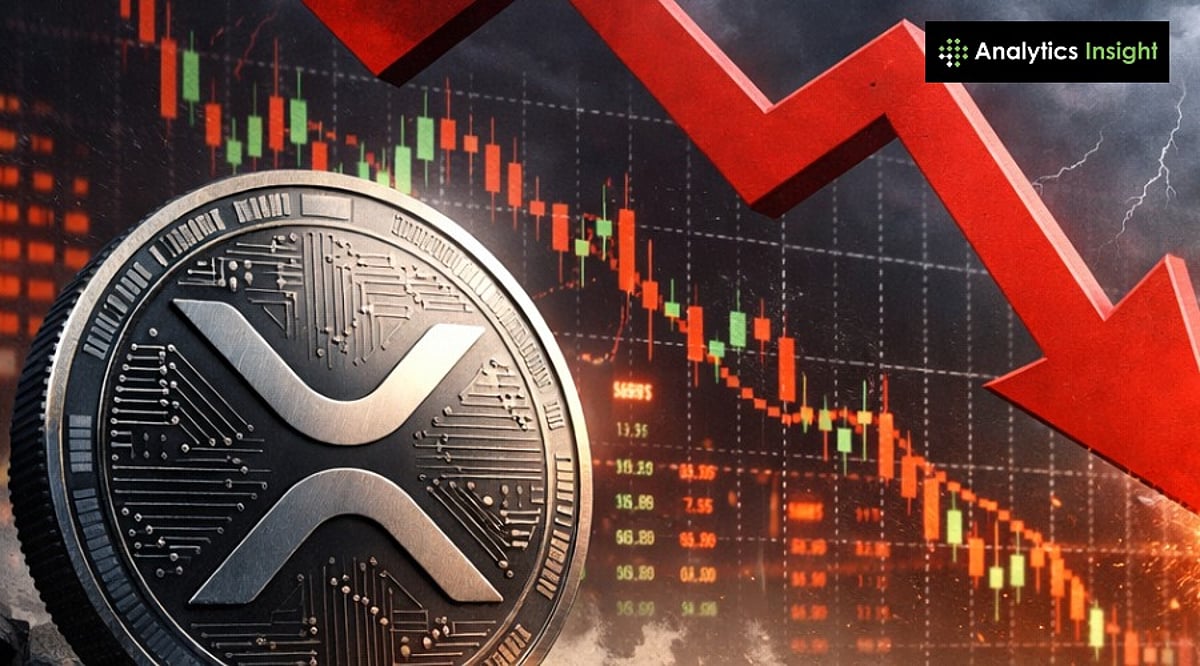
    XRP traded near $1.08 after a difficult first half of 2026, while technical indicators pointed to a possible breakout and U.S. regulators formally classified the token as a digital commodity. The token lost 27.1% in the first quarter and another 22.4% in the second quarter, yet analysts now identify a rare alignment of chart signals and seasonal trends that could support a recovery. At the same time, a joint SEC-CFTC interpretive release removed long-running uncertainty over XRP’s status under U.S. law.

    Technical Setup Points to a Breakout Attempt

    On the daily TradingView chart, XRP remains inside a descending broadening wedge. Traders often view that pattern as a late-stage accumulation formation. The Relative Strength Index has also formed a bullish divergence. Meanwhile, buyers continue to defend the local bottom near $1.05.

    Historical data from CryptoRank shows that XRP has not posted a negative third-quarter close in the past seven years. July has gained 4.19% so far, and previous summer reversals produced sharp rebounds after weak June performance. In July 2023, XRP rallied 47.6% after an early-summer decline. Likewise, a similar reversal in July 2025 produced a 35% return.

    To confirm a breakout from the wedge, buyers must push the price above the $1.12-$1.18 resistance zone. A successful move could open a path toward medium-term targets between $1.45 and $1.60, representing a projected upside of about 50%.

    Nevertheless, broader market weakness and slower inflows into U.S. spot XRP ETFs could limit short-term gains. Even so, the current consolidation continues to build a base ahead of the next directional move.

    The SEC and CFTC Formally Classify XRP as a Commodity

    On March 17, 2026, the Securities and Exchange Commission and the Commodity Futures Trading Commission published a joint interpretive release that named XRP as a digital commodity. The agencies issued the document under Release Numbers 33-11412 and 34-105020.

    The 68-page release divides crypto assets into five categories: digital commodities, digital collectibles, digital tools, payment stablecoins, and digital securities. Only digital securities fall fully under SEC jurisdiction, while the CFTC oversees digital commodities.

    The release also listed Bitcoin, Ether, Solana, Dogecoin, Cardano, Avalanche, Chainlink, Polkadot, Hedera, Litecoin, Bitcoin Cash, Shiba Inu, Stellar, Tezos, and Aptos in the digital commodity category. Reports counted either 16 or 18 named assets, depending on how examples in the document were interpreted.

    According to the release, a digital commodity derives its value from the programmatic operation of a functional crypto system and from supply and demand dynamics rather than from expectations tied to managerial efforts. The agencies applied that standard to XRP since the XRP Ledger operates independently of Ripple’s managerial control.

    Read More: XRP Slips to $1.10 Despite XRPL Crossing 8 Million Accounts

    A Broader Policy Shift Takes Shape

    The release also addressed when a non-security crypto asset may become part of an investment contract and when that status may end. In addition, it discussed airdrops, protocol mining, protocol staking, and wrapped versions of non-security assets.

    The guidance followed the SEC’s creation of the Crypto Task Force in January 2025 and the launch of Project Crypto as a joint SEC-CFTC initiative in January 2026. The agencies also announced a memorandum of understanding shortly before issuing the release.

    SEC Chair Atkins stated at the DC Blockchain Summit that the agency is not the ‘securities and everything commission anymore.’ CFTC Chair Selig said the wait was over and pledged to establish rules that would allow the crypto industry to operate onshore.

    What’s Next?

    XRP continues to trade within a key technical pattern as buyers target a breakout above the $1.12–$1.18 resistance zone. At the same time, the SEC and CFTC have officially classified XRP as a digital commodity, removing a major regulatory uncertainty while market participants watch for the next price move.

    Join our WhatsApp Channel to get the latest news, exclusives and videos on WhatsApp
  • Bitcoin Dips Below $63,500 as Hyperliquid Plunges Ahead of Key CLARITY Act Hearing

    Bitcoin Dips Below $63,500 as Hyperliquid Plunges Ahead of Key CLARITY Act Hearing

    Bitcoin slipped below $63,500 on Friday as a broader risk-off sentiment weighed on digital assets. The largest cryptocurrency traded near $63,437, down 1.72% in the past 24 hours, while Hyperliquid led losses with a sharp decline of over 9%. Traders are now focused on today’s CLARITY Act hearing before the House Financial Services Committee, which could shape digital asset regulation.

    Bitcoin Price Today

    Bitcoin is currently trading at $63,437.09, according to CoinMarketCap data. The $63,000 level remains key support, with a break below exposing $60,000. Resistance is seen at $65,000 to $67,000.

    Analyst Insights

    Akshat Siddhant, Lead Quant Analyst at Mudrex: Bitcoin pulled back from a three-week high, with on-chain data showing realized losses among long-term holders may have peaked. Spot Bitcoin ETFs logged nearly $290 million in net inflows over two sessions.

    Vikram Subburaj, CEO of Giottus: Bitcoin near $63,500, down 1.9%. Rising oil prices and US-Iran tensions outweighed softer inflation data. A $424.7 million ETF outflow on July 13 was followed by modest inflows.

    CoinSwitch Markets Desk: BTC remains range-bound as loss realization among one-to-two-year holders cools. Resistance near $67,000, with geopolitical uncertainty capping risk appetite.

    Nischal Shetty, founder of WazirX: Bitcoin near $63,352, with the Fear and Greed Index at 36. Immediate resistance at $64,500-$64,800, support near $62,800.

    Riya Sehgal, Research Analyst at Delta Exchange: Bitcoin’s rejection from $65,200-$65,500 signals weakening momentum. Next support at $61,800-$62,300 if $63,000 fails.

    Top 10 Coins at a Glance

    • Biggest Losers: Hyperliquid (HYPE) -9.53%, Ethereum (ETH) -3.59%, Dogecoin (DOGE) -2.1%
    • Relative Outperformers: USDC (stable), USDT (flat), TRON (TRX) -0.5%

    Key Market Drivers

    CLARITY Act Hearing

    The House Financial Services Committee meets today to discuss the Digital Asset Market CLARITY Act, which would classify Bitcoin, Ethereum, and XRP as commodities. Passage could remove regulatory overhang.

    Hyperliquid Decline

    Hyperliquid dropped over 9% amid profit-taking after a strong seven-day rally, with rising oil prices adding pressure.

    Bitcoin ETF Flows

    US spot Bitcoin ETFs recorded $107.8 million in net inflows on July 15, following a sharp $424.66 million outflow on July 13. BlackRock’s IBIT accounted for 75% of inflows.

    Whale Activity

    A dormant Bitcoin whale moved 5,908 BTC to a new wallet, not an exchange, signaling accumulation rather than selling intent.

    Oil Prices & Geopolitical Risk

    Brent crude climbed toward $85, reviving inflation concerns and weighing on risk assets. The Nasdaq and semiconductor stocks fell sharply, with crypto mirroring the risk-off tone.

    Investor Outlook

    Bitcoin holds near $63,437. A close above $65,000 could target $67,000, while a slip below $63,000 risks $60,000. Ethereum trades near $1,848, structurally constructive above $1,790 with resistance at $1,940. The CLARITY Act hearing is the key catalyst.

  • XRP Price Analysis: Can Ripple Recover Amid Slowing Whale Activity and ETF Demand?

    XRP Price Analysis: Can Ripple Recover Amid Slowing Whale Activity and ETF Demand?

    XRP is trading near $1.09 as whale activity and ETF demand weaken, leaving investors questioning its next move. The cryptocurrency has dropped about 2% in the last 24 hours, with daily trading volume above $1.1 billion and a total market value close to $68 billion. Despite the decline, XRP remains the sixth-largest cryptocurrency by market capitalization.

    Large investors, known as whales, have historically played a major role in XRP price movements. However, recent blockchain data shows Binance whale withdrawals have dropped to around 885 million XRP, the lowest level in over two months. This suggests major holders are becoming more cautious. Additionally, large XRP transactions have become less common, coinciding with weaker institutional interest. While this does not guarantee a sharp decline, it removes a key source of buying support.

    Exchange-traded funds (ETFs) have been a major topic in the crypto market, but recent figures show XRP investment products recorded about $7.18 million in net outflows. This marks a shift from stronger inflows earlier in the year, reflecting a cautious mood across the wider market. Many investors are waiting for better conditions before committing new capital.

    Technically, XRP is near a crucial support zone between $1.08 and $1.10. Buyers have defended this range multiple times in recent months. If XRP stays above this level, a recovery could target $1.20, then $1.35, and potentially $1.50. On the downside, $1.00 remains the key support; a break below could increase selling pressure.

    Despite market weakness, Ripple continues to expand its global payment network and develop the XRP Ledger. Recent projects focus on tokenized assets, decentralized finance, stablecoins, and business solutions. Regulatory approvals in Europe could accelerate adoption among banks and financial institutions.

    Market sentiment around XRP is mixed. Some investors are optimistic about Ripple’s business growth, while others remain cautious due to slowing whale activity and ETF demand. The broader crypto market also influences XRP, with Bitcoin and other major assets often setting the direction.

    For XRP to recover, several conditions need to improve: a return of strong whale buying, better ETF inflows, and clearer regulatory frameworks. The next few weeks will be critical. If the $1.08–$1.10 support holds, a move toward $1.20 is possible. If it breaks, sellers may gain control.

    Key Takeaways:

    • XRP holds a crucial support zone between $1.08 and $1.10 despite recent selling pressure.
    • Whale activity and ETF inflows have slowed, reducing short-term bullish momentum.
    • Ripple continues to expand its payment network and XRP Ledger, supporting long-term growth.

    FAQs

    1. What is XRP’s current price?
    The token trades near $1.09. It remains the sixth largest cryptocurrency by market capitalization despite a 2% decline over the last 24 hours.

    2. Why has XRP come under pressure?
    Reduced whale activity and a drop in large transactions have weakened buyer support. Additionally, institutional investors have pulled money out, leading to $7.18 million in net ETF outflows.

    3. What is the key support level for XRP?
    The immediate support zone lies between $1.08 and $1.10. If sellers break this range, the next vital psychological and technical floor to watch rests at $1.00.

    4. Can XRP recover in the coming weeks?
    A recovery remains entirely possible. However, the market first needs to see a return of aggressive whale buying, positive institutional ETF inflows, and improved momentum across the broader cryptocurrency landscape.

    5. What could drive XRP higher?
    Future gains depend on renewed whale accumulation and stronger institutional investment. Long-term growth could also be triggered by clearer global regulations and the ongoing expansion of Ripple’s cross-border network.

  • Bitcoin Surges Past $64,000 as US Inflation Records Sharpest Decline in Six Years

    Bitcoin Surges Past $64,000 as US Inflation Records Sharpest Decline in Six Years

    Bitcoin climbed above $64,000 after U.S. inflation recorded its biggest slowdown in six years. Lower inflation boosted market confidence, supported institutional demand, and improved expectations for future Federal Reserve rate decisions.

    Key Takeaways

    • Bitcoin traded near $64,700 with a market value above $1.29 trillion.
    • Slower U.S. inflation increased hopes for lower interest rates and stronger crypto demand.
    • Analysts identified $62,000–$63,000 as support and $65,500 as the next resistance level.

    Bitcoin returned above the $64,000 level after fresh inflation data from the United States lifted confidence across global financial markets. The new report showed the biggest slowdown in U.S. inflation in six years. That raised hopes the Fed can ease sooner. Risk assets including crypto moved higher in response.

    At the latest update, Bitcoin traded between $64,500 and $64,900. Market cap sits at around $1.29 trillion. 24-hour volume is above $27 billion.

    US Inflation Data Gives Markets Fresh Hope

    The latest inflation numbers became the biggest reason behind Bitcoin’s rally. Consumer prices in the United States showed the sharpest slowdown since 2020. This report eased concerns that inflation could stay high for a long period.

    Lower inflation often creates a better environment for financial markets. When price pressure falls, central banks usually face less pressure to raise interest rates. Investors then become more willing to buy assets that offer higher returns, including cryptocurrencies. That shift in market mood helped Bitcoin recover above the important $64,000 level.

    Federal Reserve Expectations Support Crypto

    The inflation report shifted views on U.S. Federal Reserve policy. According to analysts, many traders now expect the Federal Reserve to begin cutting interest rates sooner than previously anticipated if inflation continues to cool.

    Lower interest rates generally encourage borrowing and investment, which can support risk assets such as cryptocurrencies. The latter included Bitcoin, which welcomed new investors and buyers after being shunned for weeks.

    Weaker Dollar Adds More Strength

    The U.S. dollar also lost some strength after the inflation report. A weaker dollar often makes alternative investments more attractive for global investors. Bitcoin has frequently performed well during periods when the dollar weakens and bond yields move lower.

    This combination created another positive signal for the cryptocurrency market. Investors looked at Bitcoin as an asset with long-term value while economic conditions showed signs of improvement.

    Strong Institutional Demand Remains

    Large financial institutions continued to support Bitcoin despite recent market swings. Asset managers, hedge funds, and long-term investors kept their interest in the digital asset. Their steady participation helped reduce selling pressure and added stability to the market.

    Spot Bitcoin investment products also attracted fresh money from investors. These products made it easier for traditional investors to gain exposure to Bitcoin without directly holding the cryptocurrency. This steady demand continued to support prices during the latest rally.

    Ethereum and Other Cryptocurrencies Move Higher

    Bitcoin’s rise also lifted the wider cryptocurrency market. Ethereum and several major altcoins recorded gains after the inflation report improved investor confidence.

    The positive move showed that market sentiment improved across the digital asset sector instead of only Bitcoin. Many investors increased their exposure to cryptocurrencies as economic conditions became more favorable.

    Important Price Levels to Watch

    Cryptocurrency analysts identify Bitcoin’s current support zone between $62,000 and $63,000. While the asset is holding above these values, active buyers will stay in the market. The next major resistance level is around $65,500.

    With a breakthrough above this level, the buying impulse could pick up, leading to a repeat of the price growth. If the coin falls below $64,000, profit-taking after the latest price hike may be observed on the part of some market participants.

    Economic Data Will Remain the Main Driver

    Although the latest inflation report helped Bitcoin, several economic events could influence prices in the coming weeks. Investors will closely watch future inflation reports, employment figures, Federal Reserve meetings, and other important economic releases.

    Any sign that inflation starts to rise again could increase expectations for higher interest rates. That situation may create fresh volatility in both cryptocurrency and stock markets.

    Bitcoin Supply Continues to Support Long-Term Value

    Bitcoin’s limited supply remains one of its strongest advantages. More than 20 million BTC have already entered circulation, while the maximum supply will never exceed 21 million coins.

    This fixed supply creates scarcity, which many investors see as an important reason behind Bitcoin’s long-term value. As demand grows while supply stays limited, many market participants believe this feature could continue to support prices over time.

    Why this Matters

    Bitcoin reclaiming $64,000 on the sharpest inflation drop since 2020 confirms its status as a primary macro liquidity gauge. Lower pricing pressures shift Federal Reserve interest rate expectations, accelerating institutional capital rotation back into top tier risk assets.

    Positive Outlook Remains

    At the time of writing, Bitcoin is trading around $64,700. Its market cap is just more than $1.29 trillion and with a daily trading volume of around $27 billion. Inflation easing up, solid investor interest, and improving macroeconomic conditions boosted confidence for most of the digital assets.

    However, cryptocurrency is known for being extremely erratic, which is why, regardless of the positive trend, there may be a rise in day-by-day ups and downs for the short term.

    For the moment, investors are excited about what’s coming next as they are expecting to have a better economic outlook to watch Bitcoin move over the $65,500 price level in the upcoming months.

  • XRP Dips to $1.10 as XRP Ledger Surpasses 8 Million Accounts

    XRP Dips to $1.10 as XRP Ledger Surpasses 8 Million Accounts

    XRP traded near $1.10 after falling 1.71% in 24 hours, tracking Bitcoin’s 1.89% decline and a broader crypto market pullback. The move occurred without major XRP-specific negative news, leaving broader risk sentiment as the primary driver.

    Meanwhile, the XRP Ledger crossed eight million activated accounts, a milestone that has renewed debate over whether rising adoption can support the XRP price while technical resistance and regulatory uncertainty limit short-term gains.

    XRP Price Tracks Bitcoin During Market Pullback

    XRP’s daily loss closely matched Bitcoin’s decline, showing the token still moves with the wider market during risk-off periods. Bitcoin traded around the mid-$64,000 range on July 16 as softer inflation data competed with geopolitical concerns. XRP lacked a separate catalyst strong enough to break that market link.

    Technical pressure also limited recovery attempts. XRP failed to move above a group of moving averages near $1.14 to $1.15, where sellers have blocked recent rallies. The $1.10 level now acts as an important short-term pivot. A hold could support another test of $1.13 to $1.15, while a break may expose the $1.06 area.

    XRP Ledger Crosses 8 Million Accounts

    The XRP Ledger Foundation said the network crossed eight million activated accounts. An activated account holds the minimum XRP reserve needed to send transactions and use services on the ledger. The figure measures funded accounts, but it does not equal 8 million individual users since one person or company may control several addresses.

    Network use has expanded beyond payments. The ledger now supports tokenized assets, stablecoins, decentralized finance tools, and automated transactions. Reports cited by the foundation place tokenized real-world assets on the network above $4 billion, while AI agents have completed more than one million transactions. Still, daily active addresses and new account growth have slowed from earlier peaks.

    XRP Forecasts Split Between $3 and Higher Targets

    The account milestone has brought XRP price predictions back into focus. Motley Fool analyst Dominic Basulto said the token’s upside ‘might be capped at $3,’ partly due to competition from dollar-backed stablecoins in cross-border payments. From $1.10, XRP would need to rise about 173% to reach that target.

    Technical analyst Javon Marks has presented a much stronger forecast. He said XRP ‘can be setting up’ for a move toward $21 and raised a longer-term level above $152. Those targets depend on XRP repeating parts of its 2017 price structure. A $21 price would require a gain of about 1,809% from $1.10, while $152 would require an increase above 13,700%.

    Regulation remains another near-term factor. The Senate Banking Committee advanced the CLARITY Act by a 15-9 vote in May, but the full Senate vote has not yet been scheduled. The bill still needs bipartisan support, while lawmakers discuss ethics and stablecoin provisions.

    Near-term charts offer a mixed view. Some analysts point to a bull flag and falling wedge breakout after months of consolidation, with $1.24 as a possible target if former resistance becomes support. Analysts also highlighted a possible head-and-shoulders pattern with a neckline near $1.06. A daily close above $1.18 could weaken the bearish setup, while a high-volume break below $1.10 may increase downside pressure over coming sessions.

  • Bitcoin Nears $65,000 Resistance After Rebounding to $64,900 – Key Levels to Watch

    Bitcoin Nears $65,000 Resistance After Rebounding to $64,900 – Key Levels to Watch

    Bitcoin has staged a strong recovery from the $64,500 support zone and is now trading around $64,870–$64,900. The cryptocurrency is once again testing the critical $65,000 resistance level, with bulls hoping to break through and open the door to further gains.

    Market Overview

    Bitcoin traded near $64,870 during the latest session, posting a modest gain after buyers stepped in near the $64,400–$64,500 area. The price recovered most of its earlier losses and now sits above several key moving averages, signaling renewed buying interest. The battle between sellers and buyers continues around $64,900, but the market tone has clearly improved.

    Technical Analysis

    The short-term chart looks promising for Bitcoin. The price has moved above its 20-day and 50-day moving averages, indicating buying dominance. Bitcoin also tested the 200-day moving average around $64,870, which acts as the most immediate resistance. A clean break above this level could trigger a push to $65,000 and beyond. However, failure to follow through might cause a brief consolidation.

    The Relative Strength Index (RSI) remains above 60, currently near 69, reflecting good market strength. This reading also suggests the rally has been rapid and the market may need time to absorb gains before continuing higher. Volume surged during the recovery, indicating strong conviction among traders.

    Key Price Levels

    • Immediate resistance: $64,900, followed by the psychological $65,000 level.
    • Upside targets: $65,200 and then $65,400 if $65,000 is breached.
    • Immediate support: $64,700, then $64,500 (the level where buyers previously stepped in).
    • Secondary support: $64,300.

    Market Sentiment

    Confidence has improved after Bitcoin recovered from earlier weakness. Buyers defended the $64,500 support and pushed the price back into a crucial resistance zone. The formation of higher lows suggests demand is strengthening. Still, a move above $64,900 is necessary to confirm a stronger rally. As long as Bitcoin holds above $64,500, the short-term outlook remains optimistic.

    Latest Bitcoin Market Data

    Bitcoin is trading around $64,850–$64,900. The total market capitalization stands near $1.3 trillion, with daily trading volume exceeding $27 billion. These figures indicate continued strong interest from traders and investors despite recent volatility.

    The broader cryptocurrency market also received support from softer-than-expected US inflation data, which eased fears of aggressive interest rate hikes. A weaker US dollar further bolstered demand for Bitcoin.

    Institutional Activity and Regulatory News

    Spot Bitcoin ETFs have recorded fresh net inflows after a period of withdrawals, signaling renewed institutional interest. Investors are also closely watching the progress of cryptocurrency regulation in the United States. Any advancements in regulatory clarity could significantly influence future institutional participation and the overall digital asset market.

    Price Outlook

    Bitcoin is at a critical juncture. The technical picture has improved, but the market needs a decisive close above $64,900–$65,000 to ignite the next rally. If buyers succeed, the price could target $65,200 and $65,400. If sellers defend the current resistance, Bitcoin may retreat to $64,700 or $64,500 before another attempt. The RSI near 69 suggests strong momentum but also hints at potential short-term profit-taking.

    Final Thoughts

    Bitcoin has staged a solid rebound from the day’s low, backed by increasing volume and a move above key moving averages. Buyers successfully defended the $64,500 support, which now acts as the short-term trend anchor. Breaking above $65,000 will be the next big test. A successful breakout would confirm bullish momentum, while a failure may lead to renewed testing of support levels in the coming sessions.

    Frequently Asked Questions

    1. What is Bitcoin’s current price?
    Bitcoin is trading around $64,850–$64,900.
    2. What is the next major resistance level?
    The immediate resistance is $64,900, followed by the key psychological level at $65,000.
    3. Where is the strongest support?
    The main support zone is around $64,500, with additional support near $64,300.
    4. Why did Bitcoin recover?
    The recovery was driven by strong buying near support, higher trading volume, ETF inflows, and improved market sentiment following softer US inflation data.
    5. What should traders watch next?
    Watch whether Bitcoin can close above $65,000. A successful breakout could push the price toward $65,200 and $65,400.
  • Solana Price Eyes $92 Breakout as Network Activity and Institutional Partnerships Fuel Bullish Sentiment

    Solana Price Eyes $92 Breakout as Network Activity and Institutional Partnerships Fuel Bullish Sentiment

    Solana has recovered above two important technical levels, strengthening its latest rebound while the broader trend remains undecided. The token now trades above its 50-day exponential moving average near $76.82 and the 50% Fibonacci retracement around $76.92. However, analysts caution that the recovery still requires confirmation through a decisive breakout above overhead resistance. Meanwhile, growing network activity, institutional developments, and steady derivatives positioning continue to support market attention as traders monitor whether SOL can sustain its upward momentum.

    Technical Indicators Point to a Critical Breakout Test

    SOL now faces immediate resistance at a descending trendline near $81.50. A daily close above that level could open the path toward $83.81. After that, the 78.6% Fibonacci retracement near $88.56 becomes the next technical target, sitting just below a supply zone that has rejected several rallies since March. Together, these indicators suggest buying strength has improved, but analysts continue to watch for a confirmed breakout before identifying a broader trend reversal.

    Crypto market analyst BitGuru also identified the $74–$75 range as an important short-term support zone. If buyers fail to defend that area, SOL could decline toward $68.88 before testing the June cycle low near $60.13.

    Network Growth and Institutional Support Add Momentum

    Beyond technical signals, Solana continues to record strong on-chain activity. Its decentralized exchanges processed roughly $4.15 billion in trading volume during the past 24 hours, placing the network ahead of competing blockchains. At the same time, Solana expanded its institutional reach through a partnership with SBI Holdings. The companies plan to develop on-chain financial infrastructure across Japan, covering stablecoins, tokenized real-world assets, cross-border settlement, institutional services, and payment systems designed for AI agents. Although the agreement does not guarantee higher prices, it broadens Solana’s practical use cases and connects the network with Japan’s financial sector and potential sources of global liquidity.

    Meanwhile, derivatives data continue showing stable speculative interest. Open interest has remained above $5 billion, while futures trading volume increased during the latest market recovery. CoinGlass data also indicate that leverage has not reached extreme levels.

    Analysts Watch the $89–$92 Resistance Zone

    The strongest resistance remains between $89 and $92. SOL has repeatedly struggled to break through that range, making it an important hurdle before any move toward $100. Above that area, the 200-day exponential moving average between $94 and $95 creates another technical obstacle. Traders continue watching both resistance levels closely.

    Crypto market analyst Ali Martinez reported that the SuperTrend indicator generated its first buy signal since October 2025. His analysis projects possible targets near $96 and $121 if buying pressure continues. Still, Martinez noted that the bullish structure would fail if SOL falls below the key support area near $60.

    Market Outlook

    Can buyers maintain enough momentum to push SOL above $81.50 and eventually clear the major resistance between $89 and $92? For now, analysts continue watching the price closely. A failure at $81.50 could keep SOL inside its current recovery range. A decline below $76.40 would weaken the short-term structure, while a break under $74.11 could send the token toward $68.88, where the previous rising trendline may attract renewed demand.

    Solana price has recovered above key technical support while approaching the important $81.50 resistance. Strong network activity, steady interest in derivatives, and the SBI Holdings partnership continue to support market attention as traders watch whether SOL can clear $92 or revisit lower support levels.

  • XRP Crash Risk: Key Factors That Could Trigger a 50% Drop

    XRP Crash Risk: Key Factors That Could Trigger a 50% Drop

    XRP has always been one of the most talked-about cryptocurrencies. Its price often moves faster than many other digital coins as traders closely follow every update related to Ripple, regulation, and the overall crypto market.

    As of mid-July 2026, XRP trades between $1.00 and $1.18, almost 48% below its earlier 2026 high. This sharp fall has once again raised an important question: could XRP lose another 50% of its value?

    The answer is not simple. XRP still has strong supporters since Ripple continues to expand its payment business around the world. At the same time, several risks could push the price much lower if market conditions become worse. A closer look at these risks helps explain why many investors remain cautious.

    XRP Price Has Already Faced Strong Pressure

    XRP enjoyed a solid rally earlier in 2026 after positive news around Ripple and better confidence in the crypto market. That excitement pushed the token much higher. However, the rally did not last forever. Selling pressure soon returned, and the price started to fall.

    Today, XRP trades around $1.00 to $1.18, which is nearly 48% lower than its 2026 peak. The area between $1.15 and $1.20 has become a strong resistance zone where buyers struggle to push the price higher. On the downside, the $1.00 level has become an important support. If this support breaks, market sentiment could become much more negative.

    The Overall Crypto Market Remains the Biggest Risk

    XRP seldom experiences extended independent movement. Bitcoin largely dictates the direction of the broader cryptocurrency market. When Bitcoin tumbles down steeply, it appears that almost every altcoin loses some value—XRP does the same.

    Global economic conditions may worsen the situation. Periods of economic uncertainty often bring higher interest rates, weaker investor confidence, and broader market declines, reducing demand for high-risk assets such as cryptocurrencies. A sharp decline in Bitcoin could push XRP back into a prolonged bear market.

    Profit Booking Could Increase Selling Pressure

    After a large price increase, many traders decide to sell part of their holdings instead of waiting for even higher prices. This creates extra supply in the market. If buyers fail to absorb that supply, prices usually move lower.

    This pattern has appeared several times in XRP’s history. Large rallies often attract heavy selling from long-term holders, which makes it difficult for the token to maintain upward momentum for a long period.

    Regulation Still Creates Uncertainty

    Ripple has achieved important legal victories over the past few years, but regulation remains one of the biggest factors that could affect XRP.

    Many countries still work on new cryptocurrency laws. Governments continue to study digital assets, stablecoins, and cross-border payment systems. Future rules could either help or slow the adoption of XRP.

    Competition Has Become Much Stronger

    Ripple no longer operates in a market with only a few competitors. Today, many blockchain projects offer fast payment networks and digital asset solutions for banks and financial institutions.

    Several companies also focus on tokenized assets, while stablecoins have become a popular option for cross-border payments. At the same time, many traditional financial firms now build their own blockchain systems instead of depending on public cryptocurrencies.

    Technical Levels Could Trigger a Bigger Drop

    The $1.00 price level has become one of the strongest support areas for XRP. If sellers push the token below this level, many automatic trading systems could activate sell orders at the same time.

    Leverage adds another layer of risk. Many crypto traders borrow money to increase their positions. When prices fall quickly, exchanges force these traders to close their positions. This creates additional selling pressure and can turn a normal decline into a much larger crash within a short period.

    Reasons XRP May Avoid a 50% Crash

    Ripple continues to expand its global payment network and works with businesses that want faster international transactions. The company has also joined projects that explore AI-powered payment standards, which shows its interest in future financial technology.

    Activity on the XRP Ledger has also increased, with a noticeable rise in transaction volume. Strong network usage often reflects healthy ecosystem growth.

    Institutional interest also remains an important factor. More professional investors now pay attention to blockchain payment systems than they did during earlier crypto cycles. If this trend continues, XRP could receive stronger long-term support.

    High Volatility is Normal for XRP

    Large price swings have always been part of the cryptocurrency market. A move of 10% to 20% within a single week is not unusual, especially during periods of uncertainty.

    Fear and excitement often control investor decisions. Good news can push prices higher very quickly, while negative headlines can produce equally sharp declines. XRP has experienced both situations many times over the years.

    Can XRP Really Fall Another 50%?

    A deep Bitcoin correction, weaker global markets, lower crypto investment, unexpected regulatory action, and a break below the important $1.00 support level could together create enough pressure for another major decline.

    However, the opposite scenario also deserves attention. Better regulation, continued business expansion by Ripple, higher institutional interest, and stronger demand across the crypto market could help XRP recover instead of falling further.

    Why This Matters

    With XRP hovering near its make-or-break $1.00 support level, understanding these risks is critical. A potential 50% crash isn’t just about Ripple—it’s a warning sign of how macroeconomic pressure and intense institutional competition can impact your portfolio.

    Final Thoughts

    XRP remains one of the best-known cryptocurrencies given Ripple’s focus on global payments and financial technology. Even after the recent correction, the project continues to attract attention from both retail and institutional investors.

    The current price between $1.00 and $1.18 shows that the market remains cautious after a 48% drop from the 2026 high. Another 50% decline cannot be ignored, especially if several negative market events occur together. At the same time, Ripple’s business growth, higher network activity, and steady institutional interest could provide support over the long term.

    The next few months may prove critical. The strength of the $1.00 support level, the direction of Bitcoin, global economic conditions, and Ripple’s future progress will likely decide whether XRP enters another sharp correction or begins its next recovery phase.

    FAQs

    1. What is XRP’s current price?
    As of mid-July 2026, XRP actively trades between $1.00 and $1.18. The price fluctuates dynamically in real time based on active crypto market conditions.

    2. Can XRP really fall another 50%?
    Yes. A combination of a Bitcoin crash, weak market sentiment, regulatory setbacks, and a break below key support could trigger a major decline.

    3. Why is the $1.00 level important?
    It is a major support zone. If XRP falls below this level, selling pressure could increase significantly.

    4. What could help XRP recover?
    Better crypto market sentiment, stronger institutional demand, Ripple’s business expansion, and positive regulatory developments could support higher prices.

    5. Is XRP still a long-term investment?
    Many investors still see long-term potential for Ripple’s payment technology and growing enterprise adoption, although price volatility remains high.

  • Bitcoin Nears $65K Resistance Amid Softer Inflation Data and Surging ETF Inflows

    Bitcoin Nears $65K Resistance Amid Softer Inflation Data and Surging ETF Inflows

    Bitcoin traded near $64,600 on July 15 after hitting an intraday high above $65,100, gaining about 3% in 24 hours. The move brings the leading cryptocurrency close to a key resistance zone, fueled by cooler U.S. inflation data, robust ETF inflows, and short liquidations.

    Cooling Inflation Drives Bitcoin Higher

    The U.S. Consumer Price Index fell 0.4% in June—the largest monthly decline since April 2020. Annual inflation slowed to 3.5% from 4.2% in May, while core inflation remained unchanged and eased to 2.6% annually. The report reduced expectations for a near-term Federal Reserve rate hike, with market pricing dropping from 43% to 13%. Lower rate expectations supported risk assets like Bitcoin, as traders moved away from cash positions.

    Bitcoin’s correlation with the S&P 500 reached 86% during the move, indicating a broad macro reaction rather than a crypto-specific event. Fed Chair Kevin Warsh is addressing Congress this week, and the July policy meeting is scheduled for July 28–29.

    ETF Demand and Liquidations Add Support

    U.S. spot Bitcoin ETFs recorded $181 million in net inflows on July 14, led by BlackRock’s IBIT with approximately $139 million and Fidelity’s FBTC adding roughly $21 million. This fresh demand through regulated investment products coincided with rising prices that forced bearish traders to close leveraged positions. About $107.25 million in Bitcoin shorts were liquidated over 24 hours, adding upward momentum.

    The inflow data followed uneven institutional activity earlier in July. Traders are watching for sustained demand after the CPI-driven move.

    Bitcoin Price Faces a $65K Breakout Test

    Bitcoin now faces resistance at $65,000 and near its 50-day exponential moving average around $65,142. A daily close above that level could open a move toward $68,000, with the next resistance zone between $68,000 and $70,000. Analyst Michaël van de Poppe expects Bitcoin to reach $68,000 within one to two weeks, and possibly $75,000 to $80,000 in August, provided price clears nearby resistance.

    Order-book data shows notable selling interest near $67,000 and above, with buyers supporting between $63,500 and $63,800. A fall below $64,000 could expose $63,000, while a deeper break may bring $61,300 into focus.

    Oil prices add a near-term risk: Brent crude climbed to $85.42 after the U.S. restored a naval blockade on Iranian ports. Further supply disruption could lift inflation expectations and alter the rate outlook that supported Bitcoin’s rally.

  • Bitcoin Price Holds at $64,517 as Bullish Momentum Builds Toward Key $65,000 Resistance

    Bitcoin Price Holds at $64,517 as Bullish Momentum Builds Toward Key $65,000 Resistance

    Bitcoin (BTC) is trading near $64,517 on July 15, 2026, after a strong rally that saw the cryptocurrency break above $64,000 and reach an intraday high of $64,541 on Bitstamp. The world’s largest digital asset has gained roughly 4% to 5% in the last 24 hours, recovering from recent weakness and pushing its market capitalization above $1.29 trillion. Daily trading volume remains robust at nearly $30 billion, signaling active participation from both institutional and retail investors.

    Technical Strength and Price Action

    On the 15-minute chart, Bitcoin traded in a tight range around $62,800–$63,000 for several hours before a surge in buying pressure pushed the price to $64,700, confirming a fresh bullish breakout. After the sharp move, the market entered a consolidation phase between $64,450 and $64,900, a typical breather following strong rallies. Candlestick patterns show that sellers attempted to push the price lower, but buyers quickly stepped in to defend the key $64,500 support level.

    Moving Averages Support the Uptrend

    The moving averages continue to favor buyers. The short-term moving average near $64,689 acts as immediate resistance, while the medium-term average at $64,111 has provided support during minor pullbacks. The long-term moving average sits around $63,294. Since Bitcoin trades comfortably above all these averages, the overall trend remains bullish. As long as the price stays above $64,111, the short-term outlook stays positive.

    RSI Returns to Healthy Levels

    The Relative Strength Index (RSI) has dropped to around 43 after briefly entering overbought territory during the earlier rally. This decline does not indicate weakness; rather, it shows that momentum has normalized after the strong move. If the RSI climbs back above 50, fresh buying momentum could emerge to support another leg higher.

    Key Support and Resistance Levels

    Support: The first line of defense is the $64,450–$64,500 zone, where buyers have prevented further declines. Additional support lies at $64,100, followed by the major support near $63,300. The most critical level is the $62,800–$63,000 range, where the recent breakout originated. A break below these levels could signal a trend reversal.

    Resistance: Immediate resistance stands at $64,700, followed by the psychologically important $65,000 mark. Above that, the major resistance zone lies between $65,200 and $65,500. A clean break above $65,000 could attract fresh buying and pave the way for another rally.

    Fundamental Drivers

    Lower-than-expected U.S. inflation data has boosted Bitcoin, as easing fears of further interest rate hikes improved risk appetite. A weaker U.S. dollar has also supported cryptocurrency prices. Institutional demand remains strong, with Bitcoin ETFs continuing to attract long-term investors despite occasional outflows. Market participants are now watching upcoming economic data and Federal Reserve statements for further direction.

    Outlook

    Bitcoin remains in a bullish phase after successfully breaking above $64,000. Buyers continue to support every pullback, creating a pattern of higher lows. The strong support between $64,100 and $64,500 suggests that the cryptocurrency has the potential to challenge $65,000 and extend toward $65,500. If sellers push the price below $64,100, the next support at $63,300 could act as a strong buying zone. Overall, the combination of robust volume, sustained institutional interest, and improving macroeconomic conditions keeps the market bullish unless key support levels are violated.