Tag: price analysis

  • Solana Price Analysis: $60 Support Holds, $80 Breakout in Sight

    Solana Price Analysis: $60 Support Holds, $80 Breakout in Sight

    Solana has once again entered the spotlight after successfully defending the critical $60 support level. The recent price action has sparked fresh debate: can SOL move higher and reclaim the $80 resistance zone — one of the most important short-term price levels?

    At the time of writing, Solana trades near $75, marking a weekly gain of roughly 8%. Daily trading volume remains robust at over $2.9 billion, while the project holds a market capitalization of around $44 billion, cementing its status as a top cryptocurrency.

    The $60 Support Level Prevented Further Decline

    Solana’s strong defense of the $60–$62 range was the main catalyst for the recent recovery. During market weakness, sellers repeatedly tested that zone, but buyers stepped in each time, preventing further downside. This behavior reflects strong investor confidence — large holders and long-term investors see value at that level.

    After bouncing from support, SOL recorded nearly a 20% price recovery, improving short-term sentiment. The ability to hold above that floor has built a stronger base for the next upward move.

    $80 Remains the Next Major Hurdle

    Despite the rebound, $80 remains formidable resistance. For much of the second quarter of 2026, SOL traded in a range between $70 and $95. A clean break above $80 could shift market sentiment, opening the door to $90 or even $100.

    Price charts show a pattern of higher lows, signaling that buyers are gradually gaining control. Analysts believe several daily closes above $80 could attract stronger interest from traders and spark fresh momentum across the altcoin sector.

    Solana Network Growth Supports Positive Sentiment

    Beyond price, Solana’s blockchain continues to expand. The network now handles nearly 3.5 billion transactions per month and remains one of the fastest in the industry. Monthly active wallet addresses recently surpassed 50 million, reflecting steady ecosystem activity.

    Key developments have also bolstered confidence: MoneyGram expanded its partnership within Solana’s developer ecosystem, and the USDC Treasury minted $250 million in stablecoins on Solana — a vote of trust in the network’s infrastructure.

    ETF Growth Creates Mixed Market Reaction

    Spot Solana ETFs, though still less popular than Bitcoin or Ethereum ETFs, have drawn institutional attention. Total inflows have crossed $1.1 billion, showing growing interest from larger investors. However, some analysts note that ETF demand hasn’t been strong enough to fully sustain a major rally — earlier in June, selling pressure pushed SOL below $70 despite ETF inflows.

    Technical Indicators Show Recovery Potential

    The Relative Strength Index (RSI) has recovered from oversold conditions, signaling that selling pressure is waning. Rising trading volumes also suggest more buyers are entering the market. Key levels remain: strong support near $60, next support around $68, immediate resistance at $80, and the next major barrier near $90. If SOL clears and holds above $80, the market could target $100.

    Why This Matters

    Defending $60 proves strong investor conviction despite market corrections. With booming network growth and $1.1 billion in ETF inflows, reclaiming $80 is more than a short-term rally — it’s the definitive breakout signal needed to target $100.

    Final Outlook

    Solana has shown impressive resilience after defending the $60 support level. Strong price recovery, rising on-chain activity, increasing institutional participation, and healthy ecosystem growth have all improved sentiment. The focus now is on $80 resistance, which may decide Solana’s next major move. A successful breakout could drive SOL toward $90 and possibly $100.

    FAQs

    1. Why is the $60 level important for Solana?
    The $60 zone acted as a strong support floor where buyers consistently stepped in, preventing further decline.

    2. Can Solana reach $80 soon?
    If buying pressure continues to rise, SOL has a good chance of testing the $80 resistance barrier in the short term.

    3. How much is Solana trading at now?
    Solana currently trades near $75, with a weekly gain of about 8% and daily volume exceeding $2.9 billion.

    4. What role do ETFs play in Solana’s price?
    Spot Solana ETFs have attracted over $1.1 billion in inflows, proving institutional interest, but demand isn’t yet strong enough to prevent short-term dips below $70.

    5. What happens if SOL breaks above $80?
    A successful breakout could shift market sentiment, attract stronger trader interest, and open the path toward $90 and $100.
  • Dogecoin Approaches Make-or-Break $0.069 Support as Oversold Signals Intensify

    Dogecoin Approaches Make-or-Break $0.069 Support as Oversold Signals Intensify

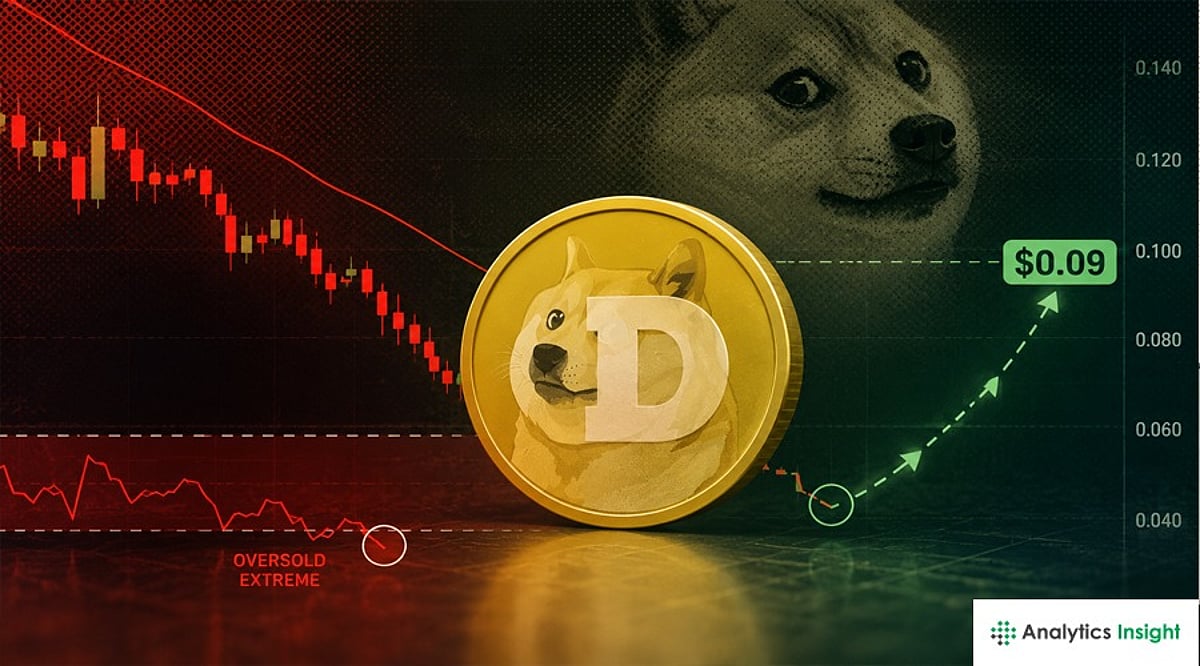
    Dogecoin (DOGE) traded near $0.0714 on Tuesday, with sellers keeping the meme coin below every major moving average while oversold readings suggest downward momentum may be losing steam. The $0.069 support level now stands as the key threshold for a near-term recovery or a deeper slide.

    DOGE Remains Trapped Below Key Averages

    DOGE stayed below its 7-day, 20-day, 50-day, and 200-day moving averages, which sat near $0.07, $0.08, $0.09, and $0.10, respectively. This orderly sequence keeps the broader trend firmly bearish rather than sideways. The price has remained under the 20-day average for several weeks, limiting evidence of a sustained reversal.

    Meanwhile, the Relative Strength Index (RSI) dropped to 21.67, while stochastic readings hit 11.85 (%K) and 9.48 (%D). Bollinger %B stood at 0.12, placing the price close to the lower band. The MACD histogram moved to zero, signaling that downward momentum has started to decelerate.

    Thin Volume Exposes the Rebound Setup

    The latest intraday high reached $0.0725, marking the first recovery hurdle. Technical levels in the supplied analysis placed the 20-day average and Bollinger midline near $0.08. At the same time, Binance spot volume hovered near $53 million, while open interest declined 1.85% over 24 hours — indicating limited new leverage entering the market.

    Immediate order flow remained bearish. Sellers executed about $167 million against $128 million from buyers during the latest hour, producing a taker ratio of 0.77. Positioning data showed 68.9% of retail traders and 73.7% of top traders holding long exposure. The analysis identified this concentration as a risk if another decline triggers forced liquidations.

    Funding remained near neutral at 0.0090%. The absence of negative funding suggests the leverage reset has not yet reached full capitulation.

    $0.069 Close Shapes DOGE Recovery Targets

    CoinCodex projects DOGE at $0.1090 by year-end in a forecast published June 27 — representing a 46% increase from the stated market price. Still, the near-term setup depends on DOGE maintaining a daily close above $0.069.

    The stated entry range stands between $0.070 and $0.072, with $0.08 as the primary target. If DOGE reclaims $0.08 with stronger volume, the $0.09 (50-day average) becomes the next technical target. That move would strengthen the forecast recovery path.

    A daily close below $0.069 would invalidate the near-term bounce setup. The next cited support zone would then sit between $0.060 and $0.062.

    What’s Next?

    Dogecoin remains under bearish pressure below its major moving averages, but oversold indicators suggest selling momentum may be easing. The $0.069 support level now determines whether DOGE can rebound toward $0.08 or fall toward $0.060. Traders should monitor daily closes and maintain disciplined risk management.

  • Bitcoin Drops to $58,500 as Bearish Sentiment Intensifies

    Bitcoin Drops to $58,500 as Bearish Sentiment Intensifies

    Bitcoin entered July 2026 under significant pressure, trading near $58,500 after a prolonged downward trend. The leading cryptocurrency has lost over 30% of its value since its all-time high of $126,000 in October 2025, driven by weak investor sentiment, ETF outflows, and broader economic headwinds.

    Key Developments

    • Price Action: Bitcoin currently trades between $58,500 and $59,000. Over the past 24 hours, it slipped 0.7%, extending year-to-date losses beyond 30%. In India, the asset is valued at approximately Rs. 55.84 lakh.
    • Support and Resistance: The critical support level sits at $58,000. A breakdown could push prices toward $55,000 or even $46,000. On the upside, Bitcoin needs to reclaim $62,500 to initiate a recovery, with resistance at $65,600 and $70,000.
    • Technical Indicators: The Relative Strength Index (RSI) is near oversold territory, while the MACD continues to show bearish momentum, indicating sellers remain in control.

    Why Bitcoin Is Falling

    Several factors are fueling the decline:

    • ETF Outflows: Spot Bitcoin ETFs have seen $5–6 billion exit in recent weeks, signaling reduced institutional appetite.
    • Macroeconomic Pressure: Higher global interest rates dampen demand for risk assets like cryptocurrencies.
    • Capital Rotation: Investment funds are shifting from crypto to artificial intelligence stocks, which have seen strong growth.
    • Corporate Selling: Strategy, a major corporate Bitcoin holder, introduced a plan allowing partial sales, raising fears of increased supply.

    Market Sentiment and Outlook

    Sentiment remains bearish as sellers dominate short-term price action. However, long-term adoption continues: companies like Visa, Google, and Morgan Stanley are still investing in blockchain technology. For July 2026, Bitcoin could trade between $59,000 and $66,000 if support holds, with a potential recovery toward $65,000–$70,000. Conversely, a break below $58,000 would likely trigger further declines toward $55,000 or deeper.

    The $58,000 level is the most important to watch. It will determine whether the market stabilizes or enters another leg of the correction.

    Frequently Asked Questions

    1. What is Bitcoin’s price on July 1, 2026? It trades between $58,500 and $59,000.
    2. Why has Bitcoin fallen so much in 2026? ETF outflows, high interest rates, and reduced investor confidence have driven the decline.
    3. What is the biggest support level? The key support is near $58,000.
    4. Can Bitcoin recover this month? If support holds, prices may move back toward $65,000–$70,000.
    5. Is sentiment bullish or bearish? Currently bearish, with sellers controlling the market.

    Disclaimer: This article is for informational purposes only and does not constitute financial advice. Cryptocurrency investments carry risk. Always conduct your own research before investing.

  • XRP Holds Above $1 as ETF Inflows Increase and XRPL Lending Protocol Enters Testing

    XRP Holds Above $1 as ETF Inflows Increase and XRPL Lending Protocol Enters Testing

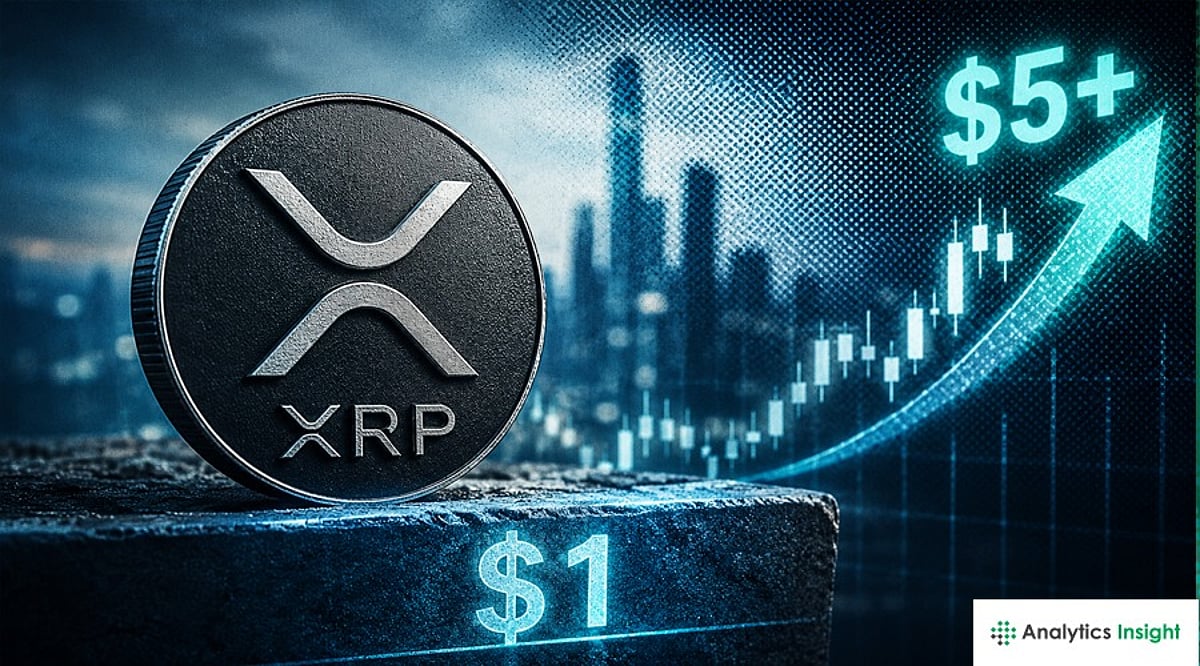
    XRP maintained its crucial $1 support level as leverage declined, network activity expanded, ETF demand continued, and Ripple opened its proposed XRPL Lending Protocol for developer testing. The token gained 1.59% during the session, although resistance near $1.10 prevented a confirmed technical recovery.

    XRP Defends $1 After Major Leverage Reset

    XRP rose from $1.0451 to $1.0544 within a 24-hour range of $0.0435. The token later consolidated between $1.03 and $1.06, leaving the market range-bound rather than signaling a broader recovery. It remains 19% lower for the month. Trading activity peaked on June 29 at 17:00 UTC, with volume reaching 86.5 million XRP—about 67% above the session’s average volume. Open interest across major exchanges dropped below 150 million after reaching 1.3 billion previously, removing much of the crowded leverage behind XRP’s earlier rally. Funding rates turned negative, and forced long liquidations cleared additional bullish positioning. The four-hour relative strength index recovered from oversold conditions to 46. XRP still trades below major moving averages, with resistance near $1.10, followed by the 50-day EMA around $1.20 and the 100-day EMA near $1.31.

    Network Growth and XRP ETF Inflows Continue

    Daily active addresses climbed from 23,000 on June 14 to nearly 39,500 by June 27—a 72% surge in two weeks. At the same time, XRP spot ETFs recorded an eighth consecutive week of inflows, bringing cumulative inflows to $144.7 million despite broader weakness across cryptocurrency investment funds. On June 26, XRP ETFs attracted $15.6 million in net inflows, while Bitcoin ETFs saw $444.5 million in outflows and ether funds lost $12.9 million. The strength in network use and sustained ETF inflows could push XRP through the $1.10 resistance zone, but price action has not yet confirmed that shift. Initial resistance sits at $1.06, followed by $1.09–$1.10. A move above $1.20 would provide a stronger recovery signal; a break below $1 could bring the $0.90–$0.87 region back into focus.

    Ripple Opens XRPL Lending Protocol Testing

    Ripple announced that developers can now test the proposed XRPL Lending Protocol in a dedicated environment. The system would introduce native borrowing and lending functions to the XRP Ledger via two technical specifications—XLS-65 and XLS-66. These would help financial firms structure credit agreements directly on the network. The Single Asset Vault creates a standard format for pooling assets, while the Lending Protocol manages loan terms, servicing, and repayment rules. If network validators approve both specifications, institutions could use tokenized real-world assets like money market funds and commodities as working capital for lending. Developers can experiment with the framework while XRP continues trading between key support and resistance levels.

    What’s Next for XRP?

    XRP continues to defend the $1 support level with declining leverage, strengthening network activity, and positive ETF inflows. The XRPL lending development adds another institutional use case. Traders should watch whether XRP can break above $1.10 and advance toward $1.20 in the coming sessions.

  • Dogecoin Price Analysis: Can DOGE Bounce Back After Dogechain’s Closure?

    Dogecoin Price Analysis: Can DOGE Bounce Back After Dogechain’s Closure?

    Dogecoin recently faced fresh uncertainty after the shutdown of Dogechain, a blockchain project that expanded DOGE’s utility through NFTs, decentralized finance, staking, and smart contracts. Since the original Dogecoin network does not support these advanced features, Dogechain played a critical role in providing additional use cases. Its sudden closure has raised concerns about Dogecoin’s ability to recover and sustain long-term growth.

    Why Dogechain Was Important for Dogecoin

    Dogecoin started as a meme coin and later became one of the most popular cryptocurrencies. Despite its popularity, the network has always lacked the advanced blockchain features that projects like Ethereum and Solana offer. Dogechain addressed this by allowing DOGE holders to use their coins in decentralized applications, NFT marketplaces, and staking platforms, giving Dogecoin access to Web3 services that were previously unavailable. With its shutdown, that extra utility has disappeared, pushing Dogecoin back toward its original identity as a payment-focused meme coin without strong ecosystem development.

    Current DOGE Price Performance

    As of late June 2026, Dogecoin price remains under pressure, trading between $0.074 and $0.076 with weak market momentum. The coin has seen a correction over recent weeks as the broader crypto market struggled to build a recovery. Current data shows DOGE near $0.07 to $0.08, with a market capitalization of about $11.2 billion and daily trading volume around $460 million. The circulating supply has reached nearly 154.8 billion DOGE.

    Why Recovery Still Looks Possible

    While the Dogechain shutdown has damaged short-term confidence, several factors could support a price recovery. Dogecoin’s large and dedicated community remains one of its biggest strengths, having supported the project through various market cycles. Whale activity also shows positive signs — recent blockchain data reveals whale transactions hit a six-month high, with large holders controlling more than 108 billion DOGE, indicating steady accumulation by major investors.

    The overall crypto market trend could also help. Historically, Dogecoin follows Bitcoin’s price movements closely; if Bitcoin enters a bullish phase, DOGE often sees renewed demand from retail traders. Additionally, Elon Musk’s ongoing public connection with Dogecoin continues to keep the coin visible and popular among traders worldwide.

    Technical Price Levels to Watch

    From a technical perspective, Dogecoin now sits near a critical support zone. The first major support level is at $0.070. If selling pressure increases, the next support sits near $0.067, followed by a lower zone at $0.060. On the upside, the first resistance level is around $0.085. Breaking $0.090 would be needed before any move toward $0.100 becomes plausible. Analysts highlight the 200-day moving average near $0.085 as the most important level for any short-term bullish recovery — a move above this could reignite buying interest.

    Long-Term Future of Dogecoin

    Dogecoin still faces a major structural challenge: unlike Bitcoin, it has no maximum supply limit. Approximately 5 billion new DOGE enter circulation each year, creating constant inflationary pressure. With the circulating supply already close to 154 billion, this makes long-term price growth more difficult compared to cryptocurrencies with finite supplies.

    Predictions remain mixed. Some analysts expect DOGE to recover toward $0.15–$0.20 if the crypto market enters a strong bull run in the next cycle. More aggressive forecasts suggest higher targets, but meme-based assets remain highly unpredictable.

    Why This Matters

    The removal of Dogechain’s infrastructure strips Dogecoin of vital decentralized utilities like staking and NFTs. While strong community backing prevents an immediate crash, returning solely to a payment-based asset increases its reliance on unpredictable retail sentiment and speculative social trends.

    Final Outlook

    The Dogechain shutdown has created a setback for Dogecoin, weakening short-term confidence and raising fresh concerns about utility and future development. At the same time, Dogecoin continues to benefit from strong community support, rising whale accumulation, and overall crypto market trends. For now, $0.067 remains the key support level, while a move above $0.090 could confirm a stronger recovery. Dogecoin faces pressure at present, but the possibility of recovery remains alive in the coming months.

  • XRP Defends $1 Support as Holder Losses Reach 2022 Bear Market Levels – Price Analysis

    XRP Defends $1 Support as Holder Losses Reach 2022 Bear Market Levels – Price Analysis

    XRP is holding the critical $0.93–$1.00 support zone after another steep weekly decline, while on-chain data shows holder losses matching levels last seen during the 2022 crypto bear market. Despite the bearish sentiment, analysts see a potential recovery toward $5–$8 if buyers reclaim major resistance levels.

    XRP’s $0.93 Support Becomes the Main Price Test

    Buyers reacted near $1.0079 this week, preventing an immediate break below the psychological $1 level. That response preserved the existing recovery setup, although the market has not confirmed a reversal. The wider support zone runs from $0.93 to $1.00, aligning with earlier breakout levels, a long-term rising trend line, and a Fibonacci extension followed by technical traders.

    Can XRP hold this zone long enough to rebuild momentum? A decisive close below $0.93 could weaken the bottoming structure and expose the next support area near $0.80. On the upside, XRP first faces resistance near $1.15. Bulls would then need to reclaim $1.40 before testing the stronger barrier between $1.70 and $1.90.

    Realized Losses Return to 2022 Bear-Market Levels

    Glassnode data shows XRP’s 90-day Realized Profit/Loss Ratio near 0.33. The reading matches 2022 bear-market levels and indicates that holders are selling more coins at a loss. The ratio compares the value of coins sold at a profit with those sold at a loss. Readings above one favor realized gains, while readings below one indicate greater losses. XRP’s ratio first fell below one in April 2026, when the token traded between $1.30 and $1.40. It later reached 0.38 in early June before declining again.

    Still, the indicator does not confirm a market bottom. During the 2022 downturn, the ratio fell below 0.20 before XRP continued lower toward $0.31.

    Analysts Map a Possible Fifth-Wave Recovery

    Analyst Dark Defender says XRP may be nearing the end of a wave-four correction around $0.93. That level closely matches the support zone that buyers currently defend. His weekly chart also places the Relative Strength Index near 29, which reflects oversold conditions. Under his Elliott Wave count, a fifth-wave advance could target $5.86 and then $8.78. The analyst also maps a longer-term target near $18.23—though that scenario requires a multi-year expansion and remains highly speculative.

    Mikybull Crypto also tracks a possible capitulation phase near XRP’s rising trend line from the 2020 market bottom. His chart places XRP near a major Fibonacci retracement and below the Ichimoku Cloud. His longer-term projection points to the $5–$8 range if XRP holds the trend line. Before then, the token must defend support, reclaim $1.40, and clear resistance between $1.80 and $1.90. A break above those levels could return attention to the previous cycle high near $3.60. A support failure could instead send XRP toward $0.80 before another recovery attempt.

    What’s Next?

    XRP remains at a decisive point as buyers defend the $0.93–$1.00 support zone while holder losses reach 2022 bear-market levels. A recovery above $1.40 could strengthen the bullish outlook, but losing $0.93 may expose $0.80. Traders should closely monitor these levels before expecting a sustained rebound.

  • Bitcoin Hovers Near $59.5K, Ethereum Trades at $1,580 as US-Iran Tensions and Record ETF Outflows Rock Markets

    Bitcoin Hovers Near $59.5K, Ethereum Trades at $1,580 as US-Iran Tensions and Record ETF Outflows Rock Markets

    Bitcoin is navigating its weakest June in four years, trading near $59,427, as a combination of renewed US-Iran geopolitical tensions, a historic $4 billion monthly ETF outflow record, and hawkish Federal Reserve expectations compress price action into a critical $58,000–$61,000 range. Ethereum is holding around $1,580, with both major cryptocurrencies facing headwinds from institutional capital rotation and macroeconomic uncertainty.

    Bitcoin Price Today: $59,427

    Bitcoin is down 0.90% over 24 hours and roughly 6.80% on the week. The token has spent most of June below the $62,000 resistance cluster, failing repeatedly to reclaim key moving averages overhead. A weekly close below $60,000 keeps the near-term bias firmly to the downside. The $58,000 level is now the most actively defended support on the chart. A confirmed break below it opens a path toward $55,000, with some analysts flagging $52,000 as the next structural floor. On the upside, reclaiming $61,200–$62,500 with volume is the prerequisite for any meaningful recovery toward $64,000–$66,000.

    “Bitcoin continues to trade in a tight $58,000–$61,000 range as investors weigh renewed geopolitical tensions in the Middle East against weakening institutional demand. BTC is on track to end June down nearly 19%, marking its weakest monthly performance since mid-2022. Spot Bitcoin ETFs have also recorded more than $4 billion in net outflows this month, the largest monthly withdrawal since their launch.” — Akshat Siddhant, Lead Quant Analyst at Mudrex

    “Bitcoin is down nearly 7% on the week, with altcoins taking an even bigger hit. Both Bitcoin and Ether are on track to finish the second quarter in the red, marking back-to-back losing quarters to start the year. For Bitcoin, this is only the third time it has started the year with two straight losing quarters.” — Piyush Walke, Derivatives Research Analyst at Delta Exchange

    Ethereum Price Today: Around $1,580

    Ethereum is trading near $1,580, under pressure but still holding above the key $1,500 support level. A break below $1,500 could trigger a deeper decline toward $1,440, according to analysts.

    Market Drivers

    US-Iran Ceasefire Tensions Reignite

    Weekend military exchanges between the US and Iran tested the fragile ceasefire that had been holding since April. While both sides have paused strikes for now, the Strait of Hormuz remains a pressure point for global oil flows. Elevated crude prices compound inflation concerns, adding to the hawkish Fed narrative and suppressing risk appetite across crypto markets.

    Record ETF Outflows

    Spot Bitcoin ETFs are on track for their worst monthly outflow since launch in January 2024, with cumulative June redemptions exceeding $4 billion. Weekly redemptions last week hit $1.79 billion, pushing cumulative net inflows from over $66 billion down to approximately $51 billion. BlackRock’s IBIT has absorbed the largest share of redemptions. Capital continues to rotate toward AI-linked equities, drawing risk appetite away from crypto.

    Strategy’s Valuation Falls Below Bitcoin Holdings

    Strategy Inc., the largest single corporate Bitcoin holder with over 847,000 BTC, has seen its market valuation fall below the worth of its own coin holdings. The company’s preferred stock (STRC) has slipped to record lows, triggering concerns it may need to sell Bitcoin to meet dividend obligations. Ripple CEO Brad Garlinghouse criticized the funding model as financial engineering.

    CZ Attributes Decline to AI Competition

    Binance founder Changpeng Zhao noted that crypto’s roughly 50% decline over the past year is due to the gravitational pull of AI infrastructure spending, geopolitical tensions, and the typical four-year halving cycle. US hyperscalers are projected to spend over $700 billion on AI infrastructure this year, competing directly for speculative capital.

    Top 10 Crypto Movers

    • Gainer: TRON (+0.75%) — Relative resilience supported by consistent stablecoin transfer volumes.
    • Losers: Dogecoin (-2.41%), BNB (-1.29%), Solana (-0.42%) — High-beta assets continue to bleed amid macro-driven selloff.

    Fear and Greed Index

    The Fear and Greed Index sits near 18, deep in “Extreme Fear,” reflecting broad caution heading into the final trading days of June.

    Investor Outlook

    Bitcoin enters the final two trading days of June in a structurally weak position. The $58,000–$59,000 support band is the market’s last meaningful floor before a deeper move toward $52,000. July has historically delivered average Bitcoin returns of 7.6% to 10.3%, offering a seasonal tailwind if sentiment improves, but requires a macro catalyst to activate.

    Investors should monitor daily ETF flow data from SoSoValue, geopolitical headlines out of the Middle East, and the Dollar Index. Avoiding leverage and maintaining tight risk management remains the practical priority until $60,000 is reclaimed with conviction.

    FAQs

    What is the Bitcoin price today? Bitcoin is trading near $59,427, down 0.90% over 24 hours. Support sits at $58,000–$58,300, with $52,000 as the next structural floor. Resistance is at $61,200–$62,500, then $64,000.

    Why is Bitcoin falling in June 2026? Spot Bitcoin ETFs have recorded over $4 billion in outflows this month, the largest monthly redemption since launch. Hawkish Fed expectations, US-Iran geopolitical uncertainty, and capital rotation into AI equities have compressed sentiment.

    Which coins are losing the most today? Dogecoin leads declines at -2.41%, followed by BNB at -1.29% and Solana at -0.42%. TRON is the top-ten gainer at +0.75%.

    What should crypto investors watch this week? Track daily spot Bitcoin ETF flow data, geopolitical developments in the US-Iran standoff, and Bitcoin’s ability to hold $58,000. The $59,000–$60,000 zone is the session’s most critical price band.

  • XRP at a Crossroads: Why Reclaiming $1.30 Is Vital for Recovery

    XRP at a Crossroads: Why Reclaiming $1.30 Is Vital for Recovery

    XRP remains under pressure near yearly lows, holding support at $1.12. Analysts say reclaiming $1.30 is essential to restore bullish momentum, while regulation and upcoming Ripple events could influence price direction.

    Key Takeaways

    • $1.30 is XRP’s key resistance level and must be broken for bullish recovery.
    • Support near $1.12 is preventing deeper losses, but market confidence remains weak.
    • Institutional demand stays strong despite regulatory uncertainty and recent price weakness.

    XRP has entered a crucial stage after weeks of price weakness. The cryptocurrency has struggled to recover after heavy selling pressure pushed the token lower during the past few months. Right now, XRP trades near $1.14 to $1.16, which puts the asset close to one of its weakest price levels of 2026.

    After a drop of almost 40% since the start of the year, market attention has now shifted toward one major level: $1.30. Many analysts believe XRP must move above this price before any strong recovery can begin.

    Why the $1.30 Level Matters

    The $1.30 price zone has become the biggest hurdle for XRP. Earlier this month, XRP tried to recover and briefly touched $1.29, but sellers quickly took control and pushed the price back down. This failed attempt showed that strong resistance still exists in that area. In simple terms, resistance means a price zone where buyers struggle to push higher since many traders decide to sell there.

    If XRP continues to stay below $1.30, confidence in the market could remain weak. A successful move above this level would show that buyers have returned and that the market may finally prepare for a stronger upward move.

    Current Support Is Keeping XRP Stable

    At the moment, XRP has managed to defend an important support zone near $1.12. During the recent weekend market decline, the token briefly slipped below $1.14, which created fear that more losses could follow. However, buyers entered quickly and pushed the price back upward before more serious damage happened.

    This recovery showed that demand still exists at lower levels. Even so, the rebound has not been strong enough to fully change market sentiment. Buyers have protected support, but a clear recovery remains missing.

    XRP Has Fallen Behind the Crypto Market

    Another concern comes from XRP’s recent market performance compared to other cryptocurrencies. Over the last seven days, XRP has dropped almost 10%, while many major digital assets have seen smaller losses. This shows weaker relative strength compared to the broader crypto market.

    When a major cryptocurrency performs worse than the rest of the market, traders often become more cautious. That is why breaking above $1.30 has become even more important. It would help restore confidence and prove that XRP can once again compete with the wider market recovery.

    Strong Fundamentals Still Support XRP

    Despite weak price action, several positive developments continue to support XRP in the background. Institutional interest remains active, especially after reports showed that XRP exchange-traded product inflows recently crossed $10 million. This suggests that larger investors still see long-term value even while short-term price weakness continues.

    At the same time, exchange supply has reportedly started to decline. This often means large holders move tokens away from exchanges and choose to hold instead of selling. In many cases, reduced supply creates positive price pressure over time.

    Regulation Creates Short-Term Uncertainty

    Another major factor affecting XRP comes from regulation. Ripple now faces an important deadline connected to California’s Digital Financial Assets Law, also known as DFAL, which officially takes effect on July 1, 2026.

    Since Ripple remains closely connected to XRP, uncertainty around new legal requirements has created caution among traders. The crypto market often reacts strongly whenever regulation becomes uncertain. Until clearer information arrives, some investors may remain on the sidelines.

    Ripple Swell Event Could Shift Sentiment

    Market attention has also started to shift to Ripple Swell 2026, which will be held in New York in late October of this year. A lot of attention will be focused on major topics in the blockchain world, including tokenization, stablecoins, decentralized finance, and institutional adoption of blockchain technology.

    Major Ripple announcements often influence sentiment toward XRP. Positive developments at the event could strengthen long-term investor confidence and attract renewed market interest.

    Risks if XRP Fails to Recover

    XRP remains under pressure while below $1.30 for an extended period of time, with some analysts speculating that if support fails to hold, there could be a move towards $0.93. If selling pressure picks up, even deeper downside targets of around $0.76 may occur.

    Should XRP break above and maintain a position at or above the $1.30 mark, the next potential bounce-off point is between $1.50-$1.80, indicating a resumption of bullish momentum after many months of weakness.

    Final Outlook for XRP

    XRP currently stands at a major turning point. Support near $1.12 has prevented a bigger collapse for now, but real recovery cannot begin unless buyers push the token above $1.30 resistance.

    This price level now acts as the line between weakness and recovery. Staying below it keeps bearish pressure alive. Moving above it could finally restart upward momentum and place XRP back on the path toward a stronger comeback in the crypto market.

    Frequently Asked Questions

    Why is $1.30 important for XRP?

    It is the primary resistance level where sellers repeatedly block recoveries. Breaking above it is essential to restore market confidence and restart upward price momentum.

    What happens if XRP stays below $1.30?

    Bearish pressure will persist, leaving the token vulnerable to further drops. Failing to clear this hurdle risks exposing downside targets near $0.93 and $0.76.

    What support level is currently protecting XRP?

    The key short-term support floor is at $1.12. Buyers have actively defended this zone during recent market dips, preventing a deeper breakdown.

    Are institutions still interested in XRP?

    Yes. Institutional confidence remains stable despite price weakness, as proven by recent XRP exchange-traded product inflows crossing over $10 million.

    Could Ripple Swell 2026 impact XRP price?

    Yes. The October event in New York focuses on major blockchain adoptions, and historically, big announcements there tend to shift sentiment and attract new buyers.

  • Ethereum Price Pressures Mount: ETH Approaches $1,500 as Exchange Inflows Rise

    Ethereum Price Pressures Mount: ETH Approaches $1,500 as Exchange Inflows Rise

    Ethereum fell back toward the $1,500 area after sellers rejected another recovery attempt near a major resistance zone. Rising exchange inflows and a weak chart structure continue to support a cautious market outlook.

    Ethereum Remains Trapped Below Major Resistance

    Ethereum continues to form lower highs and lower lows on the daily chart. The pattern keeps the broader trend bearish and shows that sellers still control price direction. ETH also trades below its 100-day and 200-day moving averages. In addition, the asset remains under a long-term descending trendline that has limited previous recovery attempts.

    The latest rebound stalled below the $1,720 to $1,780 supply zone. Sellers then pushed ETH back toward the $1,460 to $1,560 demand area. Buyers have responded near that support region, but the reaction remains limited. ETH has not reclaimed the resistance range or changed the wider bearish structure.

    Until price moves above $1,780 with sustained strength, market rallies may remain corrective. A break below current demand could expose Ethereum to another downward move. Can buyers defend the $1,500 region long enough to challenge the resistance that has repeatedly stopped each recovery?

    Four-Hour Chart Shows a Fragile Recovery

    The four-hour chart reflects the same pressure across a shorter timeframe. Sellers rejected ETH near $1,720 to $1,780 before driving it toward the lower range boundary. Ethereum later recorded a modest rebound from the $1,500 to $1,530 area. That response shows buyers remain active around the market’s immediate demand zone.

    Even so, ETH still trades near the bottom of its broader consolidation range. Each recovery attempt has also formed a lower high, which keeps short-term momentum weak. For now, Ethereum may continue moving between about $1,520 and $1,750. The lower boundary remains important because a breakdown could increase selling pressure.

    By contrast, a move above the upper range would improve the short-term structure. It could also allow buyers to begin another recovery attempt toward higher resistance.

    Exchange Inflows Add Pressure Near Support

    On-chain data also shows a rise in Ethereum exchange netflows. The 14-day moving average has turned sharply positive during recent trading sessions. Higher netflows mean more ETH is moving onto exchanges. Holders may transfer assets for trading, selling, or reducing market exposure.

    Such inflows do not guarantee a price decline. Still, they add supply pressure while Ethereum trades close to a major support region. The increase has occurred as ETH moved back toward the $1,500 zone. That combination leaves the market sensitive to further weakness around current demand.

    Price stability near support and lower exchange inflows would reduce immediate pressure. Until then, Ethereum remains below key averages and the main resistance zone.

    Conclusion

    Ethereum remains under bearish pressure as sellers defend the $1,720 to $1,780 resistance zone and exchange inflows increase. Buyers must protect support near $1,500 to prevent deeper losses. Traders should watch for either a confirmed support breakdown or a strong resistance reclaim before assessing the next move.

  • MemeCore Surges 3,500% as Dogecoin and Shiba Inu Face Market Headwinds

    MemeCore Surges 3,500% as Dogecoin and Shiba Inu Face Market Headwinds

    The meme coin market has entered a difficult phase in 2026. Big names like Dogecoin (DOGE) and Shiba Inu (SHIB), which once led this space, now face strong pressure. Prices remain weak, market excitement has dropped, and many traders have started to look for fresh opportunities.

    Given this shift, a new project called MemeCore has started to catch major attention. Recent market data shows that while older meme coins continue to struggle, MemeCore has quickly become one of the most talked-about names in crypto.

    Dogecoin Faces Weak Momentum

    Dogecoin has remained the biggest meme coin for many years. It started as a joke but later became one of the most popular cryptocurrencies after strong support from online communities and public figures.

    However, DOGE has lost momentum in recent weeks. Latest market data shows Dogecoin trading close to $0.09, with a 5% drop over the last seven days. Price charts show repeated failed recovery attempts, which have raised concern among traders.

    The problem for Dogecoin right now comes from lower buying pressure. During earlier market rallies, DOGE moved fast given hype and social media attention. This time, that excitement has become much weaker.

    Shiba Inu Also Remains Under Pressure

    Shiba Inu once stood as the biggest competitor to Dogecoin. The project built a strong community and later expanded with products like Shibarium, which aimed to create a larger ecosystem around the token.

    But recent performance shows SHIB also faces difficulties. Current data places SHIB near $0.0000060, while overall trading activity has stayed relatively weak. Price movement has remained slow for several weeks.

    Even though developers continue to work on ecosystem growth, market interest has fallen compared with earlier years. During the last major meme coin rally, SHIB attracted massive retail demand. Right now, that same excitement no longer exists at the same level.

    The Meme Coin Sector Slows Down

    The struggle of DOGE and SHIB reflects a bigger change in the meme coin market. Industry reports show the total meme coin sector has lost a large part of its earlier market value after strong corrections hit speculative crypto assets.

    In past years, meme coins mostly depended on internet jokes, hype, and social media trends. But the market now looks very different. Many investors now prefer projects that offer stronger token systems, lower transaction costs, and bigger ecosystems instead of tokens that survive as a result of popularity.

    MemeCore Quickly Gains Attention

    MemeCore has become one of the biggest surprise projects of this year. Unlike older meme coins, MemeCore has built interest not only through community hype but also through technical improvements.

    One major update this year reportedly reduced network transaction costs by nearly 100 times, which immediately attracted attention across the crypto market. After this update, the native token called M saw a massive rally. The project soon became one of the fastest-rising meme assets in the entire sector.

    MemeCore Overtakes SHIB in Market Value

    One of the biggest crypto stories this year came after MemeCore reportedly moved past Shiba Inu in market capitalization for a short period. Recent reports showed MemeCore reaching almost $4.79 billion in market capitalization, which briefly made it the second-largest meme coin after Dogecoin.

    This sudden jump brought huge market attention. Many traders started to view MemeCore as the next possible breakout project in the meme coin sector.

    Strong Growth Despite Price Pullback

    Current data shows the token trading below its all-time high of $4.82, while the project still holds a fully diluted valuation above $15 billion. Over the last seven days, price data shows a correction between 8% and 11%.

    Even after this decline, long-term numbers remain extremely strong. Some market analysts estimate MemeCore has delivered returns of more than 3,500% since launch, one of the strongest performances among new crypto projects this cycle.

    Could MemeCore Become the Next Big Winner?

    The crypto market often rewards projects that bring something new. Right now, Dogecoin and Shiba Inu continue to face slower growth and weaker momentum. Meme coins still remain risky assets, and sharp price drops can happen anytime. But current trends show that the market no longer rewards hype alone. If this trend continues, MemeCore may become the next major winner in the meme coin market, while DOGE and SHIB continue to fight through one of their toughest periods in recent years.