Tag: price prediction

  • XRP Price Prediction for August 2026: Can It Break the $1.03 Resistance Barrier?

    XRP Price Prediction for August 2026: Can It Break the $1.03 Resistance Barrier?

    As of August 7, 2026, XRP is trading around $1.03, having declined 1.53% in the past 24 hours and 3.85% over the last week. The cryptocurrency is consolidating after a subdued July that saw prices mostly range between $1.05 and $1.12. The token remains well below its 50-day and 200-day moving averages near $1.11 and $1.36, reflecting ongoing market caution.

    Technical Structure and Seasonal Headwinds

    August has historically been the flattest month for XRP, with an average return of just 0.43%. The token has closed lower in August for four consecutive years, marking the longest active losing streak for any month. Last August, XRP dropped 8%. While July has been positive every year since 2020—rising about 10% on average—this July saw only a 2% gain, closing at $1.06 from a starting price of $1.04. XRP can still move, but a steady catalyst is needed.

    XRP currently trades with a bearish near-term bias, staying well under the 50-day, 100-day, and 200-day exponential moving averages (EMAs) at about $1.11, $1.19, and $1.38, respectively. The Relative Strength Index (RSI) at 37.38 hovers just above oversold territory, while the Moving Average Convergence Divergence (MACD) remains below zero with a negative line, indicating fading momentum with no clear reversal signal.

    Key resistance levels are: the 50-day EMA near $1.11, the 100-day EMA around $1.19, and the flat barrier near $1.30. On the downside, near-term support sits at the psychological and structural base of $1.00. A decisive break below that level would likely open the door to further bearish moves.

    ETF Inflows, Regulatory Delays, and Market Sentiment

    According to SoSoValue, XRP spot ETFs recorded net inflows of $3.45 million. The Bitwise XRP ETF led with $2.89 million in net inflows, bringing its historical total to $510 million. The Franklin XRP ETF (XRPZ) followed with $561,600 in inflows.

    The CLARITY Act remains the primary catalyst. Senate Majority Leader John Thune confirmed that the floor vote has been delayed but is expected once the Senate returns after the August recess. “The Dems are insistent on no CLARITY vote… I worked with sponsors of the bill. Senator Lummis was great, and we’re getting that queued up first thing when we come back,” Thune said.

    Traders are closely monitoring the $1.03 support zone, with short-term long setups targeting $1.18 and longer-term perspectives emphasizing the need to reclaim $1.60 for any structural shift. Sentiment remains mixed, balancing accumulation near support against the absence of immediate catalysts.

    Overall, August 2026 is likely to deliver range-bound trading rather than a decisive move. Holders and traders should keep an eye on the $1.05 support level and volume on any attempt above $1.22.

    Frequently Asked Questions

    • Why is XRP struggling to move higher in August 2026? XRP continues to trade below its major moving averages, reflecting weak momentum and cautious investor sentiment. The absence of a major near-term catalyst has kept the token within a narrow range.
    • What are the key support and resistance levels for XRP? Immediate support lies around $1.00–$1.03, while resistance is seen near $1.11, $1.19, and $1.30. A sustained move above these levels could improve the technical outlook.
    • How could the CLARITY Act impact XRP? If passed, the CLARITY Act could provide greater regulatory clarity for digital assets in the US, potentially boosting institutional confidence and supporting broader adoption of XRP-related investment products.
    • Are XRP ETFs attracting institutional interest? Yes. According to SoSoValue, XRP spot ETFs continue to record positive inflows, led by the Bitwise XRP ETF. Continued capital inflows could strengthen long-term sentiment if the trend persists.
    • What is the outlook for XRP in August 2026? Current indicators suggest XRP may remain range-bound unless a strong catalyst emerges. A breakout above $1.22–$1.30 with higher volume would improve the probability of a broader recovery, while a break below $1.00 could trigger additional downside pressure.
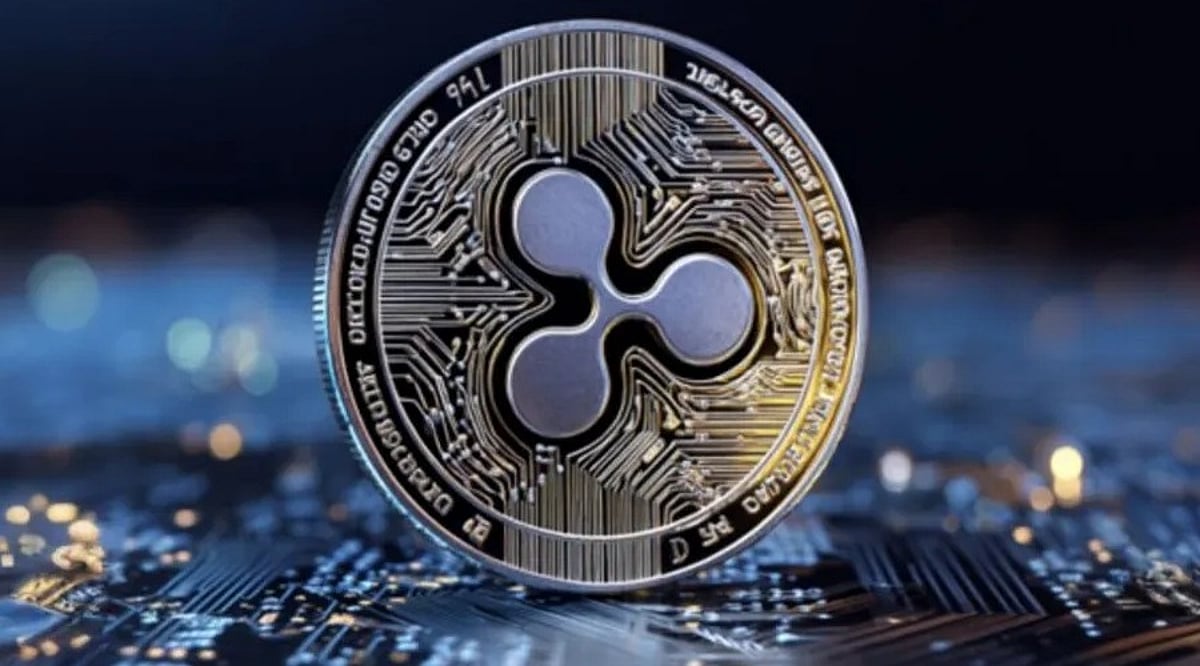
  • XRP Poised for Potential 2,000% Rally as Elliott Wave 3 Breakout Nears

    XRP Poised for Potential 2,000% Rally as Elliott Wave 3 Breakout Nears

    XRP is approaching a critical juncture, with market participants closely watching whether the cryptocurrency can clear major resistance levels and ignite a new bull phase. According to crypto analyst EGRAG CRYPTO, XRP may be nearing the final stages of an Elliott Wave 2 correction, setting the stage for a Wave 3 advance—typically the strongest phase of the Elliott Wave cycle.

    The Relative Strength Index (RSI) is reinforcing the bullish sentiment by developing a bullish divergence with XRP price. The RSI is forming higher lows while XRP has been making lower lows, suggesting that bearish momentum is gradually fading. Although this pattern does not guarantee a reversal, it has historically appeared around key market bottoms.

    Key Resistance Levels Hold the Answer

    The primary resistance zone sits at $1.30-$1.60, according to EGRAG. A sustained move above this range would signal bullish control and improve the odds of a Wave 3 breakout. Beyond that, XRP must reclaim $1.96 and then the $3-$3.60 zone. A decisive break above the previous Wave 1 peak would provide stronger technical confirmation that the next impulsive rally has begun.

    On the downside, immediate support is around $1.00-$0.95, followed by $0.75. If selling pressure intensifies, the $0.60-$0.52 zone represents the final major support area before the long-term bullish structure comes under pressure.

    Technical Setup Supported by Growing Fundamentals

    If Wave 3 materializes as projected, EGRAG believes XRP could significantly outperform its prior rally. Since Wave 1 delivered gains of roughly 1,200%, Fibonacci extension analysis suggests Wave 3 could produce an even larger move, with projected upside ranging between 1,900% and 2,000% from the anticipated bottoming zone.

    The bullish technical outlook is also backed by improving market fundamentals. Spot XRP exchange-traded funds (ETFs) have reportedly attracted approximately $1.5 billion in inflows, while the XRP Ledger’s tokenized real-world asset ecosystem has expanded beyond $4.3 billion, highlighting increasing institutional participation.

    Growing discussions around XRP’s potential role in cross-border payments have further boosted investor attention. However, analysts stress that technical confirmation remains essential. Until XRP secures sustained closes above the $1.30-$1.60 resistance area and breaks beyond its previous Wave 1 high, the projected long-term rally remains a technical possibility rather than a confirmed trend.

    FAQs

    1. What is the Elliott Wave 3 pattern for XRP?

    According to Elliott Wave theory, Wave 3 is typically the strongest and longest bullish phase. If XRP completes its Wave 2 correction, it could enter a powerful upward trend supported by increasing buying momentum.

    2. Why is the $1.30-$1.60 zone important?

    This range represents XRP’s key resistance area. A sustained close above it would indicate buyers have regained control and significantly strengthen the bullish outlook for a larger rally.

    3. What does the RSI bullish divergence indicate?

    A bullish RSI divergence occurs when price makes lower lows while the RSI forms higher lows. It often suggests weakening selling pressure and can signal a potential trend reversal, though confirmation is still required.

    4. What are XRP’s major support levels?

    Immediate support lies between $1.00 and $0.95, followed by $0.75. If selling intensifies, the $0.60-$0.52 range is viewed as the final major support zone before the long-term bullish structure weakens.

    5. What fundamental factors support XRP’s bullish outlook?

    Growing institutional interest, approximately $1.5 billion in spot XRP ETF inflows, and the XRP Ledger’s tokenized real-world asset ecosystem surpassing $4.3 billion continue to strengthen the long-term investment case for XRP.

  • Ethereum Price Outlook: Institutional Rotation and Whale Accumulation Signal Bullish Breakout

    Ethereum Price Outlook: Institutional Rotation and Whale Accumulation Signal Bullish Breakout

    Ethereum (ETH) is showing renewed signs of strength as institutional investors increase exposure and on-chain data reveals significant activity from large holders. While recent whale transactions initially raised concerns about selling pressure, the broader market has remained resilient, and derivatives traders continue to maintain bullish positions.

    Institutional Capital Shifts Toward Ethereum

    Recent fund flows indicate a notable rotation from Bitcoin into Ethereum investment products. Over the past week, Bitcoin-based exchange-traded funds (ETFs) recorded approximately $60 million in net outflows, while Ethereum-focused products attracted $20 million in inflows. This shift suggests that some institutional investors are increasing their allocations to Ethereum. At the same time, the network continues to expand its role in decentralized finance (DeFi), stablecoin settlements, and tokenized real-world assets — among the fastest-growing sectors in the digital asset space.

    Whale Transactions Highlight Active Accumulation

    According to Lookonchain, a major wallet withdrew 40,000 ETH worth nearly $76.6 million from Binance in a single transaction. Large withdrawals from exchanges are generally viewed as a bullish signal, as they reduce the readily available supply for sale and may indicate longer-term accumulation. Additionally, ETH’s largest wallets recently redistributed 226,435 ETH valued at around $430 million — one of the biggest surges in whale activity seen in recent weeks. Instead of triggering immediate concerns, the market absorbed these movements while the price held above key support levels.

    Derivatives Market Maintains Bullish Bias

    Data from CoinGlass shows that Ethereum’s OI-weighted funding rate has remained positive for most of July, currently sitting at 0.0022%. This indicates that long traders are paying a premium to keep their positions open. Although the rate briefly dipped below zero, it has since recovered, reinforcing a generally bullish sentiment. The long/short ratio also leans bullish at 0.9904. On Binance, Top Trader accounts show a ratio of approximately 1.78, while Binance overall stands at 2.24 and OKX at 1.66. Overall, investors remain positioned for longs rather than shorts.

    Technical Structure

    Ethereum has strengthened its foundation after forming a double bottom near the $1,550–$1,600 support range and reclaiming the significant $1,900 level. The 200-day Exponential Moving Average (EMA) is starting to decline in the $2,100–$2,200 range, which serves as a key resistance zone with a long-term supply area. If the price breaks above this range, bulls could target $2,500. On the downside, maintaining support above $1,900 is critical. A break below that level could expose ETH to another test of the $1,750–$1,800 demand area.

    With institutions positively adding to their holdings, whale activity remaining bullish, and derivatives traders staying long, Ethereum is entering an important phase that may shape its medium-term price trajectory.

    FAQs

    Why are institutional investors becoming more interested in Ethereum?

    Recent fund flow data shows capital rotating from Bitcoin investment products into Ethereum-focused funds. Investors are also attracted by Ethereum’s growing role in decentralized finance (DeFi), stablecoins, and tokenized real-world assets.

    What does whale accumulation mean for Ethereum’s price?

    Large withdrawals of ETH from exchanges are generally viewed as a bullish signal since they reduce the immediately available supply for selling. This often suggests long-term accumulation rather than short-term profit-taking.

    What do Ethereum’s funding rates indicate?

    According to CoinGlass, Ethereum’s OI-weighted funding rate has remained positive for most of July, indicating that long traders are paying a premium to maintain their positions. Positive funding typically reflects optimistic sentiment in the derivatives market.

    What are the key technical levels to watch for ETH?

    Ethereum has important support around $1,900, while the primary resistance lies between $2,100 and $2,200, where the 200-day EMA is located. A breakout above this zone could strengthen the bullish trend and bring $2,500 into focus.

    What does the long/short ratio suggest about market sentiment?

    The long/short ratios across major exchanges remain tilted toward long positions. Binance Top Trader accounts, Binance overall accounts, and OKX all show more long positions than shorts, indicating that professional traders continue to maintain a constructive outlook for Ethereum.

  • Dogecoin Price Outlook: Wedge Tightens as Analyst Revisits $2.82 Target

    Dogecoin Price Outlook: Wedge Tightens as Analyst Revisits $2.82 Target

    Dogecoin (DOGE) is trading near $0.07030, with its short-term chart forming a tightening wedge pattern. The memecoin remains far below its all-time high near $0.73, but renewed technical analysis from crypto analyst Javon Marks has brought a long-term target of $2.82 back into discussion. Over the past 24 hours, DOGE has dropped 1.07%, with $575.8 million in trading volume and a market capitalization of $12.02 billion.

    Wedge Pattern Tightens as Longs Absorb Losses

    On the shorter timeframe, DOGE price action has compressed into a narrowing wedge near $0.07012. Both buyers and sellers are waiting for a clear breakout. Compared to other memecoins like Shiba Inu and Pepe, which are also trading sideways, Dogecoin’s wedge has tightened more sharply. Meanwhile, long liquidations reached roughly $2.18 million over 24 hours, while short liquidations stood at about $172,900, indicating that leveraged long positions bore the brunt of recent losses.

    Binance and OKX Lead Exchange Volume

    Binance recorded the highest Dogecoin volume among major exchanges, handling approximately $295.19 million. OKX followed with $192.43 million, while MEXC and Bybit reported $89.14 million and $80.01 million, respectively. Traders continue to monitor whether increased buying activity can push DOGE above its narrowing range.

    Analyst Points to Historical Pattern for $2.82 Target

    Cryptocurrency analyst Javon Marks compared Dogecoin’s current structure with earlier altcoin cycles. He noted that DOGE previously crossed the 1.618 Fibonacci extension during major bull markets and linked that historical pattern to a possible $2.82 target. Achieving this level would require an advance of approximately 3,800% from current prices. Marks emphasized that such a move would depend on stronger sentiment, deeper liquidity, and a broad altcoin rally. Without those conditions, the projection remains a long-term technical scenario.

    Whale Movement Adds to Market Interest

    Separately, on-chain tracker dogegod reported that whales moved 900 million DOGE in a single day, valued at roughly $63 million. The purpose of the transfer was not confirmed, but large movements can signal accumulation, portfolio rebalancing, or preparation for future market activity. Despite the whale movement and renewed analyst attention, DOGE remains in a downtrend, pressured by Bitcoin’s decline and broader altcoin sentiment. Traders are watching buying volume, technical confirmation, and further whale transfers for clearer signals about Dogecoin’s next move.

  • Solana Price Approaches Critical Breakout as Stablecoin Supply Exceeds $15 Billion

    Solana Price Approaches Critical Breakout as Stablecoin Supply Exceeds $15 Billion

    Solana is trading near $74 after weeks of consolidation, with record stablecoin adoption, rising network activity, and increasing institutional interest building bullish momentum. A decisive breakout above $80 could open the path to further gains.

    Key Takeaways

    • Solana’s stablecoin market capitalization has surpassed $15 billion for the first time.
    • Price remains above key support near $73, with resistance between $76 and $80.
    • Rising network activity and institutional interest underpin a positive long-term outlook.

    Price Action and Technical Levels

    Solana trades near $74 after several weeks of sideways movement. The daily chart shows price action within a narrow range, often a precursor to a larger move. The resistance zone between $76 and $80 is now a focal point; a strong push above this area would confirm renewed momentum.

    Bollinger Bands indicate the upper band near $79, the middle band around $76, and the lower band close to $73. The current price sits between the lower and middle bands, signaling a calm market after recent swings. This setup often attracts traders looking for the next directional move.

    Price is holding above the important support zone near $73, which has halted declines in recent weeks. A stable hold above this level preserves the current market structure and leaves room for another attempt at higher prices.

    Stablecoin Growth Adds Fresh Strength

    A major driver of optimism is the rapid rise in stablecoin activity on Solana. The network now holds over $15 billion in stablecoin market capitalization, a new record. This milestone reflects stronger liquidity across the blockchain and signals increased confidence in the ecosystem.

    Higher stablecoin balances often support healthy trading conditions, with more capital available for decentralized finance (DeFi) applications, token swaps, and payment activity. New projects also gain easier access to liquidity, supporting broader ecosystem growth.

    This expansion is not limited to major assets like USDC and USDT; new stablecoins are also contributing to the rising total, indicating wider participation across the network. A balanced mix of assets strengthens market conditions and supports long-term development.

    Network Activity Continues to Improve

    Recent blockchain data paints a positive picture for Solana. Active wallet numbers continue to rise, and transaction counts remain healthy. Strong user participation shows that activity extends beyond simple price speculation.

    Payment activity is also increasing as more applications expand across the ecosystem. Developers continue to build new products, attracting fresh users and additional capital. Healthy development often creates a stronger foundation for future market growth.

    These improvements support investor confidence even though price remains in a consolidation range. Strong network usage often provides better long-term value than price gains alone, which is why many market participants continue to monitor Solana closely.

    Institutional Interest Keeps Building

    Institutional attention toward Solana continues to grow. Several financial firms have expanded access to Solana-related products, and discussions around exchange-traded funds (ETFs) remain active across the digital asset market.

    Greater institutional participation usually brings larger pools of capital into the ecosystem. Professional investors often focus on projects with strong technology, healthy liquidity, and active communities. Solana meets many of these requirements through steady network growth and expanding adoption.

    Although institutional demand has not yet pushed price into a confirmed rally, the trend supports a stronger long-term outlook. Market participants often view institutional interest as an important sign of confidence during periods of consolidation.

    Critical Price Levels to Watch

    The daily chart highlights several important levels that could shape the next move. Immediate resistance stands near $76, followed by the upper Bollinger Band near $79. Another major resistance appears around $84, where an earlier swing high still influences market sentiment.

    A daily close above $80 would strengthen bullish momentum and open the path toward $84 and $90. Strong trading volume during such a move would increase confidence in a sustained breakout.

    On the downside, support remains near $73, followed by $70 and $67. These areas have attracted buyers during previous pullbacks. A stable hold above these levels keeps the broader structure healthy and preserves the possibility of another upward move.

    Why This Matters

    Solana stands at an important stage where strong network growth meets a critical technical price level. Record stablecoin adoption, healthy blockchain activity, and rising institutional interest strengthen market confidence. A confirmed breakout above key resistance could attract fresh capital, shape short-term market sentiment, and reinforce Solana’s position among leading blockchain networks.

    Market Outlook Favors Patience

    The current market situation is encouraging, but confirmation of a breakout has not yet occurred. Stablecoins continue to gain popularity, and the network remains active and developing with institutional involvement, even if not yet overwhelming.

    Nevertheless, the chart shows consolidation rather than a strong bullish movement. Bollinger Bands indicate that volatility may return and determine the direction of the next move. Traders are likely to focus on the $80 level, as a break could signal a move toward resistance at $84 or $90.

    For now, Solana remains well positioned with solid ecosystem fundamentals. The increase in on-chain activity, stablecoin adoption, and improved institutional interest create a favorable market environment.

    Frequently Asked Questions

    1. Why does stablecoin adoption matter for Solana? Higher stablecoin liquidity supports trading, DeFi activity, payments, and overall ecosystem growth.
    2. What is the key breakout level for Solana? A daily close above $80 could confirm bullish momentum and target higher resistance levels.
    3. Where are the main support levels? Key support levels are around $73, followed by $70 and $67.
    4. Is Solana already in a bullish trend? The market remains in consolidation, although improving fundamentals support a bullish outlook if resistance breaks.
    5. What factors support Solana’s long-term growth? Record stablecoin adoption, rising on-chain activity, active development, and growing institutional participation continue to strengthen the network.
  • Dogecoin Price Prediction: $14M Whale Buy Sparks Renewed Interest in DOGE

    Dogecoin Price Prediction: $14M Whale Buy Sparks Renewed Interest in DOGE

    Dogecoin has once again captured the attention of the cryptocurrency market after a whale purchased nearly 200 million DOGE, worth approximately $14 million. This significant accumulation has sparked fresh interest among traders, as large investors often make such moves before major price shifts. While whale activity does not guarantee a rally, it typically brings renewed focus to the asset.

    At the time of writing, Dogecoin is trading around $0.072–$0.073. The price has dipped in the latest session, but many traders are now watching closely to see if this whale purchase signals the start of a recovery.

    Whale Purchase Boosts Market Confidence

    Blockchain data reveals that whales added around 200 million DOGE through Robinhood-linked wallets. This purchase occurred as market activity picked up across major exchanges. Large investors generally have access to more data and capital than retail traders, so many market participants follow whale transactions to gauge potential trends. Although a whale buy does not guarantee higher prices, it often increases overall market confidence.

    Futures Market Shows Strong Activity

    Dogecoin’s futures market has also become more active. Open interest has climbed to about $1.08 billion, while derivatives trading volume has more than doubled in recent sessions. Higher open interest indicates more futures contracts remain open, signaling increased market participation. This often suggests that traders expect larger price moves ahead. The surge in volume also points to heightened volatility, meaning prices could swing quickly in either direction.

    Technical Indicators Paint a Mixed Picture

    According to the latest 15-minute TradingView chart, Dogecoin is currently valued at approximately $0.0723 after a significant decline from a recent high of $0.0739. The price sits below the midpoint of the Bollinger Bands, indicating sellers remain in short-term control. However, other technical indicators offer a different perspective.

    The Relative Strength Index (RSI) has dropped to around 28, placing Dogecoin in oversold territory. An RSI below 30 suggests that strong selling pressure has pushed the asset into oversold conditions in the short term. This often leaves room for a recovery if buying resumes.

    Key Support and Resistance Levels

    The immediate support level is around $0.0720. If this level holds, buyers may attempt to push the price higher. A stronger support level lies near $0.0715, where buyers could step in if selling continues. On the upside, the first resistance is near $0.0730. Above that, $0.0754 remains the critical level that traders are watching. A successful move above this area could improve market sentiment and attract more buyers.

    Short-Term Price Prediction

    If buyers defend $0.0720 and push the price above $0.0754, Dogecoin could move toward $0.0795 and potentially test $0.0800. Continued whale accumulation and strong futures activity would provide additional support for this bullish scenario. However, if sellers break the $0.0720 support level, Dogecoin could fall toward $0.0710 or even $0.0700. Weak sentiment across the broader cryptocurrency market could add further pressure.

    Long-Term Outlook

    Dogecoin remains one of the most well-known cryptocurrencies, thanks to its dedicated community and strong branding. Its periodic acceptance by merchants and ongoing developer support are additional advantages. However, Dogecoin is still a highly speculative asset. Market sentiment, Bitcoin price movements, and social media discussions continue to play a significant role in determining its price.

    If the broader crypto market recovers in the second half of the year, Dogecoin prices may rise again. If the market remains sluggish, prices are likely to stay within the same range despite recent whale activity.

    Why This Matters

    A $14 million whale purchase signals that institutional holders are capitalizing on oversold technical conditions. The surge in futures open interest to $1.08 billion points toward imminent price volatility, making $0.0720 a critical line in the sand for traders.

    Final Thoughts

    The $14 million whale purchase has brought renewed focus on Dogecoin, especially with technical indicators producing mixed signals. The rise in futures open interest to $1.08 billion, high trading volume, and an RSI near 28 indicate increased market activity. However, the price remains below a crucial resistance level, highlighting the need for buyers to demonstrate renewed momentum. The $0.0720 support and $0.0754 resistance are the key levels to watch. The next move above or below these levels is likely to determine Dogecoin’s price direction in the near term.

    Frequently Asked Questions

    1. Why is Dogecoin in the news?
    A major whale accumulated nearly 200 million DOGE worth $14 million via Robinhood, renewing investor focus on potential upside moves.

    2. What is Dogecoin’s current price range?
    Dogecoin is consolidating in a tight trading range, holding near the critical $0.072 to $0.073 support region.

    3. Why is the RSI important now?
    An RSI near 28 indicates deeply oversold short-term conditions, which often precedes a relief bounce if buyers step in to absorb selling.

    4. What are the key price levels for DOGE?
    Immediate key support sits at $0.0720, while breaking above overhead resistance at $0.0754 is required to confirm a bullish reversal.

    5. Can the whale purchase push DOGE higher?
    While whale buys boost market confidence, a sustained price recovery requires continuous spot buying volume and a breakout above $0.0754 resistance.

    Disclaimer: This article is for informational purposes only and does not constitute investment advice. Cryptocurrency investments are highly risky and may result in total loss. Always do your own research before investing.

  • Solana (SOL) Long-Term Price Forecast: Scenarios for 2030 and Beyond

    Solana (SOL) Long-Term Price Forecast: Scenarios for 2030 and Beyond

    Solana remains one of the fastest-growing Layer-1 blockchains, but its long-term price outlook is far from certain. Forecasts for SOL by 2030 range from around $90–$300 in cautious scenarios to over $2,000 in highly bullish cases. The outcome will depend on adoption, regulation, and overall crypto market growth.

    Institutional interest continues to strengthen Solana’s investment case. Spot Solana ETF inflows have crossed $1.1 billion, while major financial firms are exploring Solana-based products. Growing adoption by traditional institutions could significantly increase long-term demand for the SOL token.

    Technology remains one of Solana’s biggest advantages. Upgrades like Alpenglow, Firedancer, and future scaling improvements aim to boost speed, reduce latency, and improve network reliability. These innovations could make Solana an attractive platform for payments, DeFi, tokenized assets, and high-frequency trading.

    Real-world asset tokenization is becoming another major growth driver. Tokenized assets on Solana have reached record highs, while companies including Visa, Franklin Templeton, and Société Générale have explored the network for payments and digital asset settlement. Wider enterprise adoption could support higher SOL valuations over time.

    Despite its strengths, Solana faces serious challenges. Ethereum still leads decentralized finance with a much larger ecosystem and total value locked. Solana must also overcome concerns about past network outages, execution risks, and regulatory uncertainty to maintain long-term investor confidence.

    Analysts suggest thinking about Solana in scenarios rather than one fixed price target. A cautious outlook places SOL between $90 and $300 by 2030, while a moderate case sees several hundred dollars through steady ecosystem growth. A bullish scenario above $1,000 would likely require mass stablecoin adoption, expanding institutional investment, and a strong crypto bull market.

    Looking beyond 2030, forecasts become even wider. Some experts see SOL reaching $2,000–$4,000 by 2036 if Solana becomes a key layer for global tokenized finance, while bearish projections remain below $500 if competition, regulation, or adoption disappoints. As with all cryptocurrencies, long-term returns remain highly uncertain and volatile.

  • Solana Gains Traction as E*Trade Listing and Network Expansion Fuel Price Optimism

    Solana Gains Traction as E*Trade Listing and Network Expansion Fuel Price Optimism

    Solana has returned to the spotlight after two major developments: Morgan Stanley’s E*Trade platform now offers spot trading for SOL, and the network continues to show strong growth across key metrics. These events have sparked fresh discussion about the cryptocurrency’s price outlook, with market experts pointing to improved accessibility and healthy ecosystem activity as potential long-term catalysts.

    E*Trade Opens a New Door for Solana

    E*Trade, a brokerage owned by Morgan Stanley, has completed its rollout of crypto spot trading and included Solana alongside Bitcoin and Ethereum. Eligible customers can now buy, sell, and hold SOL through their familiar brokerage accounts. This move is significant because E*Trade serves a large base of traditional investors who may prefer not to open separate crypto exchange accounts. Broader access often leads to increased market activity and liquidity.

    Strong Network Growth Supports Confidence

    The Solana blockchain continues to show healthy expansion. Stablecoin activity remains strong, decentralized exchange (DEX) trading volume is high, and tokenized real-world assets are growing. Developer interest stays active, with new projects and improvements regularly added to the ecosystem. These fundamentals help build confidence, as a growing network often creates long-term value for a blockchain.

    Institutional Interest Continues to Rise

    Large financial firms have shown increasing interest in digital assets over the past year, and the E*Trade rollout adds another example. Institutional participation brings credibility and can improve market liquidity. While institutional support does not guarantee higher prices, it often becomes a key factor during sustained market growth.

    What Could Support the SOL Price?

    Several factors may support Solana in the months ahead: easier access through a major brokerage, continued network expansion, low transaction costs, and fast processing speeds. These features attract developers and projects. If stablecoin use, DeFi, and tokenized assets continue to grow, the ecosystem could become even stronger.

    Risks Still Remain

    Despite positive news, risks remain. Cryptocurrency is volatile, and prices can decline sharply. Competition from Ethereum and other smart contract platforms is intense, and regulatory changes or network issues could affect sentiment. Strong fundamentals alone do not always lead to immediate price gains.

    Price Outlook

    At the latest update, Solana traded at around $77.97. The E*Trade listing represents an important milestone, exposing SOL to millions of mainstream retail investors. Combined with robust network activity and rising institutional adoption, the long-term fundamentals appear solid. However, future price movement will still depend on broader crypto market conditions, particularly Bitcoin’s influence and overall investor sentiment.

  • BlockDAG Aftersale Offers BDAG at $0.0000077 with 22% Discount Amid Bittensor and Litecoin Consolidation

    BlockDAG Aftersale Offers BDAG at $0.0000077 with 22% Discount Amid Bittensor and Litecoin Consolidation

    Monitoring shifting market setups often requires analyzing a mix of technical indicators and fundamental developments across the crypto market. Traders closely track the Bittensor price for signs of a technical breakout, while long-term investors weigh institutional developments behind the Litecoin price prediction. Beyond chart consolidations, participants searching for the best crypto to buy now frequently evaluate active direct allocation opportunities. BlockDAG (BDAG) is currently taking center stage with its live Aftersale event, offering BDAG at $0.0000077 alongside Instant Full Allocation and an immediate 22% discount for Live Swap purchases.

    This analysis reviews current technical patterns for Bittensor, examines institutional backing for Litecoin, and breaks down how BlockDAG’s operational deliverables position it in today’s market.

    Is the Bittensor Price Prepping for a Major Breakout?

    After months of persistent selling, the Bittensor price is finally showing signs of life as buyer momentum returns to the decentralized AI sector. Trading around $198, TAO has been squeezing into an increasingly tight consolidation range. While recovery attempts since June have continually stalled below major resistance, downside pressure has simultaneously dried up.

    A firm support floor near $170.5 continues to hold strong, bolstered by stabilizing momentum metrics like a steady RSI and a neutral MACD. Behind this consolidation lies a powerful fundamental tailwind: December’s halving slashed daily emissions in half to 3,600 TAO, dramatically easing supply pressure. Meanwhile, structural enhancements like the v431 protocol upgrade are expanding real utility across decentralized subnets.

    If bulls can decisively clear the critical $202–$220 resistance barrier, a sharp rally toward $260 could quickly materialize. Until then, patience remains essential as this coiled market prepares its next big move.

    Could Institutional Backing Trigger a Bullish Litecoin Price Prediction?

    Litecoin (LTC) is quietly turning heads as it coils inside a four-year consolidation phase, trading around $47.52 amidst strengthening market sentiment. A major driver powering this optimism is global investment giant T. Rowe Price including Litecoin among 15 selected digital assets in its actively managed TKNZ ETF. This high-profile inclusion from a $1.8 trillion asset manager firmly validates Litecoin’s standing as an institutionally credible network.

    Prominent analysts point out that LTC’s multi-year accumulation between $30 and $40 has built a remarkably strong foundation for the next major leg up. While reaching ambitious targets like $100, $300, or $500 remains speculative, the combination of institutional adoption and structural support adds serious credibility to an optimistic Litecoin price prediction. If broader market momentum turns, this extended consolidation period could be the springboard for LTC’s long-awaited breakout.

    BlockDAG Aftersale Drops BDAG to $0.0000077 with 22% Swap Discount

    Following the completion of its buyback program, BlockDAG has launched its Aftersale event, offering participants direct access to BDAG tokens at $0.0000077. Investors entering during this active window secure Instant Full Allocation on their purchase, while those utilizing the Live Swap option receive an immediate 22% discount compared to current rates on CoinMarketCap.

    This promotional phase arrives during a period of rapid development across the entire project. BlockDAG continues to advance key infrastructure milestones, leading up to Vision Keynote 6 on July 30 and the upcoming deployment of the proprietary BlockDAG Exchange. Physical operations are also expanding as the initial shipment of mining hardware reaches early buyers this week. Meanwhile, the gaming ecosystem is demonstrating substantial utility, with its integrated Casino and Sportsbook passing $200 million in cumulative wagering volume.

    By combining direct pricing incentives with measurable operational execution, BDAG presents a clear case for investors looking for the best crypto to buy now. Rather than asking buyers to wait on future promises, the project is delivering physical equipment, building exchange infrastructure, and offering full allocation discounts simultaneously. For participants seeking to expand their portfolio holdings before the next major expansion phase, this live Aftersale window provides an immediate entry point.

    Wrapping Up!

    The Bittensor price shows signs of technical compression that could lead to a swift rally if key resistance levels break. Simultaneously, institutional backing adds weight to an optimistic Litecoin price prediction for investors targeting established networks. However, BlockDAG sets itself apart by providing immediate, tangible value during its active Aftersale event. With BDAG available at $0.0000077, Instant Full Allocation, a 22% Live Swap discount, and ongoing distribution of physical mining units, the project combines strong incentives with clear operational milestones. For investors weighing top market opportunities, BlockDAG stands out as a top candidate for the best crypto to buy now.

    AFTERSALE: https://purchase.blockdag.network
    Website: https://blockdag.network
    Telegram: https://t.me/blockDAGnetworkOfficial
    Discord: https://discord.gg/Q7BxghMVyu

    Join our WhatsApp Channel to get the latest news, exclusives and videos on WhatsApp

    Disclaimer: Analytics Insight does not provide financial advice or guidance on cryptocurrencies and stocks. Also note that the cryptocurrencies mentioned/listed on the website could potentially be risky, i.e. designed to induce you to invest financial resources that may be lost forever and not be recoverable once investments are made. This article is provided for informational purposes and does not constitute investment advice. You are responsible for conducting your own research (DYOR) before making any investments. Read more about the financial risks involved here.

  • Solana Price Forecast 2026: Could SOL Reach $100? Expert Analysis and Key Levels

    Solana Price Forecast 2026: Could SOL Reach $100? Expert Analysis and Key Levels

    Solana (SOL) remains one of the most closely watched cryptocurrencies in 2026. After a sharp correction earlier this year, the token has shown fresh signs of strength, and traders are now focused on one key question: Can SOL return to the $100 mark before the end of 2026?

    At the time of writing, Solana trades near $77, with a market capitalization of approximately $45 billion and daily trading volumes exceeding $2 billion. Large investors, crypto funds, and retail traders continue to monitor Solana closely, given it hosts one of the most active blockchain ecosystems in the market.

    Key Takeaways

    • Solana trades near $77 with strong support between $70 and $77.
    • A breakout above $84 could open the path toward the $100 milestone.
    • Healthy ecosystem growth and institutional interest continue to support long-term optimism.

    Solana Price Shows Signs of Stability

    The latest daily TradingView chart presents a market that has calmed significantly after weeks of heavy price swings. SOL trades around $76.98, very close to its 20-day moving average at $77.53. This indicates that buyers and sellers currently have nearly equal control over the market.

    The Bollinger Bands also show that price has entered a healthy range. The upper band sits near $84, while the lower band stands close to $71. Since the price remains between these two levels, Solana has room for a move in either direction. A close above the upper band could bring fresh buying interest, while a fall below the lower band may invite another round of selling.

    The Relative Strength Index (RSI) stands near 51, pointing to a balanced market. This level does not suggest SOL is overbought or oversold. After the weak momentum seen in June, this recovery in RSI reflects improved market confidence.

    The $84 Level Has Become the Key Barrier

    The resistance zone between $80-$84 is clearly visible on the chart. SOL has struggled to push past this zone for several weeks. If buying pressure does push the price beyond this level, market sentiment could shift very quickly. This level carries important value because many traders place orders around round numbers, and breaking $84 might convince those waiting for confirmation to enter the market. Below $75-$77, strong support exists at $70-$71.

    Strong Network Activity Supports Solana

    Price is only one part of the story. Solana continues to show healthy growth across its blockchain network. Activity within decentralized finance (DeFi), stablecoins, and tokenized real-world assets remains strong. Many developers still choose Solana for its fast transaction speed and low costs.

    Institutional Interest Remains Strong

    Large financial firms continue to watch Solana closely. Throughout 2026, reports have linked fresh buying interest to possible exchange-traded fund (ETF) developments and stronger participation from institutional investors. These investors typically focus on projects with active ecosystems and reliable technology. Solana fits both criteria, and this steady institutional attention has helped improve market confidence after the weakness seen earlier this year.

    Recent Ecosystem Growth Adds More Confidence

    Several key Solana milestones have occurred in 2026. The ecosystem has continued to grow steadily in terms of usage and number of users. Increased usage implies a continued high degree of user trust in the network.

    What Could Stop SOL From Reaching $100?

    Despite the positive outlook, several risks exist. Global economic uncertainty can reduce demand for risky assets like cryptocurrencies. Profit-taking near the $84 to $90 area could also slow any rally. Another factor is future token unlocks: if additional SOL enters the market while demand remains weak, selling pressure may increase temporarily. Regulatory decisions across major economies also remain an important factor for every cryptocurrency project.

    Expert Price Prediction for 2026

    Current technical signals and network growth suggest Solana has a realistic chance to reach $100 during 2026. The chart shows a market that has recovered from June’s weakness and started building a stronger base.

    • Bearish case: SOL trades between $65 and $75 if the overall crypto market loses momentum again.
    • Base case: A move toward $85 to $95 as adoption continues at its current pace.
    • Bullish case: Solana reaches between $100 and $115 if buyers clear the important $84 resistance with strong trading volume.

    Why This Matters

    Solana’s consolidation near $77 highlights its resilience after earlier volatility. Successfully breaking the key $84 resistance could trigger a massive wave of buying momentum, positioning SOL for a realistic run toward the psychological $100 milestone.

    Final Outlook

    Solana enters the back half of 2026 from a vastly more confident and comfortable standpoint than even a few weeks ago. Chart evidence shows greater price resilience, a balanced distribution of upward/downward pressure, and an identifiable base around $70. Moreover, the network remains consistently healthy, and investor interest—including continued institutional support—is solid.

    In the coming weeks, the market needs to make a definitive move. An aggressive break above $84 could quickly shift sentiment and begin targeting $100 again. While such a move is pending, Solana is in a sound consolidation period rather than bearish territory.

    All told, technical indicators support the possibility that Solana could visit $100 in 2026. As long as the broader crypto market does not falter, buyers may find it within their means to defend $70 and push toward the triple-digit mark.

    FAQs

    What is Solana’s current price and market standing?
    Solana is trading around $77 with a market capitalization of approximately $45 billion and robust daily trading volumes exceeding $2 billion.

    Can Solana reach $100 in 2026?
    Yes. Technical indicators and steady network growth suggest a return to $100 is highly achievable in 2026, provided SOL breaks through key immediate resistance levels.

    What is the most critical price level to watch?
    The $84 mark is the crucial resistance barrier. Pushing past this zone is expected to shift market sentiment rapidly from cautious consolidation to highly bullish.

    What is backing Solana’s underlying value?
    Beyond price action, Solana’s valuation is supported by thriving DeFi activity, expanding stablecoin volumes, and rising interest from institutional asset managers.

    What risks could prevent SOL from hitting triple digits?
    Potential roadblocks include broader macroeconomic downturns, sudden regulatory shifts, and profit-taking pressures as the price nears the $84 to $90 range.

    Disclaimer: This article is for informational purposes only and does not constitute investment advice. Cryptocurrencies are volatile and involve financial risk. Always conduct your own research (DYOR) before investing.