
Tag: price target

  • Peter Brandt Highlights $5.40 XRP Price Target as 2026 Correction Reshapes Long-Term Outlook

    Peter Brandt Highlights $5.40 XRP Price Target as 2026 Correction Reshapes Long-Term Outlook

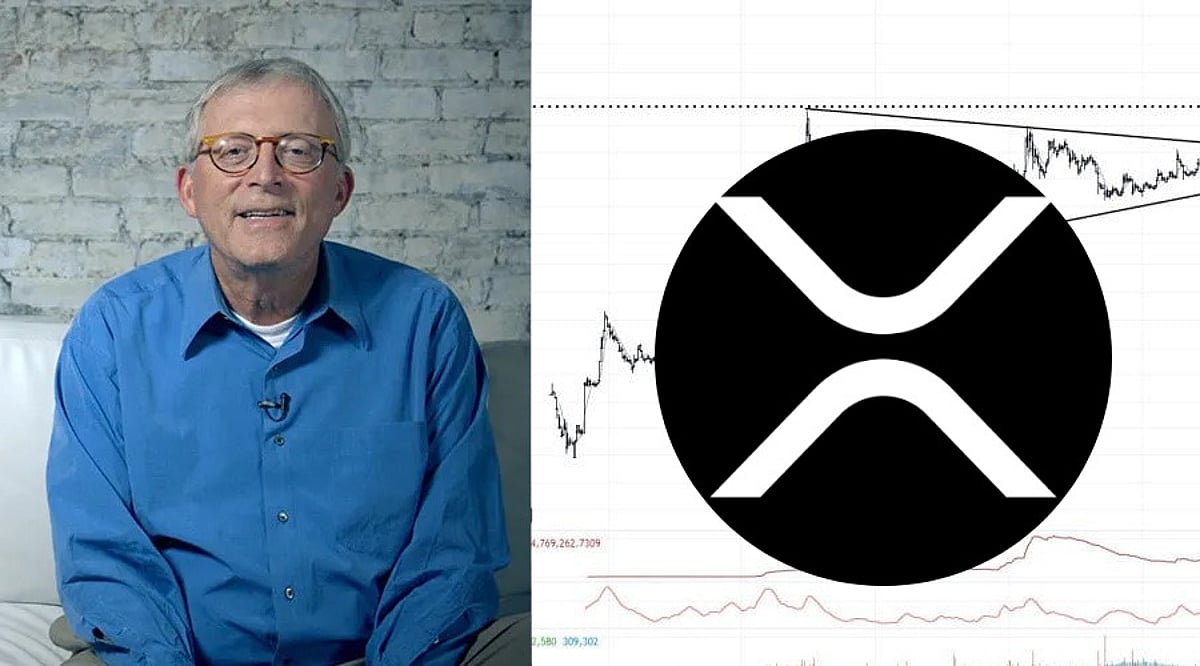
    Veteran trader Peter Brandt has pointed to $5.40 as a potential long-term target for XRP in a monthly chart shared on September 21. The projection is based on a technical structure that has formed over nearly a decade, although Brandt did not specify a timeline for the move.

    What the Monthly Chart Shows

    Brandt’s XRP/USD chart tracks roughly ten years of price action and highlights both a rising support line and a descending resistance line. The resistance line begins at the 2018 cycle peak, while support has been drawn from lows recorded in 2020 and subsequent pullbacks.

    Between those two boundaries, XRP spent several years compressing in a broad range. The 2021 rally produced a high below the 2018 peak, keeping the downward-sloping resistance intact. That pattern eventually led to a breakout in 2024–2025, with monthly candles climbing toward the $3.00–$3.50 zone — the highest sustained area since 2018.

    Current Price Position

    After the sharp advance, XRP entered a correction in 2026. The latest part of the chart shows a pullback unfolding in a smaller descending channel or wedge. In September 2026, XRP was trading near $1.4901, roughly 20.6% below its 18-month moving average of about $1.877. A faster moving average sits closer to price, but the longer-term trend measure remains above the token.

    Interpreting the $5.40 Objective

    Brandt described $5.40 as an eventual technical objective rather than an active trade. The figure is not drawn as a horizontal line directly on the chart, and the trader did not provide a completion date.

    From the chart’s displayed price near $1.49, XRP would need to gain approximately 262% to reach $5.40. Based on the slightly higher market price near $1.54, the required advance would be about 251%, placing the target at roughly 3.5 times the reference price.

    XRP was reported near $1.54 after gaining around 8.7% in 24 hours as Brandt’s chart drew attention. Even so, the token remains far below the projected level. The key tension in the setup is that XRP is still under its 18-month moving average and trading inside a declining structure from the 2025 highs, even as the broader multi-year formation supports a much higher long-term target.

    Brandt’s use of the word “eventual” leaves the timing open. For traders watching the trend, the main question is whether the current descending structure resolves before the next major monthly advance begins.

  • Ethereum Rebounds on Double Bottom Pattern, Eyes $2,163 Target

    Ethereum Rebounds on Double Bottom Pattern, Eyes $2,163 Target

    Ethereum has staged a notable recovery, rebounding from a key support level and forming a bullish double bottom pattern on the daily chart. This technical setup, characterized by two consecutive lows around the same price zone followed by a breakout above the neckline, suggests that selling pressure has exhausted and buyers are gaining control. Analysts now see a clear path toward the $2,163 target, provided the momentum holds.

    At press time, ETH is trading near $1,920, up roughly 2.5% in the past 24 hours. The cryptocurrency maintains a market cap of about $232 billion, with 24-hour trading volume exceeding $12 billion, signaling renewed investor interest after a period of subdued activity.

    Double Bottom Pattern Signals Bullish Reversal

    The double bottom pattern formed after Ethereum tested the $1,850–$1,870 support zone twice. Both times, buyers stepped in to defend the level, creating a W-shaped structure. The pattern was confirmed when ETH broke above the neckline resistance, and the measured move target—derived from the distance between the support and the neckline—points to $2,163.

    Key Levels to Watch

    The first major hurdle is the psychological $2,000 mark. A sustained close above this level could accelerate buying and open the door to $2,163. Beyond that, the next resistance sits near $2,250, where previous selling pressure emerged. On the downside, support remains solid between $1,870 and $1,900. As long as ETH stays above this zone, the bullish structure remains intact.

    Institutional Demand and Network Fundamentals

    Institutional interest in Ethereum remains strong. Large investment firms continue to accumulate ETH, viewing it as more than just a digital asset—it powers thousands of decentralized applications. The growing amount of staked Ether also reduces circulating supply, providing a tailwind for prices when demand rises.

    Ethereum’s development roadmap includes upgrades planned through 2029 aimed at improving speed, security, and scalability. These enhancements reinforce long-term confidence among investors and maintain Ethereum’s dominant position in DeFi, stablecoins, and tokenized assets.

    Broader Market Sentiment Lifts Ethereum

    The overall cryptocurrency market has turned more positive. Bitcoin’s stability has allowed altcoins like Ethereum to rally. Improved economic conditions and reduced uncertainty have encouraged fresh capital inflows. This shift in sentiment, combined with technical strength, supports the case for continued upside.

    With the double bottom breakout confirmed, rising trading volumes, institutional backing, and ongoing network upgrades, Ethereum’s recovery appears well-supported. The $2,000 resistance is the immediate focus; a break above it could pave the way toward the $2,163 technical target.