
Tag: support level

  • Angel Investor Jason Calacanis Praises Solana and Bittensor as SOL Holds Key Support Level

    Angel Investor Jason Calacanis Praises Solana and Bittensor as SOL Holds Key Support Level

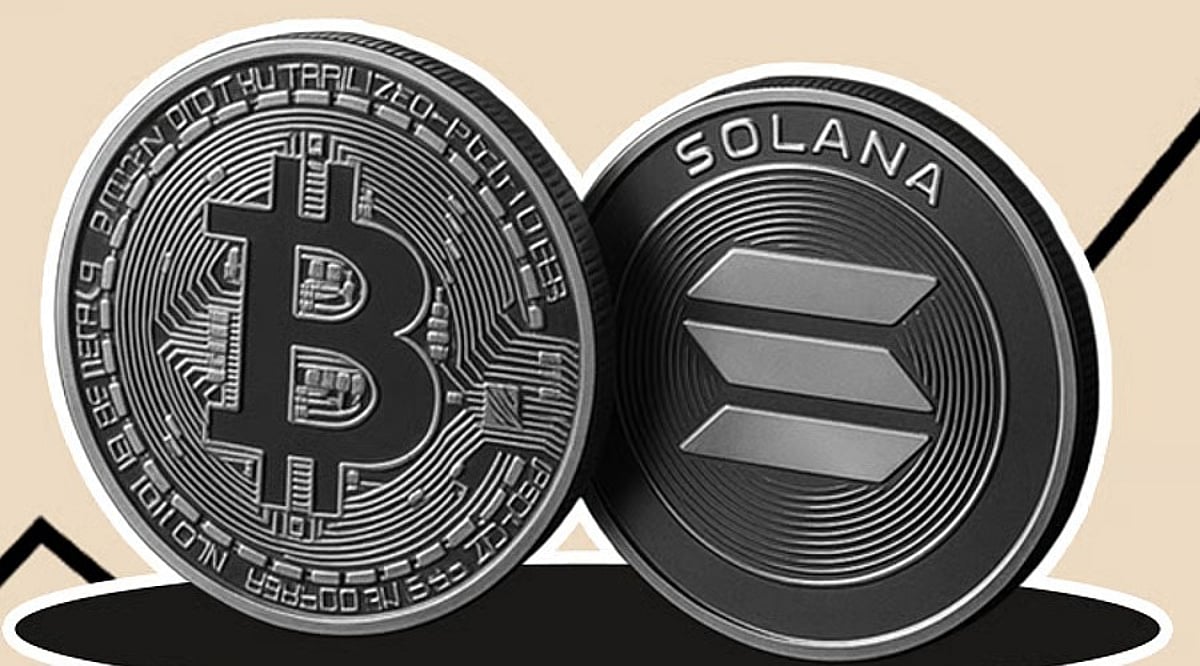
    Prominent angel investor Jason Calacanis has renewed his criticism of Bitcoin while praising Solana and Bittensor as projects that deliver usable products. His remarks came as SOL traded near $74 within a key weekly demand zone, with traders watching to see if support holds and whether the price can break its short-term downtrend.

    Calacanis Shifts from Solana Skepticism

    Calacanis said he would advise his brother to sell half of any Bitcoin holdings and redirect the proceeds into “productive projects” such as Solana and Bittensor. He noted that both networks are delivering new products rather than relying solely on future promises, marking a clear shift from his earlier public stance on Solana.

    In late 2024, Calacanis said he had never owned SOL and questioned whether the network offered meaningful applications beyond market speculation. He repeated that position through early 2025 while stating he owned only Bitcoin. More recently, he has pointed to entrepreneurs building on TAO and SOL, though he has not disclosed any investment in either token or any direct relationship between Solana Labs and his venture firm.

    Bitcoin Strategy Criticism Remains

    Calacanis still describes himself as a longtime Bitcoin holder, but he has repeatedly criticized Strategy (formerly MicroStrategy) co-founder Michael Saylor. He argues that Strategy has grown too influential within the Bitcoin market and distorted the broader narrative. Calacanis urges investors to buy Bitcoin directly instead of gaining exposure through Strategy shares, saying the company’s financing model creates risks that direct ownership avoids.

    He has stated he would never buy Strategy stock, even after a steep price decline, and rejected any taxpayer-funded rescue if the company faced serious financial trouble. His criticism focuses on Strategy’s financing structure rather than Bitcoin ownership itself.

    SOL Holds Weekly Demand Near $74

    Solana is trading inside a broad weekly demand zone stretching from about $64 to $75. Buyers have responded several times within that range, making the region central to the current Solana price outlook. SOL recently slipped below a previous low near $68 before recovering above it, a move that may represent a liquidity sweep.

    However, the 12-hour chart structure continues to show lower highs and a descending trendline. A decisive move above the $80 to $84 resistance area could open a path toward $92.91, then approach a market-structure level near $98. On the downside, $68.44 remains the nearest important support. A weekly close below that level could expose the lower demand area near $64, weakening the immediate bullish setup.

    Until SOL clears the descending trendline and completes a successful retest, a move toward $90 remains conditional. Another decline may also help traders assess whether the market has formed a bottom resembling Solana’s 2022 price structure.

    Conclusion

    Calacanis has shifted from questioning Solana’s utility to describing SOL and TAO as productive networks, while maintaining his criticism of Bitcoin-linked Strategy shares. For traders, SOL’s next signal depends on holding $68.44 and breaking $80–$84 before the projected move toward $90 gains confirmation.

  • HYPE Token Tests $51 Support as Hyperliquid Rolls Out HIP-4 on Testnet

    HYPE Token Tests $51 Support as Hyperliquid Rolls Out HIP-4 on Testnet

    HYPE slipped below $52.5 on August 1, remaining inside a descending channel despite Hyperliquid’s permissionless HIP-4 testnet rollout. The open daily candle has not confirmed a breakdown, and attention now centers on $51, where Fibonacci support meets the channel floor.

    HYPE Price Structure Keeps $51 in Focus

    HYPE briefly moved below $52.5 on July 31, then recovered before the daily close. Sellers returned during the next session and pushed the token under that level again. The decline has followed a descending channel since early July. A daily recovery above $52.5 would reverse the latest break, but it would leave the wider bearish structure intact.

    The next support sits near $51, where the 0.5 Fibonacci retracement meets the channel’s lower boundary. Can buyers defend $51 before the channel breaks? A daily close below $51 would carry greater weight than the intraday move under $52.5. That close would break both the Fibonacci level and the channel floor.

    The chart shows limited support below that point until approximately $47. HYPE traded near $47 from May 17 through May 20 before starting its advance toward the record high. This earlier consolidation could attract buyers again, although the level represents a zone rather than a fixed floor. A fall toward $47 would also erase more than 40 days of gains.

    HIP-4 Testnet Access Expands Market Development

    Hyperliquid announced the first permissionless HIP-4 deployments on testnet on July 31. The change lets developers test their own outcome markets through the platform. HIP-4 supports fully collateralized contracts that settle within fixed ranges. Developers can use the standard for prediction markets, event contracts, and products that resemble options.

    Unlike perpetual futures, these contracts avoid open-ended exposure. Hyperliquid still plans to add configurable fees and more testnet market templates as development continues. The rollout expands the platform’s available tools, but current activity remains small. Blockworks data places HIP-4 open interest near $182,000 and notional volume near $881,000.

    Sports contracts account for most open positions. Open interest has fallen since the 2026 FIFA World Cup ended earlier in July, reducing activity across early event markets. Permissionless access could support markets tied to economic data, elections, and other measurable events. Platform rules and applicable regulations would still govern those products.

    Resistance and Oracle Risks Shape the Outlook

    A rebound above $52.5 would face stronger resistance between $56 and $57. The zone includes the channel ceiling, the 0.382 Fibonacci level, and the 100-day simple moving average. An intraday move into that area would not change the trend. HYPE would need a daily close above the cluster and continued strength to weaken the descending channel.

    Price remained inside that channel after Hyperliquid announced the HIP-4 milestone. The reaction showed no immediate increase in HYPE demand from the testnet update. Operational risks also remain relevant as Hyperliquid opens deployments to more developers. A separate HIP-3 market recently showed how external pricing can affect leveraged contracts.

    Crypto.news reported that the xyz:SKHX contract briefly fell about 17.9% after a low South Korean pre-market trade affected its oracle price. Trade.xyz deployed and operated that market, which tracks SK Hynix shares and offers leverage up to 10 times. The company continues investigating and plans an update after its review.

    Conclusion

    HYPE remains inside its descending channel after losing $52.5 during the August 1 session. The $51 area now combines Fibonacci support with the channel floor, while HIP-4 testnet access expands development. Daily closes around $51 and $56 to $57 will define the next structural move.

  • Dogecoin Price Analysis: Can $0.07 Support Hold or Will Bears Push Lower?

    Dogecoin Price Analysis: Can $0.07 Support Hold or Will Bears Push Lower?

    Dogecoin is currently trading near $0.072 after once again testing the critical $0.07 support level. Buyers defended this zone on Friday, but the subsequent rebound has yet to break through the nearest resistance barrier. The next direction for the meme coin hinges on whether it can hold above $0.07.

    Dogecoin Tests Breakout After Double Bottom

    Dogecoin recently climbed above a descending trendline that had capped gains since May. Trader Tardigrade linked this move to a double-bottom pattern near $0.07. The setup formed after the price touched the same support level twice and bounced back each time. This structure contrasts with the price action seen near the May peak, where two highs appeared before sellers took control. The current chart shows two lows at the same level, which may indicate weakening selling pressure. However, buyers must protect the breakout area to give the pattern stronger credibility.

    Near-term resistance is between $0.075 and $0.079. Dogecoin reached $0.0753 on July 14, but buyers failed to hold that gain. The price then fell for two sessions before bouncing from $0.07. A close above $0.079 could open the door to $0.084, with the larger test zone between $0.09 and $0.10.

    $0.07 Support Controls the Next Price Move

    The $0.07 level sits within a broader demand zone stretching from $0.05 to $0.08. Dogecoin has traded around this area during previous market bottoms, and buyers have returned near the same range during the latest decline. Holding this zone does not confirm a full reversal. DOGE still needs higher weekly lows, stronger buying volume, and a break above $0.10. If that happens, traders may target $0.15 and $0.20, both of which were active trading levels during earlier rallies.

    The downside scenario would strengthen if Dogecoin closes below $0.07 and fails to recover. Sellers could then target $0.067, followed by $0.065. A wider decline could pull the price deeper into the $0.05 to $0.08 band, weakening the early recovery setup and extending the current range.

    Liquidation Data Shows Limited Pressure on Bears

    CoinGlass recorded no Dogecoin short liquidations during a 12-hour period. Short liquidations occur when rising prices force bearish traders to close leveraged positions. The zero reading indicates that the rebound did not generate enough pressure to trigger forced exits during that window. Meanwhile, long traders faced losses: about $27,000 in long liquidations over 12 hours, and across a broader window, $153.82k in long liquidations versus $28.38k in short liquidations.

    The narrow gap between the two sides aligns with Dogecoin’s limited daily price moves. DOGE traded about 0.96% higher near $0.072 at the time of the data. The absence of short liquidations may also suggest that bearish traders reduced risk after the earlier drop. A wider sell-off in chip stocks also affected crypto markets after a brief rally tied to softer inflation data. Dogecoin gave back part of its advance as traders reduced exposure to risk assets.

    For now, $0.07 remains the key support, while $0.075 to $0.079 forms the first recovery barrier. The coming sessions will determine whether buyers can defend the line or if bears will extend the selloff toward $0.065.

  • XRP Price Analysis: Can Ripple Recover Amid Slowing Whale Activity and ETF Demand?

    XRP Price Analysis: Can Ripple Recover Amid Slowing Whale Activity and ETF Demand?

    XRP is trading near $1.09 as whale activity and ETF demand weaken, leaving investors questioning its next move. The cryptocurrency has dropped about 2% in the last 24 hours, with daily trading volume above $1.1 billion and a total market value close to $68 billion. Despite the decline, XRP remains the sixth-largest cryptocurrency by market capitalization.

    Large investors, known as whales, have historically played a major role in XRP price movements. However, recent blockchain data shows Binance whale withdrawals have dropped to around 885 million XRP, the lowest level in over two months. This suggests major holders are becoming more cautious. Additionally, large XRP transactions have become less common, coinciding with weaker institutional interest. While this does not guarantee a sharp decline, it removes a key source of buying support.

    Exchange-traded funds (ETFs) have been a major topic in the crypto market, but recent figures show XRP investment products recorded about $7.18 million in net outflows. This marks a shift from stronger inflows earlier in the year, reflecting a cautious mood across the wider market. Many investors are waiting for better conditions before committing new capital.

    Technically, XRP is near a crucial support zone between $1.08 and $1.10. Buyers have defended this range multiple times in recent months. If XRP stays above this level, a recovery could target $1.20, then $1.35, and potentially $1.50. On the downside, $1.00 remains the key support; a break below could increase selling pressure.

    Despite market weakness, Ripple continues to expand its global payment network and develop the XRP Ledger. Recent projects focus on tokenized assets, decentralized finance, stablecoins, and business solutions. Regulatory approvals in Europe could accelerate adoption among banks and financial institutions.

    Market sentiment around XRP is mixed. Some investors are optimistic about Ripple’s business growth, while others remain cautious due to slowing whale activity and ETF demand. The broader crypto market also influences XRP, with Bitcoin and other major assets often setting the direction.

    For XRP to recover, several conditions need to improve: a return of strong whale buying, better ETF inflows, and clearer regulatory frameworks. The next few weeks will be critical. If the $1.08–$1.10 support holds, a move toward $1.20 is possible. If it breaks, sellers may gain control.

    Key Takeaways:

    • XRP holds a crucial support zone between $1.08 and $1.10 despite recent selling pressure.
    • Whale activity and ETF inflows have slowed, reducing short-term bullish momentum.
    • Ripple continues to expand its payment network and XRP Ledger, supporting long-term growth.

    FAQs

    1. What is XRP’s current price?
    The token trades near $1.09. It remains the sixth largest cryptocurrency by market capitalization despite a 2% decline over the last 24 hours.

    2. Why has XRP come under pressure?
    Reduced whale activity and a drop in large transactions have weakened buyer support. Additionally, institutional investors have pulled money out, leading to $7.18 million in net ETF outflows.

    3. What is the key support level for XRP?
    The immediate support zone lies between $1.08 and $1.10. If sellers break this range, the next vital psychological and technical floor to watch rests at $1.00.

    4. Can XRP recover in the coming weeks?
    A recovery remains entirely possible. However, the market first needs to see a return of aggressive whale buying, positive institutional ETF inflows, and improved momentum across the broader cryptocurrency landscape.

    5. What could drive XRP higher?
    Future gains depend on renewed whale accumulation and stronger institutional investment. Long-term growth could also be triggered by clearer global regulations and the ongoing expansion of Ripple’s cross-border network.

  • Dogecoin Holds Critical Support Level as Traders Await Next Breakout Signal

    Dogecoin Holds Critical Support Level as Traders Await Next Breakout Signal

    Dogecoin is currently trading at a key support zone, with buyers and sellers locked in a tug-of-war that will determine whether the meme coin rallies or slides further. Instead of a sharp decline, DOGE has pulled back into a familiar safety area, giving bulls a clear line to defend. However, the market lacks decisive breakout momentum, leaving traders focused on volume and price action for confirmation.

    Support Zone Keeps Buyers Engaged

    Dogecoin remains above a known support level, allowing buyers to stay active despite recent cooling. The pullback has not triggered widespread selling, keeping the price within a range that traders continue to monitor closely. Without a clear breakout, the market is debating whether this range represents accumulation or a temporary pause before another decline.

    Dogecoin has historically recorded sharp moves after consolidation periods, drawing attention to the current setup. Yet momentum has not delivered the clear signal many participants are waiting for.

    Volume Remains the Critical Factor

    Despite holding support, Dogecoin risks weakening momentum if trading activity does not pick up. Meme-based cryptocurrencies rely on sustained market participation, making fresh volume essential for any recovery attempt. Without stronger buying interest, a rebound from support could quickly lose steam. Traders are treating the current structure as a level-driven setup rather than confirmation of a sustained rally.

    Traders Focus on Verifiable Market Signals

    Beyond price action, market participants are evaluating developments through measurable activity rather than headline-driven speculation. Traders are monitoring confirmed filings, integrations, regulatory updates, wallet activity, and other verifiable data before adjusting their outlook. The broader crypto market is responding to multiple catalysts—exchange listings, ETF flows, legal developments, protocol upgrades, and changing liquidity conditions—rather than a single dominant narrative.

    Each confirmed development provides another data point instead of guaranteeing an immediate price reaction. Traders are watching whether follow-up information supports the initial signal or weakens the narrative.

    What’s Next?

    Dogecoin continues to trade above a key support level as traders monitor resistance, volume, and momentum for confirmation of the next move. While the current range has not produced a breakout, verified market signals and price action remain the primary indicators to watch in the coming sessions.

  • Shiba Inu Whales Withdraw 174.8 Billion SHIB as Price Holds Key Support

    Shiba Inu Whales Withdraw 174.8 Billion SHIB as Price Holds Key Support

    Shiba Inu whales have pulled a massive 174.8 billion SHIB tokens from exchanges over the past 24 hours, signaling accumulation despite the meme coin’s ongoing price decline. Data from CryptoQuant reveals a negative exchange net flow as SHIB successfully defended the $0.0000040 support level. At the current price of $0.00000417, the withdrawn tokens are valued at approximately $792,002.

    Such transfers typically move coins into self-custody or third-party wallets, reducing the supply available for immediate sale. The total SHIB balance on exchanges has slipped to 86.6 trillion tokens. If demand increases while exchange reserves continue to fall, supply conditions could tighten, potentially supporting price recovery.

    Derivatives activity also picked up, with open interest in SHIB futures rising 5.7% to $28.8 million (representing about 6.52 trillion SHIB). However, open interest remains about 80% below its January peak of $145.5 million, reflecting cautious trading amid broader market weakness.

    From a technical perspective, SHIB continues to trade above the $0.0000040 support zone after touching $0.00000408 on Monday. Buyers have defended this level repeatedly, and attention now turns to the descending resistance trendline that has capped gains since May 10. A breakout above that line would clear the next technical barrier.

    The number of SHIB wallets has surged to a record 1,676,535, with nearly 75,000 new holders added between July 5 and July 6. While some observers suggest the sudden spike could stem from a technical glitch, the overall trend underscores growing retail interest.

    Market participants will watch whether these on-chain trends—whale accumulation, declining exchange supply, rising open interest, and record wallet counts—translate into price momentum in the coming days.

  • Dogecoin Faces Key Support at $0.072 as ETF Inflows Stall and Selling Pressure Mounts

    Dogecoin Faces Key Support at $0.072 as ETF Inflows Stall and Selling Pressure Mounts

    Dogecoin traded near $0.0729 on July 12, 2026, after falling nearly 2% in the past 24 hours, underperforming a slightly weaker crypto market. Trading volume rose to about $462 million as sellers increased activity around the weekend.

    The decline comes as traders reduce exposure to riskier altcoins and shift more capital toward Bitcoin. DOGE now sits close to the $0.072 support zone. A hold above that level could lead to consolidation or a breakout above $0.08, while a lower move may expose the $0.070 area.

    Dogecoin ETFs Record a Week Without Inflows

    U.S. Dogecoin exchange-traded funds recorded zero net inflows on every trading day from July 6 through July 10. The flat week followed negative net flows in the prior period, showing that investors have not added fresh capital to the products.

    Cumulative net inflows into Dogecoin ETFs stand at $11.77 million. The products hold about $10.23 million in net assets, equal to roughly 0.09% of Dogecoin’s market value. The limited size shows that ETF activity has not created strong demand for DOGE.

    The funds linked to Bitwise, Grayscale and 21Shares have shifted between positive, negative and flat weekly flows during 2026. The latest reading points to a “wait-and-see” approach as investors look for a new market or product catalyst. Meanwhile, 21Shares plans to use FTSE digital asset index data for its Dogecoin ETF pricing benchmark.

    Bitcoin Dominance Pressures Altcoin Prices

    The wider market has moved toward Bitcoin as sentiment stays in the “Fear” range. Bitcoin dominance reached 58.43%, showing that the largest cryptocurrency controls a growing share of total market value.

    The Altcoin Season Index stood at 52, indicating mixed demand for smaller tokens. Dogecoin often reacts sharply when traders cut speculative exposure. The current decline follows that wider pattern rather than a Dogecoin-specific event. Rising Bitcoin dominance tends to place pressure on meme coins as traders favor assets with deeper liquidity.

    At the same time, the Fear and Greed Index has moved above earlier extreme fear readings. The index recently reached 32, but it has not held above the neutral level of 50 since November. That reading shows an exit from panic without a clear return of strong buying demand.

    Technical Data Puts $0.072 Support in Focus

    DOGE moved below its seven-day simple moving average at $0.0744 and its 30-day average at $0.0786. Trading volume rose as the price fell, confirming higher market activity during the sell-off. The relative strength index reached 36, placing DOGE near oversold conditions.

    The lower RSI could support a short-term bounce, but Dogecoin needs to reclaim $0.074 to reduce selling pressure. A move above the seven-day average would place the next focus on $0.0786. Failure to hold $0.072 could send the price toward the next support near $0.070.

    ETF flows may also shape short-term sentiment. Positive inflows would show renewed demand for regulated Dogecoin products. Until buying returns, price action, trading volume and Bitcoin dominance will provide the main signals for DOGE’s next move.

  • XRP Price Slides to $1.09 as Active Addresses Hit 2026 Lows and ETF Outflows Return

    XRP Price Slides to $1.09 as Active Addresses Hit 2026 Lows and ETF Outflows Return

    XRP traded at $1.09 after falling 1.39% over the past 24 hours, underperforming the broader crypto market as network activity, institutional demand, and derivatives trading weakened.

    The total crypto market value slipped 0.58%, while Bitcoin fell 0.62%. XRP faced additional pressure from declining active addresses, exchange-traded fund (ETF) outflows, and reduced leveraged trading. However, whale accumulation and negative valuation metrics suggest long-term positioning remains intact.

    XRP Ledger Activity Falls to 2026 Lows

    Daily active addresses on the XRP Ledger dropped to 25,350 on July 11, marking the network’s second-lowest daily reading of 2026. New wallet creation also fell to 2,130, its lowest level since November 2024.

    The decline follows a brief rise in activity during late June, when traders bought XRP during a market pullback. That demand has since faded, leaving the token without enough spot buying pressure to support a stronger rebound.

    Network participation has weakened across multiple timeframes. Active addresses measured over 24 hours, seven days, and 30 days have fallen since January. Whale transaction counts have also moved lower during the same period.

    Meanwhile, XRP Ledger products still provide potential sources of future activity, including RLUSD stablecoin growth, tokenized assets, payment services, and planned lending tools. A rise in these areas could bring more users back to the network.

    XRP ETF Outflows Reduce Institutional Demand

    U.S. spot XRP ETFs recorded $7.29 million in net outflows on July 8, ending a nine-week inflow streak and pushing total assets held by the funds below $1 billion. The change reduced a steady source of institutional buying. ETF inflows had supported demand during previous weeks, but the latest outflow suggests fund investors have adopted a more cautious position.

    Derivatives traders have also reduced exposure. XRP futures open interest on Binance fell to about 397 million XRP, its lowest level in more than three months. Broader market data shows total open interest dropping from $1.32 billion to $764.57 million.

    Lower open interest indicates that traders have closed leveraged positions. This reduces the chance of forced liquidations but also removes buying power that can support short-term price rallies.

    Whale Accumulation Meets Bearish Price Structure

    Large wallets holding between 10 million and 100 million XRP have accumulated tokens throughout 2026. At the same time, wallets holding between 100,000 and 10 million XRP have reduced balances.

    Several market value to realized value measures remain below zero. The 30-day, 180-day, one-year, and three-year readings show that many holders still own XRP below their purchase prices.

    XRP also recorded negative network realized profit and loss readings in early July. An Age Consumed spike on July 1 showed that older tokens moved after long periods of inactivity, which can occur during heavy selling phases.

    Nevertheless, the XRP price remains inside a descending channel that started after its July 2025 peak near $3.65. Immediate support sits near $1.07, followed by the $1.00 psychological level.

    A daily close above $1.15 could open a move toward the channel resistance near $1.22 to $1.28. Buyers would still need to reclaim the $1.40 to $1.60 range to change the wider price structure.

    A break below $1.07 could expose the $1.00 to $1.02 zone, while deeper market weakness may bring $0.80 back into focus.

  • XRP Defends $1.10 Support: ETF Inflows and Technical Setup Suggest $2 Target

    XRP Defends $1.10 Support: ETF Inflows and Technical Setup Suggest $2 Target

    XRP has entered a pivotal phase after pulling back from its 2026 highs above $3. The token is now defending a critical support level near $1.10, with technical indicators flashing oversold signals and institutional inflows remaining strong. Analysts believe that if XRP holds this floor, a rally toward $2 could materialize.

    Technical Indicators Signal Potential Rebound

    The weekly chart shows XRP dipping to $1.1018, just above the lower Bollinger Band at $1.0562. The weekly Relative Strength Index (RSI) has fallen to 33.78, placing the asset in oversold territory — often a precursor to a bounce. Meanwhile, the monthly timeframe reveals buyers steadfastly defending the 20-period simple moving average at $1.1039, which has kept the broader bullish structure intact. The monthly RSI near 41.87 leaves room for additional upside.

    If XRP can maintain its position above $1.10, the next resistance to watch is the weekly Bollinger Band midline at $1.3021. A decisive break above that level could open a path toward $1.54 and eventually the psychological $2 target.

    Institutional Inflows and Regulatory Tailwinds

    Institutional demand continues to provide a strong underpinning. XRP exchange-traded funds have recorded nine consecutive weeks of capital inflows, pushing total assets under management to $1.49 billion. While retail traders have been realizing losses during the recent decline, institutional investors have steadily allocated capital — a pattern that historically precedes a trend reversal.

    Regulatory progress has also bolstered sentiment. Ripple secured a full Crypto-Asset Service Provider license in Luxembourg under the European Union’s Markets in Crypto-Assets (MiCA) framework. This license grants XRP and its stablecoin RLUSD regulated access to banking services across all 27 EU member states. Market participants are also closely monitoring the progress of the US CLARITY Act.

    Growing Utility on XRP Ledger

    Blockchain activity is adding to the narrative. Autonomous artificial intelligence agents have begun using native XRP for direct settlements, surpassing one million transactions and generating utility-driven demand. Moreover, Japanese banks are adopting Ripple’s infrastructure for cross-border remittances, a trend that could expand further.

    XRP also benefited from several exchange-traded fund launches in late 2025. Although those products debuted during a bear market and produced limited price movement, they attracted notable inflows. Similar ETF-driven catalysts have propelled Bitcoin and Ethereum to new all-time highs, and observers speculate that XRP could follow a comparable trajectory when broader market conditions improve.

    Conclusion

    XRP’s ability to hold above $1.10 remains the linchpin for a potential move toward $2. With oversold technical conditions, steady ETF inflows, a favorable regulatory environment in Europe, and increasing on-chain utility, the setup points to a possible upside breakout. Investors will be watching closely whether the token can break through key resistance levels in the coming weeks.

  • Ethereum at Critical Crossroads: Key Support Level Holds the Key to Next Move

    Ethereum at Critical Crossroads: Key Support Level Holds the Key to Next Move

    Ethereum has reached a pivotal moment after a strong upward move, with traders and investors closely watching a key support zone between $1,700 and $1,720. The next few days could determine whether the second-largest cryptocurrency resumes its rally or enters a short-term correction.

    Key Support Zone Under Scrutiny

    The $1,700 to $1,720 area has become the most important support level for Ethereum. Buyers have previously stepped in at this zone, helping the price recover. If Ethereum holds above this support, it could boost buyer confidence and pave the way for further gains. However, a break below this level could shift market sentiment quickly, potentially driving the price down to the next support range of $1,550 to $1,600.

    Resistance at $1,800 Remains the Next Hurdle

    While support holds firm, Ethereum faces strong resistance near $1,800. This level has repeatedly attracted sellers. A daily close above $1,800 with robust volume would be a bullish signal, potentially opening the door to the $1,900 to $2,000 range.

    RSI Signals Strong Momentum

    The Relative Strength Index (RSI) stands at 67.73, indicating that buyers remain in control. However, the RSI is approaching the overbought threshold of 70, which may prompt caution among traders after the recent rally.

    ETF Inflows and Institutional Demand Bolster Outlook

    Spot Ethereum ETFs have seen steady inflows, boosting market confidence. Institutional investors, including firms like Bitmine, have increased their ETH holdings, signaling long-term bullish sentiment. These factors provide a solid foundation for Ethereum’s price.

    Global Economic Factors and Leverage Risks

    Global economic events, particularly US Federal Reserve interest rate decisions, continue to influence cryptocurrency markets. Lower rates tend to support risk assets like Ethereum. Additionally, the futures market shows many leveraged long positions, which could amplify volatility if the price drops below key support.

    What’s Next for Ethereum?

    Ethereum’s immediate future hinges on holding the $1,700-$1,720 support. A successful hold keeps the bullish outlook intact, with the next target at $1,800. A break above $1,800 could lead to a rally toward $1,900 and $2,000. Conversely, a breakdown below support could trigger selling pressure and a drop to $1,550-$1,600. The RSI, ETF demand, and institutional buying will all play key roles in determining Ethereum’s next move.