Tag: US-Iran tensions

  • MCX Gold Slips 0.27% to Rs 1,48,800 Amid US-Iran Tensions and Rising Oil Prices

    MCX Gold Slips 0.27% to Rs 1,48,800 Amid US-Iran Tensions and Rising Oil Prices

    Gold prices on the Multi Commodity Exchange (MCX) declined on September 29 as geopolitical tensions between the United States and Iran over the Strait of Hormuz continued to push energy costs higher, increasing pressure on the Federal Reserve to maintain elevated interest rates.

    October gold futures fell 0.27% to Rs 1,48,500 per 10 grams, while September silver futures dropped 0.46% to Rs 2,46,130. In the international market, Brent crude futures rose 1.80% to USD 107.2 per barrel, and US West Texas Intermediate (WTI) gained 1.75% to USD 94.22 per barrel.

    Domestic Gold Prices

    In India, 24K gold fell by Rs 137 to Rs 1,48,800 per 10 grams, and 22K gold declined by Rs 125 to Rs 1,36,400. City-wise, Mumbai and Kolkata reported prices of Rs 1,48,800, Delhi at Rs 1,48,950, and Chennai at Rs 1,49,080.

    US Gold Prices

    In the United States, gold prices edged higher on Tuesday but remained near their lowest level in over seven weeks amid concerns that the Fed could keep rates higher for longer. Spot gold rose 0.4% to USD 4,130.58 per ounce, while US gold futures fell 0.2% to USD 4,162.20. Spot silver declined 0.9% to USD 60.42, platinum slipped 1.3% to USD 1,697.71, and palladium lost 0.8% to USD 1,205.27.

    Key Levels to Watch

    Christopher Tahir, senior market strategist at Exness, noted: “Geopolitical developments will remain crucial for gold, as continued tensions could keep energy prices and yields elevated, while meaningful progress toward de-escalation could ease pressure. Persistent price pressures combined with resilient activity would reinforce expectations that central banks need to remain restrictive, keeping yields elevated and leaving gold vulnerable to further losses.”

    On the daily chart, XAU/USD trades at USD 4,130, holding below the 20-day, 50-day, and 100-day simple moving averages clustered between roughly USD 4,290 and USD 4,330, which keeps the near-term bias bearish. The Relative Strength Index (14) near 36 suggests weak momentum but not outright oversold conditions, hinting that bears retain control.

    Immediate support is seen at the rising trend-line base near USD 3,990, where dip-buying interest could emerge if the current pullback extends. On the upside, the first resistance band is defined by the 100-day SMA at USD 4,292, followed closely by the 50-day SMA at USD 4,321 and the 20-day SMA at USD 4,325, forming a dense supply zone that gold would need to reclaim to ease bearish pressure.
  • FTSE 100 Dips 18 Points as Rising Oil Prices and US-Iran Tensions Weigh on Sentiment

    FTSE 100 Dips 18 Points as Rising Oil Prices and US-Iran Tensions Weigh on Sentiment

    The FTSE 100 opened 18.66 points lower at 10,793 on Wednesday, dragged down by rising oil prices and ongoing uncertainty surrounding the US-Iran conflict. Brent crude futures climbed 1.60% to $99.49 per barrel, while US West Texas Intermediate (WTI) advanced 1.39% to $94.32 per barrel.

    Sterling traded at $1.3351, down from $1.3548 at Tuesday’s London close, and remained steady against the euro at €1.1643.

    Gainers & Losers

    Gainers: Computacenter rose 3.00% to 5,320p; Aberdeen Group advanced 2.10% to 252.80p; BP gained 1.80% to 560p; SSE added 1.50% to 2,430p; Centrica increased 1.44% to 154.55p; and Reckitt Benckiser Group rose 1.35% to 5,114p.

    Losers: Lion Finance Group fell 1.39% to 13,510p; London Stock Exchange Group declined 1.10% to 8,620p; Coca-Cola HBC dropped 1.00% to 4,544p; Games Workshop Group slipped 0.94% to 17,830p; Diploma lost 0.70% to 7,120p; and Coca-Cola Europacific Partners edged 0.51% lower to 7,830p.

    Energean Profit Jumps 45% in H1

    Energean shares surged over 4% in early trade after reporting first-half earnings ahead of forecasts. Total revenue from production fell 8% to $743 million, and adjusted EBITDAX declined 5% to $478 million, but both beat the $410 million estimate. A 29% rise in realized liquids prices lifted liquids revenue 14% to $267 million. Profit after tax reached $160 million, up 45% from $110 million a year earlier, as free cash flow rose 35% to $250 million on lower capital expenditure.

    Gym Group’s Profit Doubles

    The Gym Group doubled its pre-tax profit to £4.3 million in the first half of the year, improving 48% year-on-year, as revenue jumped 10% to £133 million. The company noted that Gen Z consumers are increasingly prioritizing fitness in their spending.

    Aberdeen Names New Chairman

    Aberdeen Group appointed Torbjörn Magnusson as chairman, replacing Douglas Flint who moved to insurer Prudential. Magnusson previously served as CEO and President of Sampo Group for six years until 2025. Interim Chairman Jonathan Asquith praised Magnusson’s “particularly strong track record of delivering growth and creating shareholder value.”

    Global Market View

    In the US, the Dow Jones Industrial Average tumbled 628.18 points (1.18%) to 52,786.07, the S&P 500 fell 0.58% to 7,673.52, and the Nasdaq Composite declined 0.32% to 26,421.41. In Asia, Tokyo’s Nikkei 225 dropped 0.19% to 65,142.78, China’s Shanghai Composite rose 0.33%, Hong Kong’s Hang Seng fell 0.33%, and South Korea’s Kospi advanced 1.4%. India’s Nifty 50 and Sensex declined 0.65% and 0.69%, respectively.

    Disclaimer: Analytics Insight does not provide financial advice. This article is for informational purposes only. Always conduct your own research before investing.

  • Indian Stock Market Tumbles: Sensex Plunges 555 Points as US-Iran Tensions Push Crude Prices Higher

    Indian Stock Market Tumbles: Sensex Plunges 555 Points as US-Iran Tensions Push Crude Prices Higher

    Indian equity markets came under severe pressure on September 8, as escalating hostilities between the United States and Iran in the Persian Gulf drove crude oil prices higher and exacerbated concerns over the weakening rupee. The benchmark Sensex fell 555 points to close at 75,577, while the broader Nifty declined 144 points to end at 23,635.

    The latest decline extends the Sensex’s one-month loss to nearly 3,000 points, or 3.8%, and the Nifty’s drop to 949 points, or 3.9%. Foreign funds continued to offload Indian stocks, adding to the negative sentiment on Dalal Street.

    Foreign Investor Selling Accelerates in September

    Foreign investor activity had been cautious since mid-August, with net purchases of Rs. 2,953 crore from August 10 through the end of the month, according to combined data from NSDL and BSE. However, the trend reversed sharply in September, with foreign funds net selling stocks worth approximately Rs. 12,700 crore so far this month, further pressuring the market.

    Rupee Weakens Amid Risk-Off Mood

    The Indian rupee also remained under pressure, falling 34 paise to close at 94.83 per U.S. dollar, despite a record $136 billion inflow through the Reserve Bank of India’s special dollar deposit scheme for NRIs. According to Dilip Parmar of HDFC Securities, the rupee fell in a risk-off environment because of high crude oil prices and aggressive dollar buying.

    Market Experts Comment on Rising Tensions

    Ankur Punj, Managing Director at Equirus Wealth, noted that renewed hostility between the U.S. and Iran pushed investors toward a low-risk stance on equity assets. “Mirroring weak global cues, domestic markets extended their losing streak Tuesday amid selling in banking, IT, oil and gas, and realty shares. Increasing tension in West Asia triggered a sharp rise in crude oil prices, while depreciation in the local currency against the dollar also dampened the overall market sentiment,” he said.

    Investors Lose Rs. 35,000 Crore in a Single Day

    The sharp decline in market values resulted in losses of approximately Rs. 35,000 crore for investors on that day. The total market capitalization of BSE stood at Rs. 486.2 lakh crore. Among Sensex stocks, ICICI Bank, HDFC Bank, and Reliance Industries contributed the most to the decline. However, purchases in BEL, Hindustan Unilever, and Adani Ports helped stem further losses.

  • Indian Rupee Slips to 94.95 as Brent Crude Approaches $100 Amid US-Iran Tensions

    Indian Rupee Slips to 94.95 as Brent Crude Approaches $100 Amid US-Iran Tensions

    The Indian rupee fell 21 paise to 94.95 against the US dollar on Wednesday, September 9, 2026. Rising crude prices and escalating US-Iran tensions pressured the rupee during early trading in Mumbai.

    The currency opened at 94.80 before touching 94.95 in the interbank foreign exchange market. Tuesday’s session ended at 94.74, marking an 18-paise decline against the American currency.

    Brent crude climbed 1.41% to USD 99.30 per barrel as tensions raised supply disruption concerns. The Strait of Hormuz remains a major concern for markets tracking global oil supply routes. Anuj Choudhary, research analyst at Mirae Asset Sharekhan, highlighted the pressure on crude prices. “Indian rupee opened lower on escalating geopolitical tensions and surge in crude oil prices,” Choudhary said.

    The analyst expects USD-INR to remain under pressure while crude prices continue moving higher. He expects the USD-INR spot rate to trade between Rs. 94.70 and Rs. 95.15. A weaker dollar could provide some relief if global risk sentiment remains fragile.

    The dollar index slipped 0.03% to 98.76, offering limited support for the rupee.

    Indian equities also opened sharply lower as investors reacted to rising oil and geopolitical risks. The Sensex dropped 500.25 points, while the Nifty declined 129.40 points during early trading. Higher crude prices could increase India’s import bill and intensify inflation concerns. Investors now await inflation data from India and the US for fresh monetary policy signals. Persistent oil pressure could keep the rupee, equities, and broader markets volatile in coming sessions.

  • Wall Street Futures Gain Despite US-Iran Tensions as Nasdaq Leads Tech Rally

    Wall Street Futures Gain Despite US-Iran Tensions as Nasdaq Leads Tech Rally

    U.S. stock index futures edged higher on Monday, with investors setting aside renewed military tensions between the United States and Iran as optimism over diplomatic engagement and resilient corporate earnings buoyed market sentiment.

    Despite lingering geopolitical nervousness, futures on the technology-heavy Nasdaq outperformed their peers, signaling that traders continue to focus on fundamentals and earnings rather than reacting to events in the Middle East.

    Nasdaq Futures Outperform the Broader Market

    As of 4:47 AM GMT-5, E-mini Nasdaq-100 futures rose 183.25 points, or 0.64%, to 28,956.50. E-mini S&P 500 futures gained 24.50 points, or 0.33%, to 7,522.25, while E-mini Dow Jones Industrial Average futures climbed 145 points, or 0.28%, to 52,520.00.

    The stronger showing in Nasdaq futures reflects ongoing investor interest in technology shares ahead of the start of the U.S. cash market.

    Markets Shift Focus from Conflict to Diplomacy

    Trading began cautiously following fresh U.S. military strikes against Iran, which kept geopolitical tensions elevated. During the session, oil prices were mixed and U.S. Treasuries rose, indicating initial concerns about the situation.

    However, market sentiment turned positive after Iranian Foreign Ministry spokesman Esmail Baghaei stated that communication channels remained open. According to Iranian news reports, Baghaei noted that messengers were continuing to send messages to Tehran despite the new U.S. strikes, adding that negotiations with the United States were possible as long as they aligned with Iran’s interests.

    Investors Remain Focused on Equities

    The United States has conducted its ninth consecutive strike on Iran overnight, keeping the geopolitical situation tense. Nevertheless, Monday’s gains suggest that traders are hopeful the crisis can be contained through diplomacy.

    Another key factor is that the upward movement in futures markets indicates optimism about U.S. equities. With the ongoing earnings season and strong interest in tech stocks, traders appear to be balancing geopolitical risks against stable corporate performance.

    As the U.S. cash market opens, all eyes will be on whether this positive momentum can be sustained amid ongoing geopolitical developments.

  • Indian Stock Market Opens Lower: Nifty 50 Drops 0.59%, Sensex Falls 350 Points on Crude Oil Spike

    Indian Stock Market Opens Lower: Nifty 50 Drops 0.59%, Sensex Falls 350 Points on Crude Oil Spike

    The Indian stock market opened lower on Monday, dragged down by weak global cues amid escalating US-Iran tensions and rising crude oil prices. The Nifty 50 index opened 144.25 points, or 0.59%, lower, while the Sensex fell 350 points. The Bank Nifty also declined by 783.15 points at the open.

    On Friday, the Sensex had gained 964.58 points, or 1.25%, to settle at 78,151.45, while the Nifty 50 rose 261.55 points, or 1.09%, to close at 24,334.30. The Indian rupee opened 13 paise lower at Rs. 96.41 per dollar on Monday versus its previous close of Rs. 96.28.

    Domestic institutional investors (DIIs) continued their buying spree on July 17, purchasing shares worth Rs. 1,017.89 crore, while foreign institutional investors (FIIs) remained net sellers, offloading equities worth Rs. 376.41 crore.

    Sensex Outlook

    Technically, the Sensex formed a bullish candle on the weekly chart, supporting the possibility of a further uptrend from current levels.

    “The market found support near the 77,000 levels during the week. The 77,000 level and 77,600 will act as crucial trend-deciding levels for positional traders. As long as the market trades above these levels, the bullish sentiment is likely to continue. The rally could extend towards the 78,500-79,400 range. On the flip side, if the market falls below 77,000, the sentiment could turn negative. Below this level, traders may prefer to exit their long trading positions,” said Amol Athawale, VP of Technical Research at Kotak Securities.

    Nifty 50 Outlook

    The Nifty 50 continues to display bullish momentum after ending Friday’s session with a strong breakout candle, indicating that buyers remain in control and the recent upward trend is intact.

    “Going ahead, bias remains positive and a follow-through strength above last week’s high of 24,367 will open upside towards the 24,480 and 24,600 levels, being the trendline resistance and high of April 2026, respectively. Failure to move above last week’s high will signal an extension of the recent consolidation in the range of 24,350-23,800,” said Bajaj Broking Research.

    Immediate support for the Nifty is placed in the 24,000-23,800 zone. This range also coincides with the 50-day Exponential Moving Average (EMA).

    Bank Nifty Outlook

    The Bank Nifty ended Friday’s session on a strong note, forming a bullish candle with a higher high and higher low, indicating improving momentum.

    According to Bajaj Broking Research, the Bank Nifty has been consolidating between 56,500 and 58,700 over the past five weeks. A sustained breakout above 58,700 would confirm a fresh upward move and could push the banking index towards 59,300 initially, followed by the psychologically important 60,000 mark.

    “Going ahead, a move above the June high of 58,700 would confirm a breakout from the ongoing consolidation and could trigger the next leg of the rally towards 59,300 and eventually 60,000 levels in the coming weeks,” said the brokerage.

    On the downside, the 56,500-57,000 zone remains a strong support area, where the 20-week and 50-week EMAs converge along with the previous week’s low.

    Disclaimer: This article is for informational purposes only and does not constitute investment advice. Always conduct your own research before making any investment decisions.

  • Indian Markets Edge Higher: Nifty Holds 24,112, Sensex Gains 150 Points Amid Mixed Global Cues and US-Iran Tensions

    Indian Markets Edge Higher: Nifty Holds 24,112, Sensex Gains 150 Points Amid Mixed Global Cues and US-Iran Tensions

    Indian benchmark indices opened with modest gains on Wednesday, as traders navigated mixed global cues and ongoing US-Iran tensions. The Nifty 50 opened at 24,112, up 34 points, while the Sensex added 150 points. However, the Bank Nifty slipped 60 points in early trade.

    On the previous day, the Sensex rose 130.49 points, or 0.17%, to close at 77,185.43, and the Nifty 50 gained 26.45 points, or 0.11%, to settle at 24,078.50. The rupee opened at Rs. 96.25, nearly unchanged from Wednesday’s close of Rs. 96.26. Domestic institutional investors (DIIs) bought equities worth Rs. 704.93 crore on July 15, while foreign institutional investors (FIIs) turned net sellers, offloading Rs. 735.83 crore.

    Sensex Outlook

    Technically, the Sensex formed a Doji candle on the daily chart, indicating indecisiveness among traders.

    “On the positive side, 77,500 would act as a key resistance zone for traders, while 77,000 remains the crucial support zone for the bulls. Above 77,500, the market could move up to 77,800-78,000. On the flip side, dismissing the 77,000 level could accelerate selling pressure. Below this, the market could retest the level of around 76,300-76,000,” said Shrikant Chouhan, Head of Equity Research at Kotak Securities.

    Nifty 50 Outlook

    The Nifty 50 formed a long doji candle on the daily chart with shadows on both sides, reflecting intraday indecision.

    “Nifty 50 is currently hovering within a narrow range of around 24,200-24,000 levels and is showing a lack of strength to sustain the highs. A decisive move beyond the range could open sharp movement on either side,” said Nagaraj Shetti, Senior Technical Research Analyst at HDFC Securities.

    The sideways movement is expected to continue for the next 1-2 sessions, with support at 24,000 and 23,800 below that. Traders must clear the intraday hurdle of 24,200 to stage a larger breakout toward 24,500-24,600.

    Bank Nifty Outlook

    Bank Nifty has been consolidating on the daily chart over the past few sessions. The index formed a small-bodied candle with an upper wick, highlighting its inability to sustain at higher levels.

    “Going ahead, the immediate support for Bank Nifty is placed in the 57,300-57,200 zone. Any sustainable move below this zone could result in the index extending its weakness towards 56,800, followed by 56,400 in the short term. On the upside, the immediate resistance is placed in the 58,200-58,300 zone,” said Sudeep Shah, Head of Technical and Derivatives Research at SBI Securities.

  • Bitcoin Tumbles Below $63K After Brief Surge Past $64,250 Amid US-Iran Tensions

    Bitcoin Tumbles Below $63K After Brief Surge Past $64,250 Amid US-Iran Tensions

    Bitcoin briefly surged above $64,250 on Sunday before retreating to $62,839, a 0.65% decline, as renewed US-Iran tensions triggered a broad risk-off shift across global markets. The cryptocurrency’s volatile session underscores how tightly digital assets are now tied to geopolitical headlines far beyond the crypto ecosystem.

    Bitcoin Price Today: A Quick Snapshot

    The session split into two distinct halves. Early buyers pushed Bitcoin to fresh multi-week highs, only to watch those gains evaporate once news of tanker attacks near the Strait of Hormuz hit the wires. Volume rose noticeably during the retreat, indicating real selling pressure rather than a quiet weekend market.

    • Current price: $62,839 (down 0.65% on the day)
    • Weekly change: -1.94%
    • Intraday high: $64,250+
    • 24-hour crypto liquidations: $254 million (mostly long positions)

    Key Bitcoin Price Levels to Watch

    Technically, Bitcoin remains below its 50-day, 100-day, and 200-day exponential moving averages — a bearish stacking that often caps rallies. Key levels are:

    • Resistance: $64,000–$64,072, with a stronger barrier at the 50-day EMA near $65,577
    • Support: $61,748–$62,360; a break below $61,700 could expose a move toward $58,000

    The Relative Strength Index (RSI) sits in neutral territory (47–52), suggesting the market is neither overbought nor oversold.

    Why US-Iran Tensions Matter to Crypto Markets

    Geopolitical conflicts rarely stay confined to energy markets. Despite Bitcoin’s reputation as “digital gold,” it still behaves like a risk asset during military escalation. Key ripple effects include:

    • Rising oil prices fuel inflation worries, pressuring risk assets broadly.
    • Investors rotate into gold or the dollar, pulling liquidity away from crypto.
    • Leveraged Bitcoin positions get wiped out quickly as volatility spikes.

    Broader Market Reaction

    Bitcoin was not alone in the sell-off. Ethereum slipped to $1,789, while Solana held up better near $76.80. The Altcoin Season Index sat near 59, indicating altcoins have not meaningfully outpaced Bitcoin. The Fear and Greed Index dropped to 28, reflecting heightened fear.

    Analyst Outlook on Bitcoin Price Prediction

    Technical readings are mixed but not outright bearish. The daily MACD histogram has started to stabilize, and institutional buying offers a floor. Strategy (formerly MicroStrategy) added to its Bitcoin reserves, and ETF flows are showing early signs of steadying after a rough June.

    A confirmed daily close above $64,000 could open the door toward $65,500 and $67,000. Conversely, a break below $61,700 would likely trigger selling pressure toward $58,000.

    Factors That Could Shape Bitcoin’s Next Move

    • Further escalation near the Strait of Hormuz could spark a sharper retreat from risk assets.
    • A credible ceasefire announcement could quickly restore risk appetite.
    • Federal Reserve commentary on interest rates will shape broader liquidity conditions.
    • Sustained institutional buying could cushion Bitcoin against deeper downside.

    Final Words

    Bitcoin’s brief run to $64,250 shows that demand for higher prices has not disappeared. The pullback says less about crypto fundamentals and more about how tightly digital assets are now tied to geopolitical events. Two storylines to watch: the technical tug-of-war around $64,000 resistance and the geopolitical standoff thousands of miles away. The resolution of either will likely decide Bitcoin’s next direction.

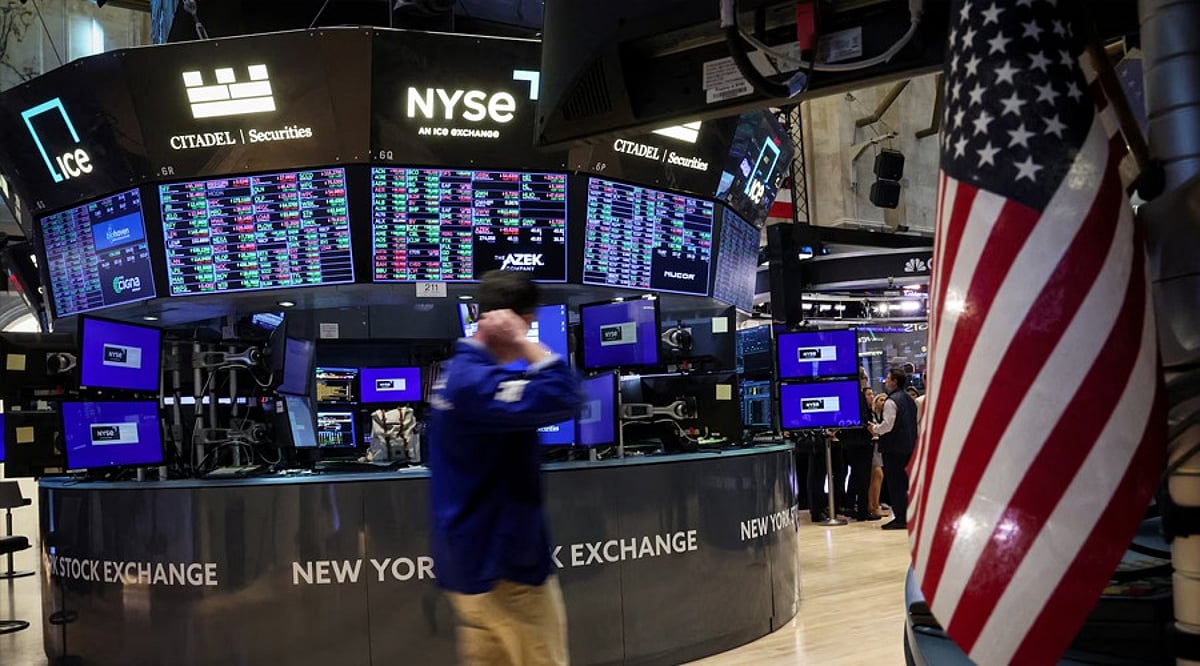
  • Wall Street Slips as Renewed US-Iran Tensions Lift Oil Prices and Drag Down Chip Stocks

    Wall Street Slips as Renewed US-Iran Tensions Lift Oil Prices and Drag Down Chip Stocks

    US stocks declined on Monday as escalating tensions between the United States and Iran prompted investors to adopt a cautious stance. The S&P 500 fell 0.4% at its session low, while the NASDAQ Composite dropped 1%. The Dow Jones Industrial Average traded roughly 56 points lower, or 0.1%.

    The market weakened after President Donald Trump announced the reinstatement of a blockade targeting Iranian shipping through the Strait of Hormuz. Oil prices surged on the news, adding pressure to growth stocks and other risk assets. This came despite the S&P 500 posting two consecutive weekly gains amid volatile chip shares and renewed Middle East risks.

    Oil Surges After New Hormuz Order

    Trump stated that the United States would act as ‘THE GUARDIAN OF THE HORMUZ STRAIT’ and impose a 20% charge on cargo shipped through the route to cover security costs. He said the action would prevent Iranian ships and customers from entering or leaving via the waterway.

    West Texas Intermediate crude futures gained more than 5%, moving above $75 per barrel. Brent crude climbed about 5.3% to $80. The gains followed another exchange of strikes between the US and Iran over the weekend, renewing concerns over energy supplies and shipping access.

    Chip Stocks Lead the Market Decline

    Semiconductor shares posted some of Wall Street’s steepest losses. US-listed shares of SK Hynix fell 7% after surging 13% during its NASDAQ debut on Friday. Micron Technology dropped about 6% to 7%, while Sandisk lost close to 10%. Seagate Technology fell 6%, and Advanced Micro Devices and Intel traded around 4% lower. The Philadelphia Semiconductor Index slid 3.6%, standing more than 14% below its late-June record.

    Technology became the weakest S&P 500 sector during the morning session, falling about 1.3%. Four of the index’s 11 sectors traded lower early. The NASDAQ posted the largest decline among the three major indexes, while gains in IBM and UnitedHealth helped limit losses in the Dow.

    “Markets have started the week firmly on the defensive,” said Daniela Hathorn, senior market analyst at Capital.com. She linked the weaker mood to renewed US-Iran tension and uncertainty over the path toward a lasting agreement.

    Earnings and CPI Move into Focus

    Wall Street also prepared for a busy week of corporate results. JPMorgan Chase, Goldman Sachs, Morgan Stanley, Bank of America, Citigroup, and Wells Fargo will report. Netflix, Johnson & Johnson, and UnitedHealth also have results scheduled.

    Analysts expect second-quarter S&P 500 earnings to rise by more than 23% from a year earlier, based on FactSet and LSEG estimates. Investors will track bank results for signs of consumer strength and credit quality. Technology earnings will also draw attention as companies update AI spending plans.

    The June consumer price index report arrives Tuesday morning. The data could reshape interest-rate expectations after higher oil prices renewed inflation concerns. Federal Reserve Chair Kevin Warsh will also deliver his first monetary policy testimony before Congress on Tuesday.

    Apple drew attention after Citi raised its price target to $365 from $315, citing potential market share gains despite slower demand. Analyst Asiya Merchant noted that ‘selective price increases’ may offset margin pressure, and pointed to the September iPhone 18 launch as a possible catalyst before Apple reports earnings on July 30.

  • Bitcoin Slides Below $63,000 as US-Iran Tensions Spark Crypto Sell-Off

    Bitcoin Slides Below $63,000 as US-Iran Tensions Spark Crypto Sell-Off

    Bitcoin tumbled 2.42% over 24 hours to $62,461.35 as renewed US-Iran military strikes prompted a broad risk-off move across financial markets. The decline was accompanied by a drop in stablecoin supply, which has fallen by about $10 billion since May, signaling weaker crypto liquidity.

    The broader crypto market lost 1.12%, trimming total capitalization to roughly $2.15 trillion. The Fear and Greed Index plunged to 28, while Bitcoin dominance held near 60%. Traders now face heightened geopolitical risk, lower liquidity, and the upcoming US Consumer Price Index (CPI) report due July 14.

    Geopolitical Tensions Pressure Bitcoin Price

    Renewed US airstrikes on Iran intensified fears over Middle East supply routes, particularly the Strait of Hormuz. Brent crude surged more than 3%, adding fresh inflation concerns. Bitcoin moved lower alongside other risk assets as traders reduced exposure before the CPI data.

    The drop pushed Bitcoin below the key support level of $62,565, raising the risk of a move toward $60,000 — a major psychological price zone. A recovery above $64,300 would ease short-term pressure, but geopolitical developments may keep price swings elevated.

    Liquidations Accelerate the Crypto Sell-Off

    Leveraged positions amplified the decline. Bitcoin liquidations reached $70.23 million over 24 hours, up 248% from the previous period. Long positions accounted for 85% of forced selling, indicating that traders bet on higher prices.

    Across the crypto market, total liquidations hit $254.4 million, affecting 68,505 traders. Long liquidations totaled $194.9 million, while short liquidations reached $59.5 million. Ethereum traded near $1,789, while BNB and XRP also posted losses. Solana held near $76.80, bucking the broader trend. The Altcoin Season indicator stood at 59 out of 100, suggesting altcoins have not yet overtaken Bitcoin.

    The average crypto RSI hovered near 45, pointing to weak momentum without an oversold reading. These figures indicate a cautious market rather than a full capitulation event.

    Stablecoin Outflows Raise Liquidity Concerns

    Stablecoin market value has dropped by roughly $10 billion from its May peak despite high transaction volume. June alone recorded a $7.7 billion decline — the largest monthly contraction since the Terra-Luna collapse in May 2022. USDT lost about $6 billion, while USDC declined by approximately $7 billion over the period.

    Stablecoins provide trading liquidity and often indicate whether capital remains in crypto. The latest decline suggests a portion of the market moved back into fiat rather than waiting in digital dollars. Analysts have called the move a ‘temporary correction,’ but two consecutive months of falling supply point to weaker available capital.

    Bitcoin fell 3.6% in May and 20.45% in June as stablecoin liquidity contracted. Stablecoin dominance now sits near 6.5%, while Bitcoin dominance holds close to 60%. A further drop in stablecoin use could delay any ‘market bottom’ and keep pressure on higher-risk tokens.

    What Traders Are Watching Next

    The July 14 CPI report now stands as the next major trigger. Softer inflation could support rate-cut expectations and improve risk appetite. A stronger reading may lift yields and add pressure on Bitcoin. Traders will also watch whether Bitcoin can regain $63,000 or drop toward $60,000.

    Also Read: DeFi Outperforms Bitcoin: DeFi Tokens Drop Just 4% as BTC Plummets 22%