Tag: Whale Activity

  • XRP Hovers Near $1.07 as Whale Transfers and Binance Inflows Decline – Key Resistance at $1.12

    XRP Hovers Near $1.07 as Whale Transfers and Binance Inflows Decline – Key Resistance at $1.12

    XRP is trading around $1.07 after losing 0.81% over the past 24 hours, briefly touching $1.10 before sellers pushed it back into its recent range. The decline mirrors a broader crypto market pullback, with Bitcoin dropping 1.26% and total market capitalization falling roughly 1.1%. Traders are also weighing the Federal Reserve’s policy stance and geopolitical tensions between the United States and Iran.

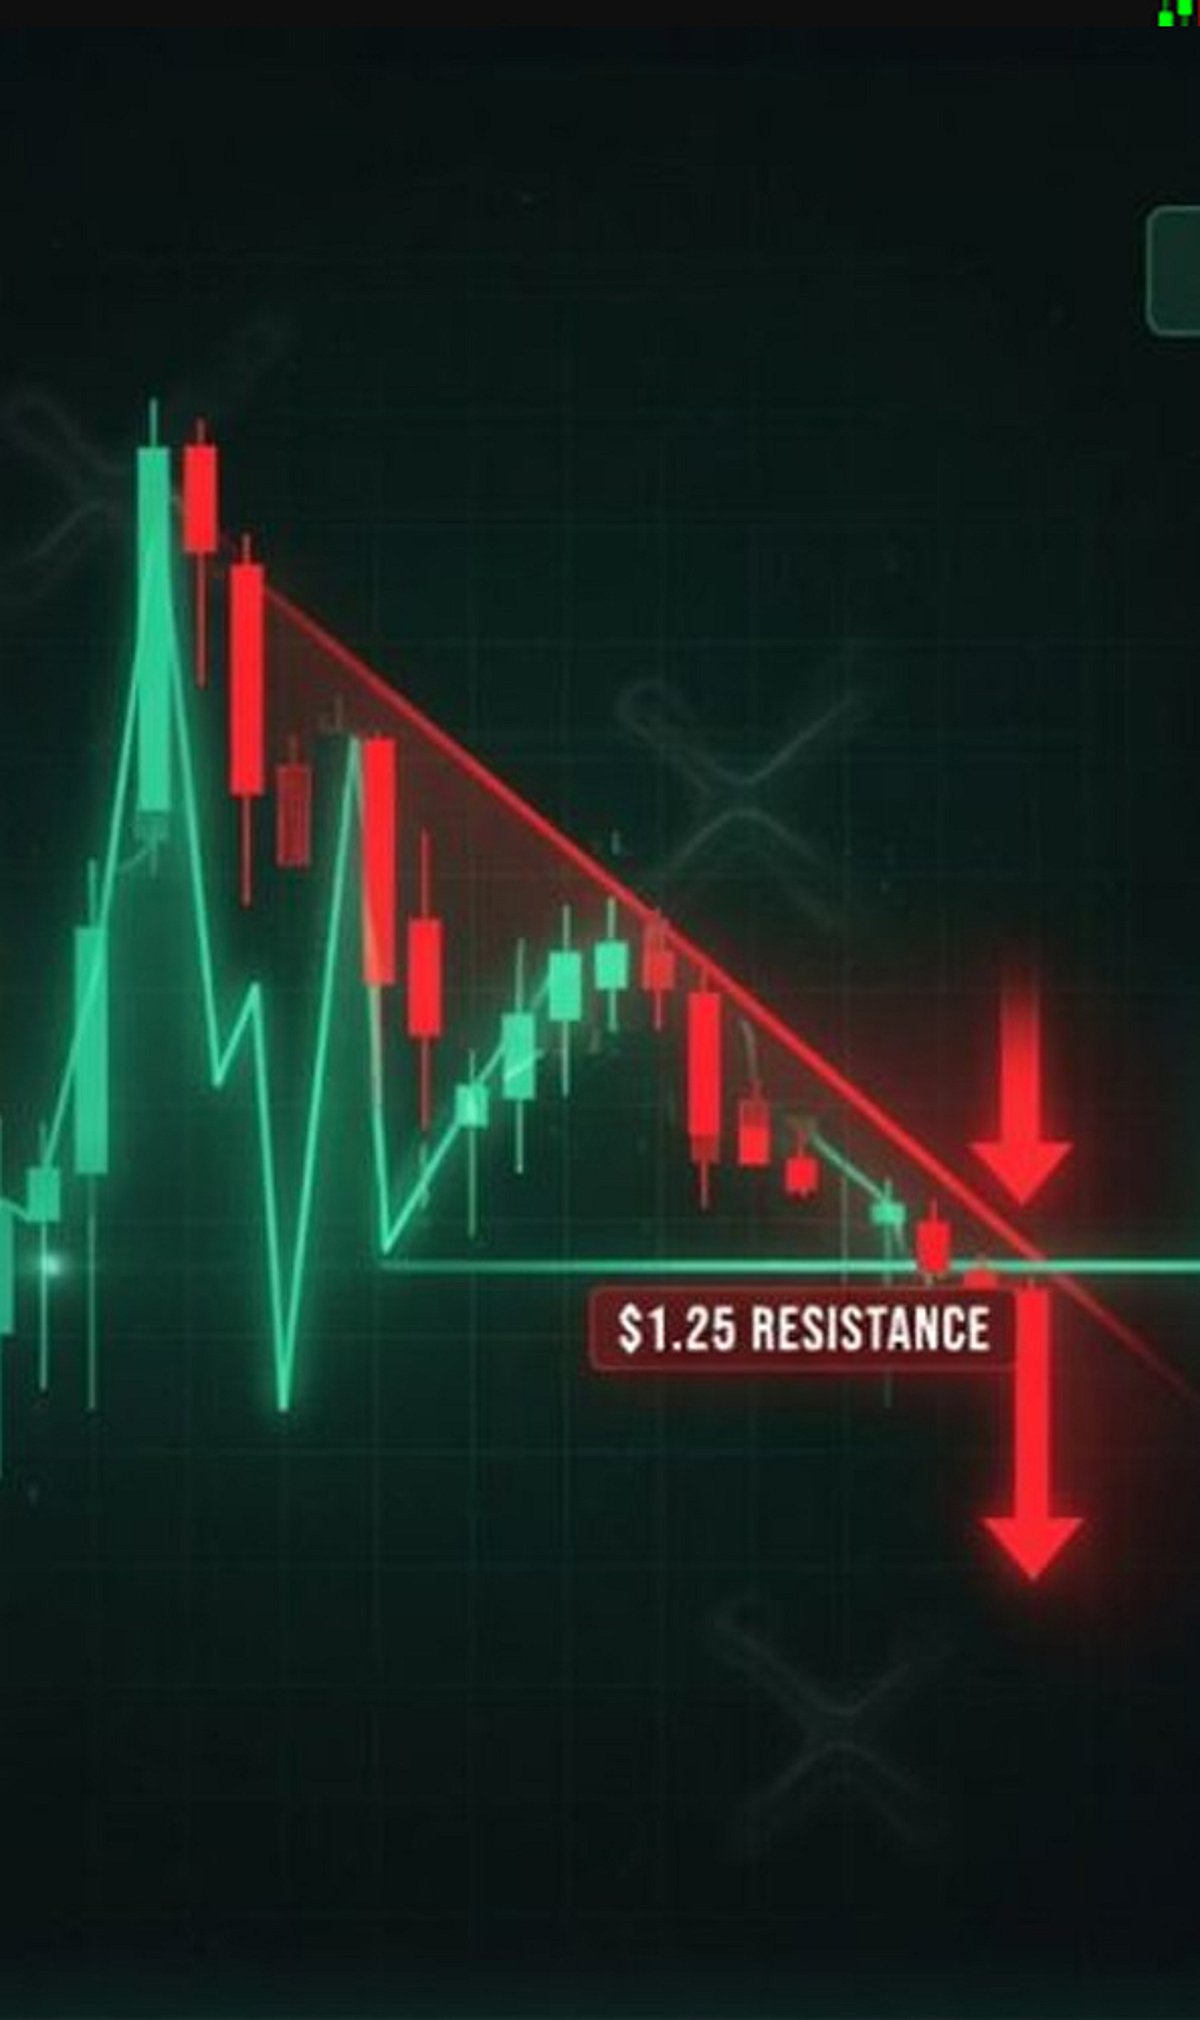
    Technically, XRP faces resistance between $1.10 and $1.13. A stronger buying push is needed before the token can target the $1.16 level.

    Whale Activity Slumps

    Large XRP transfers have dropped sharply, indicating reduced activity among major holders. Whales are neither building large positions nor moving significant amounts onto exchanges. The slowdown limits selling pressure since fewer tokens reach trading platforms, but it also signals weak demand from investors who typically drive larger market moves.

    Retail transfers now account for a larger share of XRP activity. These transactions provide regular network usage but carry less volume than whale or institutional transfers. XRP has remained between support at $1.05 and resistance near $1.10, as buyers defend lower levels while sellers cap upward moves.

    Binance inflows have also declined. Lower exchange deposits often suggest holders have less interest in selling at current prices. However, reduced inflows alone cannot trigger a rally. XRP needs stronger spot buying and higher trading volume to break out of its current range.

    ETF Inflows Offer Brief Support

    U.S. spot XRP exchange-traded funds recorded $584,000 in net inflows on July 29, ending three straight days of withdrawals. Demand picked up on July 30, with the funds attracting roughly $6 million. Those inflows helped XRP briefly reach $1.10 before profit-taking stalled the advance.

    Institutional activity also provided support. Aviva Investors plans to issue a tokenized share class of its USD Liquidity Fund on the XRP Ledger. The fund gives eligible investors access to short-term U.S. dollar debt products through blockchain wallets, with approval from Ireland’s central bank. Securitize and Licuido will handle the tokenization system, Komainu will manage digital asset custody, and BNY Mellon will support traditional custody services.

    Additionally, the plan followed the July 29 activation of the fixCleanup3_2_0 amendment on the XRP Ledger. Despite these developments, sellers still defended the $1.10 area.

    XRP Needs to Reclaim $1.12

    XRP trades below its main daily exponential moving averages. The 20-day EMA sits near $1.09, the 50-day EMA around $1.13, and higher resistance at the 100-day EMA near $1.21 and the 200-day EMA around $1.41. Several technical barriers remain above the current market price.

    On the four-hour chart, the MACD line has crossed slightly above its signal line, but the shallow histogram indicates weak upward momentum. The relative strength index stands near 48.7, below the 50 mark, showing buyers have not gained firm control.

    Liquidation data reveals a large cluster of short positions between $1.09 and $1.10. A clean break through that area could push XRP toward $1.12 and the 50-day EMA near $1.13. A move above $1.13 could open the $1.14 to $1.20 region. Support sits between $1.06 and $1.07, and a drop below $1.05 could expose the $1.00 psychological level.


  • XRP Whale Wallets Hit Record High While Retail Investors Cash Out

    XRP Whale Wallets Hit Record High While Retail Investors Cash Out

    XRP has entered a new phase where large investors and small traders have chosen completely different paths. Blockchain data shows that whale wallets have continued to buy more XRP, while many retail investors have sold part of their holdings. This gap between big and small investors has become one of the biggest talking points in the crypto market.

    Large holders often focus on long-term value instead of daily price swings. Retail traders usually react faster to market drops and uncertainty. Current on-chain data reflects exactly that pattern.

    XRP Price Holds Above $1

    XRP trades at approximately $1.11 on the market as of July 24, 2026, with a market cap that exceeds $69 billion. The total volume of the asset in one day remains at around $1.04 billion. In total, there are around 62.47 billion XRP tokens in circulation.

    While XRP seems to be doing relatively stable with a price above $1, positive investor sentiment has not resulted in further price gains. The cryptocurrency has proven to be unpredictable for many traders as it constantly pushes against a resistance zone around $1.14-$1.15.

    Whale Wallets Reach Record Numbers

    The biggest story comes from blockchain data. Wallets that hold at least 10,000 XRP have climbed to a record 332,230 addresses. This number shows that large investors have continued to collect XRP even during weak price action.

    This trend has continued for several months. Instead of waiting for higher prices, whales have added more coins whenever the market slowed down. Such buying behavior often shows confidence in future growth rather than interest in quick profits.

    Many market experts believe whales usually study market cycles before they make large purchases. Their steady buying suggests that these investors still see value in XRP despite recent price struggles.

    Retail Investors Continue to Sell

    Several reasons explain this move. The price has stayed within a narrow range for weeks. Many traders expected a stronger rally but did not get one. As a result, some chose to lock in profits, while others sold since they feared another decline.

    This selling does not always mean investors have lost faith in XRP forever. Many retail traders simply prefer to wait until the market shows stronger momentum before they enter again.

    Blockchain Data Supports the Trend

    The number of whale wallets has reached an all-time high. Net position data also shows that these large holders have continued to increase their balances. At the same time, exchange selling from major wallets has remained lower than previous periods.

    These figures suggest that large investors have not rushed to sell despite market uncertainty. Instead, many have treated recent price weakness as an opportunity to build bigger positions.

    Such behavior often attracts attention since whales usually control enough capital to influence market trends over time.

    Price Faces Strong Resistance

    The price has struggled to move above the $1.14 to $1.15 resistance zone. Every rejection has encouraged short-term traders to leave the market, which has slowed fresh buying.

    This price action has created a balance between buyers and sellers. Bulls have protected the $1 level, while sellers have defended higher prices. Until one side gains control, XRP may continue to trade within this range.

    Many Holders Still Remain in Loss

    Recent data reveals that only 43.4% of XRP’s circulating supply remains in profit. This marks the lowest level in almost two years.

    This means that more than half of XRP holders currently own coins that sit below their purchase price. Such conditions often create emotional pressure since many investors worry about deeper losses.

    However, crypto markets have shown similar situations before. Long periods where most holders remain in loss have sometimes appeared before major recoveries. Although history does not guarantee future results, many experienced investors continue to watch this indicator closely.

    Ripple Continues to Build the XRP Ecosystem

    New grant programs now help startups and blockchain developers build applications on the XRP Ledger. These initiatives support innovation and encourage more businesses to create products that use the network.

    Ripple has also continued work on payment solutions, digital asset services, and enterprise technology. These developments strengthen the long-term use case for XRP beyond short-term price movements.

    Futures Market Shows Rising Interest

    Recent updates indicate that the open interest of XRP futures has reached higher numbers. The implication here is that traders have been active in opening positions in the futures market.

    In reality, greater open interest relates to active trading. It can also lead to significant price movements since openings of long and short positions generate volatility when prices breach the resistance or support.

    Why This Matters

    Whale activity often provides an early signal of market direction as large investors usually make decisions after careful research. At the same time, retail selling reflects broader market sentiment. When both groups move in opposite directions, the trend can reveal valuable insights about confidence, future demand, and the possible direction of XRP’s price.

    Outlook

    The token still trades below the key $1.14 to $1.15 resistance level, but large investors have not slowed their accumulation. Record whale wallet numbers, steady on-chain data, and continued ecosystem growth show that many major holders still believe in XRP’s long-term potential.

    The next major price move will likely depend on overall crypto market sentiment, stronger buying demand, continued Ripple development, and a successful break above important resistance. Until that happens, whale accumulation and retail selling will remain the biggest themes in the XRP market.

    FAQs

    1. Why are XRP whales buying more tokens? Large investors accumulate XRP during price dips, demonstrating strong long-term confidence despite temporary market stagnation.
    2. Why are retail investors selling XRP? Retail traders reduce exposure or take short-term profits after XRP repeatedly failed to break past key resistance zones.
    3. What is XRP’s current price? XRP trades around $1.11, maintaining a market capitalization exceeding $69 billion with steady daily volume.
    4. What does record whale wallet growth mean? Wallets holding over 10,000 tokens reached historic highs, signaling sustained accumulation by high-net-worth investors.
    5. What could influence XRP’s next price move? Key catalysts include broader market sentiment, ecosystem expansion, institutional adoption, and breaking resistance between $1.14-$1.15.
  • Ethereum Surges Past $1,850 as Regulatory Hopes and ETF Inflows Fuel Rally

    Ethereum Surges Past $1,850 as Regulatory Hopes and ETF Inflows Fuel Rally

    Ethereum (ETH) has climbed above $1,850, reaching $1,873.56 with a 1.61% gain in the last 24 hours, outperforming the broader cryptocurrency market. The upward move is driven by renewed optimism around U.S. crypto regulations, consistent inflows into spot Ethereum exchange-traded funds (ETFs), and a technical breakout from a double-bottom pattern.

    The broader market posted modest gains, but Ethereum stood out among large-cap tokens. Despite being about 62% below its all-time high, the current rally has traders watching key support at $1,812 and resistance near $1,947. The week ahead may bring further catalysts, including potential Senate action on the CLARITY Act.

    CLARITY Act Optimism Supports Ethereum Price

    U.S. Representative Bryan Steil indicated that the Senate could vote on the CLARITY Act during the week of July 20–24. The proposed legislation would classify Ethereum as a digital commodity, providing a clearer legal framework for digital assets. Markets reacted positively to the timeline, though the final schedule and bill text remain unconfirmed.

    The regulatory update lifted sentiment across the crypto space. Ethereum gained more than Bitcoin in the session, reflecting stronger demand. However, the rally remains contingent on political progress. A delay or failed vote could push Ethereum back toward the $1,780 support zone.

    ETF Inflows Confirm Renewed Institutional Demand

    Spot Ethereum ETFs recorded approximately $105 million in net inflows from July 13 to July 17, according to SoSoValue. That marks the strongest weekly result since April, following a period of mixed flows including a $36.3 million daily outflow and a reported $22.3 million sale linked to BlackRock’s Ethereum fund.

    The return of weekly inflows signals that institutional interest remains intact, adding credibility to the price move beyond short-term speculation. However, sustained trading volume is essential for Ethereum to hold above the breakout level.

    Whale activity has also drawn attention. Two newly created wallets sold 72 Bitcoin for about $4.66 million and opened 20x leveraged long positions on 12,000 ETH, valued near $22.4 million. These trades suggest large accounts anticipate further upside, though high leverage raises liquidation risk if the market turns downward.

    Double-Bottom Breakout Puts $1,947 in View

    Ethereum confirmed a breakout from a double-bottom pattern with a neckline near $1,847. The price also moved above the $1,854 level, which coincides with the 0.786 Fibonacci retracement. The daily relative strength index (RSI) stands near 58.71, indicating positive momentum without overbought conditions.

    The next resistance zone is around $1,947. To maintain the bullish setup, Ethereum must hold above $1,854 and keep support at the 50-day exponential moving average near $1,812. A drop below $1,812 would weaken the breakout and increase the likelihood of a decline toward $1,780.

    Market participants are closely monitoring whether ETF inflows stay positive and whether the Senate confirms action on the CLARITY Act. These factors could determine whether Ethereum extends its rebound or returns to its earlier trading range. For now, ETH remains above the key support zone as traders test the strength of the breakout.

  • XRP Price Analysis: Can Ripple Recover Amid Slowing Whale Activity and ETF Demand?

    XRP Price Analysis: Can Ripple Recover Amid Slowing Whale Activity and ETF Demand?

    XRP is trading near $1.09 as whale activity and ETF demand weaken, leaving investors questioning its next move. The cryptocurrency has dropped about 2% in the last 24 hours, with daily trading volume above $1.1 billion and a total market value close to $68 billion. Despite the decline, XRP remains the sixth-largest cryptocurrency by market capitalization.

    Large investors, known as whales, have historically played a major role in XRP price movements. However, recent blockchain data shows Binance whale withdrawals have dropped to around 885 million XRP, the lowest level in over two months. This suggests major holders are becoming more cautious. Additionally, large XRP transactions have become less common, coinciding with weaker institutional interest. While this does not guarantee a sharp decline, it removes a key source of buying support.

    Exchange-traded funds (ETFs) have been a major topic in the crypto market, but recent figures show XRP investment products recorded about $7.18 million in net outflows. This marks a shift from stronger inflows earlier in the year, reflecting a cautious mood across the wider market. Many investors are waiting for better conditions before committing new capital.

    Technically, XRP is near a crucial support zone between $1.08 and $1.10. Buyers have defended this range multiple times in recent months. If XRP stays above this level, a recovery could target $1.20, then $1.35, and potentially $1.50. On the downside, $1.00 remains the key support; a break below could increase selling pressure.

    Despite market weakness, Ripple continues to expand its global payment network and develop the XRP Ledger. Recent projects focus on tokenized assets, decentralized finance, stablecoins, and business solutions. Regulatory approvals in Europe could accelerate adoption among banks and financial institutions.

    Market sentiment around XRP is mixed. Some investors are optimistic about Ripple’s business growth, while others remain cautious due to slowing whale activity and ETF demand. The broader crypto market also influences XRP, with Bitcoin and other major assets often setting the direction.

    For XRP to recover, several conditions need to improve: a return of strong whale buying, better ETF inflows, and clearer regulatory frameworks. The next few weeks will be critical. If the $1.08–$1.10 support holds, a move toward $1.20 is possible. If it breaks, sellers may gain control.

    Key Takeaways:

    • XRP holds a crucial support zone between $1.08 and $1.10 despite recent selling pressure.
    • Whale activity and ETF inflows have slowed, reducing short-term bullish momentum.
    • Ripple continues to expand its payment network and XRP Ledger, supporting long-term growth.

    FAQs

    1. What is XRP’s current price?
    The token trades near $1.09. It remains the sixth largest cryptocurrency by market capitalization despite a 2% decline over the last 24 hours.

    2. Why has XRP come under pressure?
    Reduced whale activity and a drop in large transactions have weakened buyer support. Additionally, institutional investors have pulled money out, leading to $7.18 million in net ETF outflows.

    3. What is the key support level for XRP?
    The immediate support zone lies between $1.08 and $1.10. If sellers break this range, the next vital psychological and technical floor to watch rests at $1.00.

    4. Can XRP recover in the coming weeks?
    A recovery remains entirely possible. However, the market first needs to see a return of aggressive whale buying, positive institutional ETF inflows, and improved momentum across the broader cryptocurrency landscape.

    5. What could drive XRP higher?
    Future gains depend on renewed whale accumulation and stronger institutional investment. Long-term growth could also be triggered by clearer global regulations and the ongoing expansion of Ripple’s cross-border network.

  • XRP Price Analysis: Crucial Support and Resistance Levels Traders Must Monitor

    XRP Price Analysis: Crucial Support and Resistance Levels Traders Must Monitor

    XRP’s price action is approaching a critical juncture, with several technical and on-chain indicators offering clues about its next major move. Traders should keep a close watch on these key levels and signals to navigate potential volatility.

    Major Support Zone

    Strong buying interest has been observed near recent support levels, which may help prevent deeper declines. However, losing this zone could trigger increased selling pressure and heightened volatility.

    Key Resistance Level

    A decisive close above resistance, accompanied by rising trading volume, could confirm renewed bullish momentum and attract additional institutional and retail participation.

    Trading Volume

    Higher trading volumes during price moves typically validate breakouts, while weak volume often indicates false moves and short-lived momentum. Always confirm breakouts with volume.

    Moving Averages

    Watch the 50-day and 200-day moving averages closely. Crossovers often signal trend changes and provide important dynamic support or resistance levels.

    Relative Strength Index (RSI)

    The RSI helps identify overbought and oversold conditions, enabling traders to anticipate possible trend reversals or continuation before major price movements.

    Market Sentiment

    Regulatory developments, ETF expectations, and broader cryptocurrency sentiment significantly influence XRP’s price direction and short-term trading opportunities.

    Whale Activity

    Large wallet transactions and exchange inflows often precede significant price swings, making on-chain monitoring essential for active XRP traders.

    Bitcoin Correlation

    XRP frequently follows Bitcoin’s broader market trend. Strong Bitcoin rallies or corrections can quickly impact XRP’s momentum and investor confidence.

    Breakout Confirmation

    Traders should wait for sustained price action above resistance or below support, supported by strong volume, before confirming a new trend.

  • Meme Coin Market Cools: Dogecoin, Shiba Inu, and Pepe Slide as Traders Eye Support Levels

    Meme Coin Market Cools: Dogecoin, Shiba Inu, and Pepe Slide as Traders Eye Support Levels

    The meme coin market hit a wall on Tuesday as last week’s rally ran out of steam. Dogecoin (DOGE) pulled back after hitting heavy resistance, while Shiba Inu (SHIB) remained trapped under a long-standing descending trendline. Meanwhile, Pepe (PEPE) faced a wave of profit-taking from traders cashing in on its recent double-digit run. On-chain data and chart patterns are mixed, leaving traders questioning whether current support levels will hold.

    Dogecoin Tests Support After Resistance Rejection

    DOGE is feeling the heat after getting rejected at $0.0782, dropping 1.5% to sit below $0.0745 this Tuesday. If the decline continues, the next stop could be the yearly lows near $0.0695. The indicators present a mixed picture. The daily Relative Strength Index (RSI) is scraping 35, indicating heavily oversold conditions, while the Moving Average Convergence Divergence (MACD) still holds onto its July 3 bullish crossover, suggesting buyers haven’t completely left the building.

    Market analyst Ali Charts reported that Dogecoin’s network activity climbed to roughly 50,000 active addresses on July 5. The analyst noted, ‘Something is brewing,’ as higher address activity reflected stronger user participation across the network. Large investors holding more than one billion DOGE increased their combined holdings to 73.85 billion tokens. Although whale transactions dropped to 12 on Sunday, the broader accumulation trend remained intact.

    Derivatives Data and Technical Levels Stay in Focus

    Coinglass data showed Dogecoin derivatives trading volume rose 31% to $1.26 billion, while open interest edged down 0.32% to $1.04 billion, indicating only limited new leveraged positions entered the market. Technical indicators presented a balanced picture. The RSI registered 51.52, reflecting neutral momentum, while the Chaikin Money Flow indicator remained positive at 0.08, pointing to modest but steady capital inflows.

    Analyst Jesse Peralta said DOGE continued trading inside an ascending channel and approached the channel’s lower boundary. According to the analysis, the $0.075 to $0.076 range now serves as the primary support zone. Maintaining support above $0.075 could expose the next upside target at $0.081. After that, analysts identified $0.090, $0.10, and $0.12 as potential recovery levels. A break below $0.075 could shift attention toward the $0.070 to $0.068 support zone. Market technician Celal Kucuker also reported that Dogecoin broke above its long-term downtrend line before retesting it. A successful retest could create a path toward the $0.12 target.

    Shiba Inu Faces Trendline Resistance While PEPE Retreats

    Shiba Inu gained more than 6% during the previous week before testing a descending trendline near $0.0000045. That level also aligned closely with daily resistance. SHIB failed to close above the resistance area on Sunday. It then declined more than 3% over the following two days and traded below $0.0000043 on Tuesday. If the correction continues, SHIB could revisit its yearly low around $0.0000040. Like Dogecoin, SHIB displayed mixed technical signals. Its RSI remained below the neutral level, while the MACD continued showing a bullish crossover that suggested improving underlying momentum.

    Besides the weakness in meme coins, the broader cryptocurrency market expanded by 1.04% to $2.19 trillion during the previous 24 hours. Bitcoin, Ethereum, XRP, and Solana also recorded modest gains during the same period, while PEPE pulled back as traders secured profits after last week’s strong advance.

    What’s Next?

    Dogecoin, Shiba Inu, and Pepe retreated after last week’s rally as buying momentum eased. DOGE and SHIB approached key support levels while technical indicators delivered mixed signals. Meanwhile, whale accumulation, network activity, and broader market strength remained important factors for traders monitoring the next price movement.