Author: vitorcherulli

  • Elon Musk’s Boring Company Proposes 200 MPH Hyperloop Tunnel Linking Austin and San Antonio

    Elon Musk’s Boring Company Proposes 200 MPH Hyperloop Tunnel Linking Austin and San Antonio

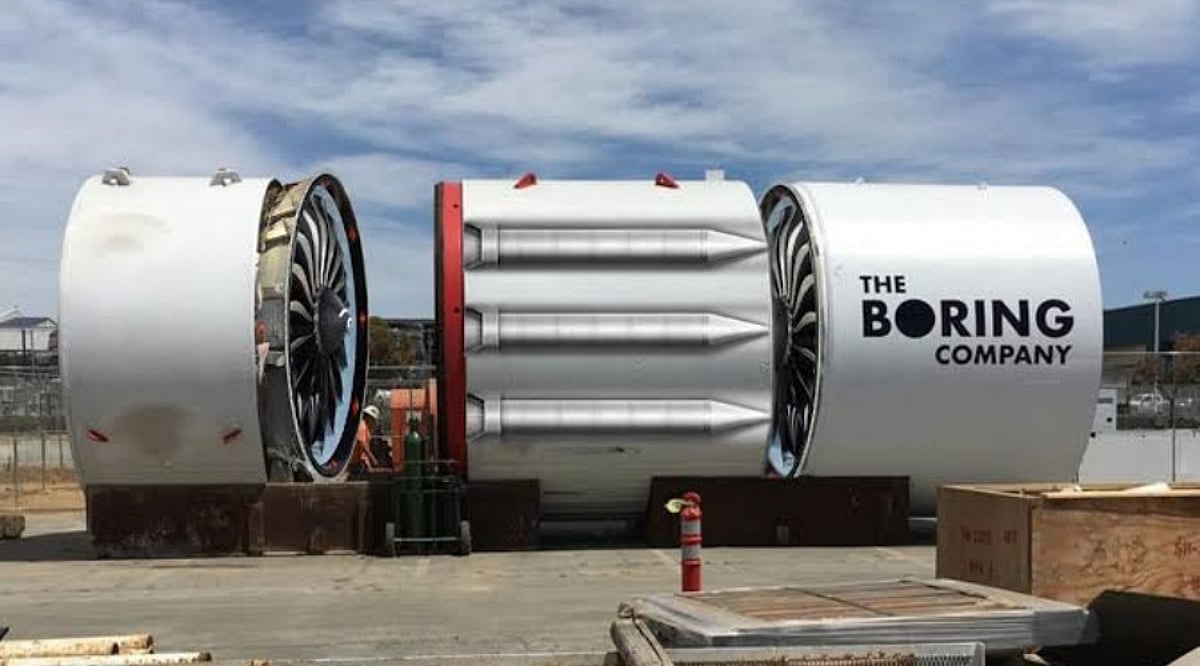
    Elon Musk’s The Boring Company has unveiled plans for a high-speed Hyperloop tunnel connecting Austin and San Antonio, Texas. The announcement came in response to a post on X (formerly Twitter) featuring an AI-generated video of futuristic human colonies. Musk reposted the video and commented, “Boring Company is working on a simple, precursor Hyperloop tunnel between Austin and San Antonio.”

    The proposed tunnel would enable speeds exceeding 200 mph, drastically reducing the current travel time of up to 2.5 hours during peak traffic. Musk emphasized that The Boring Company aims to deliver a consistent, fast commute that bypasses congestion entirely. While the concept is still in early stages, the project faces significant hurdles including regulatory approvals, funding, and the technical challenges of tunneling through urban and suburban environments.

    This is not Musk’s first Hyperloop proposal; previous attempts in other regions have encountered delays and cost overruns. However, the Austin-San Antonio corridor, one of the fastest-growing in the U.S., presents a compelling case for high-speed transit. If realized, the tunnel could transform daily commuting and set a precedent for future Hyperloop networks across Texas and beyond.

  • Snapdragon Summit 2026: Qualcomm’s Flagship Chip Reveals Set for September 22

    Snapdragon Summit 2026: Qualcomm’s Flagship Chip Reveals Set for September 22

    Qualcomm’s Snapdragon Summit 2026 kicks off on September 22 in Maui, Hawaii, running through September 24. The opening day will focus heavily on mobile platforms and the company’s vision for the ‘agentic AI’ era.

    Two New Snapdragon 8 Elite Chips Expected

    The highlight is anticipated to be Qualcomm’s next flagship smartphone processors. Leaks indicate the Snapdragon 8 Elite Gen 6 and Snapdragon 8 Elite Gen 6 Pro, both likely built on a 2nm manufacturing process for notable gains in performance and power efficiency. The Pro variant may support faster LPDDR6 memory and UFS 5.0 storage, while the standard model could retain LPDDR5X. Upgraded graphics, including Adreno Matrix Cores and Adreno Neural Fusion for AI workloads, are also confirmed by Qualcomm.

    AI, XR and PCs Take Center Stage

    Beyond phones, the summit will emphasize agentic AI across personal computing, sound, and extended reality. Qualcomm’s Snapdragon portfolio now includes PCs, XR devices, wearables, and automotive platforms, positioning the summit as a key venue for its cross-device AI push.

    Xiaomi, iQOO and OnePlus Linked to Early Adoption

    The new chips are expected to reach smartphones swiftly. Xiaomi, iQOO, and OnePlus are among brands rumored to launch devices with the next-generation platforms, with the first wave possibly arriving in India by late 2026 or early 2027. Official specifications, performance claims, and partner announcements will be unveiled at the summit.

  • India’s Payment Methods Compared: UPI, Debit Cards, and Credit Cards – Fees and MDR Explained

    India’s Payment Methods Compared: UPI, Debit Cards, and Credit Cards – Fees and MDR Explained

    When you tap, swipe, or scan to pay, the costs behind that transaction vary dramatically depending on the method. While customers rarely see these charges, merchants bear the burden. Understanding Merchant Discount Rate (MDR) is key to comparing India’s payment landscape.

    What is MDR?

    Merchant Discount Rate (MDR) is the fee merchants pay for processing digital payments. This charge is typically divided among banks, payment networks, and app providers. Although it is a merchant-side cost, it influences business decisions and pricing strategies.

    UPI: Free for Consumers, New Merchant Fee Above ₹2,000

    UPI remains free for consumer-to-consumer transfers, with no upper limit. However, from October 15, 2026, NPCI introduces a 0.4% MDR on person-to-merchant transactions above ₹2,000. This charge is capped at ₹300 for payments of ₹75,000 or more. For instance, a ₹50,000 payment incurs ₹200 in MDR, while a ₹1 lakh payment costs only ₹300 due to the cap. Special sectors like railways, telecom, insurance, fuel, and agriculture inputs attract a flat ₹5 charge.

    Small merchants receiving up to ₹1 lakh per month through UPI QR codes continue to enjoy zero MDR on all transactions. Those crossing the threshold for three consecutive months are moved to the standard category. NPCI estimates this new fee will affect only about 4% of merchant transactions, mostly larger ones. Consumer platform fees and merchant surcharges are prohibited under the new rules.

    Debit Cards: Regulated and Tiered MDR

    Debit-card MDR is set by the RBI, with different caps for merchant categories and acceptance methods. Small merchants and QR-based payments enjoy lower rates, while larger merchants using card machines or online checkout face higher limits. RuPay debit cards benefit from a zero-MDR policy with no cap, making them a cost-effective choice for smaller everyday purchases.

    Credit Cards: Higher Cost, Commercially Negotiated

    Credit-card MDR is not fixed by regulation but is determined through commercial agreements between merchants and banks. Industry estimates place it between 1.5% and 2.5%. This higher cost funds rewards, cashback, and other card perks. Additionally, credit cards carry other fees like annual charges, interest on unpaid balances, late fees, and cash-advance fees. Consumers who pay their bill in full each month avoid most of these extra costs, but carrying a balance quickly becomes expensive.

    RuPay Credit Cards on UPI: A Separate Rulebook

    Eligible RuPay credit cards can be linked to UPI apps for merchant payments, but these transactions follow credit-card rules, not standard UPI zero-MDR rules. Small offline merchants get nil MDR up to ₹2,000; beyond that, standard credit-card MDR applies. The key difference is the source of funds—a credit line versus a bank account.

    Comparsion: Which Is Cheapest?

    For everyday purchases under ₹2,000, all three methods cost the same to consumers. The differences emerge for merchants processing high volumes or handling larger transactions. UPI’s new capped fee is modest compared to credit-card MDR, while debit cards remain regulated and relatively low. Merchants are likely to steer customers toward cheaper methods, such as UPI or RuPay debit cards, especially for larger payments.

    Final Thoughts

    India’s digital payment system is moving beyond a simple free-vs-fee classification. The real cost lies in the merchant-side MDR, not in visible customer charges. As UPI scales, the new merchant fee above ₹2,000 aims to sustain its infrastructure. Debit cards stay regulated, and credit cards carry premium costs tied to rewards and lending. Understanding these dynamics helps both merchants and consumers make informed choices.

    Frequently Asked Questions

    Is UPI free for customers in India?

    Yes, eligible UPI payments do not carry a consumer transaction fee. From October 15, 2026, specified merchant UPI payments above ₹2,000 will incur a merchant-side MDR, but merchants cannot pass this cost on to customers.

    What is MDR in digital payments?

    MDR is the processing charge paid by merchants for accepting certain digital payment methods. It is primarily a merchant-side cost and does not automatically mean a separate customer fee.

    Is credit card MDR higher than debit card MDR?

    Generally, yes. Debit-card MDR is regulated by RBI, while credit-card MDR is commercially negotiated. Industry estimates commonly place credit-card MDR above debit-card MDR.

    Can a RuPay credit card be used through UPI?

    Yes, eligible RuPay credit cards can be linked to supported UPI apps for merchant payments. However, the transaction is funded by the credit card, so it follows credit-card rules rather than standard UPI rules.

    Who pays the UPI MDR above ₹2,000?

    The merchant pays the MDR on eligible person-to-merchant UPI transactions above ₹2,000. Customers should not be charged a separate UPI transaction fee for this MDR.

  • Xiaomi 17T vs OnePlus 15R: Which Mid-Premium Phone Wins in 2026?

    Xiaomi 17T vs OnePlus 15R: Which Mid-Premium Phone Wins in 2026?

    The battle for the mid-premium smartphone segment continues in 2026 with two compelling contenders: the Xiaomi 17T and the OnePlus 15R. Both devices pack flagship-level specifications but cater to different priorities. OnePlus leans into raw performance, display fluidity, and marathon battery life, while Xiaomi focuses on optical zoom photography, screen brightness, and a compact design.

    Price Comparison

    According to listings on 91mobiles, the OnePlus 15R starts at Rs. 54,999 for the 12GB+256GB variant, while the 12GB+512GB version costs Rs. 59,999. The Xiaomi 17T’s 12GB+256GB model is priced higher at Rs. 64,999. Retail offers and bank discounts can shift these prices, so checking live rates is recommended.

    Performance

    The OnePlus 15R is powered by Qualcomm’s Snapdragon 8 Gen 5, while the Xiaomi 17T uses MediaTek’s Dimensity 8500 Ultra. In benchmark tests reported by 91mobiles, the OnePlus scored 9,363 on Geekbench multi-core versus 6,860 for the Xiaomi, and roughly 2.95 million on AnTuTu compared to 2.13 million. This gives the OnePlus a clear edge for gaming and heavy multitasking, though real-world performance also depends on thermal management and software optimization.

    Display

    The OnePlus 15R features a 6.83-inch AMOLED panel with a 165Hz refresh rate, supporting a billion colors and HDR Vivid. The Xiaomi 17T has a smaller 6.59-inch AMOLED display at 120Hz but adds Dolby Vision, HDR10+, and a claimed peak brightness of 3,500 nits. Xiaomi’s screen is better for HDR content and outdoor visibility, while OnePlus offers a smoother experience for gamers.

    Camera

    Both phones share a 50MP main sensor and a 32MP front camera. The key difference lies in the secondary lens: Xiaomi includes a 50MP periscope telephoto with 5x optical zoom and a 115mm equivalent focal length, enabling true optical zoom for distant subjects. OnePlus opts for an 8MP ultrawide lens with no telephoto. For photography enthusiasts who value zoom, the Xiaomi 17T is the clear winner.

    Battery and Charging

    OnePlus packs a massive 7,400mAh battery with 80W SUPERVOOC charging, while Xiaomi uses a 6,500mAh silicon-carbon cell with 67W charging. In PCMark battery tests, the OnePlus lasted 18 hours 13 minutes against 14 hours 45 minutes for the Xiaomi. However, real-world endurance may vary. The OnePlus also features IP69K dust/water resistance.

    Which One Should You Buy?

    The OnePlus 15R is better suited for gamers, power users, and anyone who prioritizes battery life. The Xiaomi 17T is ideal for photographers, travelers, and those who value a bright, compact display with excellent HDR support. Neither device is universally superior—the right choice depends on your personal usage patterns.

    For further reading, check out our comparisons of the Motorola Edge 70 Max vs OnePlus 15R vs iQOO 15R, and the Xiaomi 17T launch coverage in India.

  • Why Product Managers Must Develop AI Strategy Skills in 2026

    Why Product Managers Must Develop AI Strategy Skills in 2026

    AI is transforming product management beyond feature development. In 2026, product managers (PMs) need more than just the ability to use AI tools—they need a strategic framework to assess models, data, costs, metrics, and risks. This shift strengthens roadmap decisions and connects technology directly to customer and business value.

    The AI Strategy Gap

    A 2026 Productside survey of over 250 product professionals found that roughly four in five product managers use AI regularly. Yet only about one in four have a clear strategy behind that use. The real challenge is no longer AI adoption—it’s making strategic decisions about where and how AI should be applied.

    Why the Gap Exists

    Traditional PM skills—customer research, prioritization, stakeholder alignment—still matter. But AI systems behave differently from traditional software. Outputs can be probabilistic, performance varies across inputs, and results depend heavily on data quality. Treating an AI feature like a normal feature leads to misjudged timelines, underestimated risk, and unclear definitions of “done.” When PMs lack AI fluency, engineering and data teams increasingly take over strategic discussions, eroding the PM’s decision-making influence.

    What AI Strategy Means for Product Managers

    For a product manager, AI strategy involves deciding where AI creates measurable value, what data and model capabilities a feature needs, what risks need control, and how success gets measured. This definition gives the work structure rather than treating AI fluency as a vague catchall. Key components include:

    • Model judgment: Understanding model capabilities, limitations, and trade-offs.
    • Data readiness: Assessing whether available data is sufficient and reliable for the AI feature.
    • AI-specific metrics: Defining success metrics that account for probabilistic outputs.
    • Risk management: Identifying and mitigating ethical, operational, and performance risks.
    • User trust: Ensuring the AI system earns and maintains user confidence.

    Each of these areas involves real trade-offs, not a simple checklist. Skipping any one tends to surface after launch, when fixing it costs more.

    The Business Case, Not Just the Technical One

    Companies invest in AI expecting measurable returns—cost reduction, faster workflows, or new revenue. A PM who treats AI as a buzzword will struggle to defend roadmap decisions when finance leaders ask about return on investment. AI features carry inference, infrastructure, and monitoring costs that traditional features don’t. These costs can shift as usage scales, making cost a product metric, not just an engineering concern. A PM needs to judge whether a feature’s expected value justifies its ongoing running cost, not just its build cost. That is a business skill, not a technical one.

    How PMs Are Closing the Gap

    The most practical path is learning through live product work—pairing directly with data scientists on real projects, reading model evaluation reports, and testing prompts and failure cases firsthand. This approach doesn’t replace domain expertise or customer empathy; it complements them. A PM who understands both the customer problem and the AI system built to solve it holds a stronger position than one who only understands half the picture.

    Final Thought

    AI strategy doesn’t turn a product manager into an engineer. It changes the questions a PM is asked to answer. Someone who can connect customer value with model capability, data readiness, cost, and risk can participate in AI decisions from roadmap planning through launch. Closing the gap between using AI and having a strategy for it gives a team a stronger basis for faster, more defensible product decisions. In 2026, that connection is becoming a core part of product management.

  • Crypto in 2026: The Macro Forces Shaping Bitcoin and Ethereum Markets

    Crypto in 2026: The Macro Forces Shaping Bitcoin and Ethereum Markets

    Crypto stopped trading on its own terms a while back. Bitcoin and Ethereum now move with the same signals that shake stocks and bonds: interest rates, inflation, the dollar, and job numbers. The thread connecting all of it is liquidity. Fed policy shifts financial conditions, and financial conditions decide how much capital investors are willing to put into assets that don’t pay a yield.

    The Fed’s Rate Hike Resets Expectations

    On September 16th, the Federal Reserve raised its benchmark rate by 25 basis points to a range of 3.75% to 4.00%. It was the first hike in three years, and the vote was unanimous. For most of 2026, the conversation had centered on when rate cuts might arrive. That conversation flipped. The Fed’s updated projections showed roughly 16 of 18 officials expecting at least one more increase before the year ends.

    For crypto, this matters in a direct way. Low rates loosen liquidity and push investors toward riskier assets. High rates tighten it and pull money toward safer ground. A hiking cycle raises the cost of holding something like Bitcoin, which pays no interest while it sits in a wallet.

    Inflation and Jobs Data Set the Pace

    Inflation numbers don’t just move markets for a single trading session. They shift expectations around future rate decisions, and those expectations shape how funds position their crypto exposure for weeks or months afterwards. The Fed’s own statement pointed to inflation still running well above its 2% target, which was the core justification for the hike.

    Jobs data plays a similar role from a different angle. In August, US employers added 162,000 jobs, and unemployment held at 4.1%. A steady labor market gives the Fed room to keep policy tight if inflation stays sticky. Weaker numbers would pull in the opposite direction. Markets watch this release as closely as the rate decision itself.

    Dollar and Treasury Yields Quietly Set the Tone

    Bitcoin tends to weaken when the dollar strengthens, particularly when that strength reflects tighter financial conditions in the US. The link isn’t fixed or permanent, but it shows up often enough to matter.

    Treasury yields work through a similar mechanism. When government bonds pay more, they raise the bar for what a riskier asset needs to offer before it looks worth holding. That’s the opportunity cost at work: money doesn’t sit idle, but it goes wherever the return looks strongest relative to the risk.

    Oil Prices Add a Second Layer

    Oil doesn’t move Bitcoin on its own. It moves inflation first. Higher oil prices push inflation expectations up, which pushes the Fed toward holding rates or hiking further, which keeps liquidity tight, which then filters into how much capital flows into crypto. It’s a chain, not a straight line.

    Brent crude has traded above USD 100 a barrel through September, driven largely by supply disruptions tied to conflict in the Middle East. That pressure fed directly into the inflation numbers behind the Fed’s decision this month.

    Crypto Still Writes Its Own Chapters

    Macro conditions set the weather. What happens inside individual crypto assets is a separate story. Spot Bitcoin ETF flows, stablecoin liquidity, on-chain activity, protocol revenue, and regulatory moves all shape how a given token performs, sometimes independent of what the Fed just announced. A project with strong fundamentals can hold its ground even when the broader backdrop turns hostile, and a weak one can fall further even when conditions ease.

    Anyone tracking this space needs to watch several signals together rather than one in isolation. Fed decisions set the monetary tone. Inflation and jobs data shape what comes next. The dollar and Treasury yields reveal the state of financial conditions more broadly. Oil adds a layer of inflation risk that can arrive from outside the usual channels. And on the crypto side, ETF flows, stablecoin activity, and regulatory shifts explain why one asset can diverge sharply from the pack.

    Final Thought

    The next real test isn’t the September hike itself but whether the Fed follows through in December. A second increase would confirm a genuine shift in the rate cycle rather than a one-off correction, and that distinction will matter more to crypto positioning than any single headline number this year.

  • Free Fire MAX Redeem Codes for September 20, 2026 – Grab Free Skins, Emotes, and In-Game Rewards

    Free Fire MAX Redeem Codes for September 20, 2026 – Grab Free Skins, Emotes, and In-Game Rewards

    Garena Free Fire MAX players can seize another chance to claim exclusive in-game rewards without spending diamonds. The latest batch of redeem codes for September 20, 2026, is now available, offering free skins, emotes, and other prizes. However, these codes are time-sensitive, region-specific, and subject to redemption limits, so prompt action is essential.

    Free Fire MAX Redeem Codes for Today, September 20

    Below is the complete list of redeem codes valid for September 20, 2026. Note that not every code will work for all players due to regional restrictions, account eligibility, and usage caps. Enter each code exactly as shown.

    • BR43FMAPYEZZUPQ7X5NMJ64VS9QK2L6VP3MRFFR4G3HM5YJN6KWMFJVMQQYGFZ5X1C7V9B2N
    • FT4E9Y5U1I3OFP9O1I5U3Y2TFM6N1B8V3C4XFA3S7D5F1G9HFK3J9H5G1F7DFU1I5O3P7A9SF7F9A3B2K6G8F
    • E2R8T6Y4U1IP3LX6V9TM2QHRD3TZK7WME65ZRW3J4N8VX56WD2ATK3ZEA55FFPLUFBVSLOTJ3ZKQ57Z2P2P

    These codes were published for September 20, 2026, but their current validity cannot be guaranteed. Availability depends on the server or region, redemption limits, account eligibility, and each code’s validity period. Players should attempt redemption as soon as possible.

    How to Redeem Free Fire MAX Codes

    Follow these steps to redeem a code through Garena’s official rewards platform:

    1. Visit the official Garena Free Fire MAX Rewards Redemption website.
    2. Log in using the account linked to your Free Fire MAX profile.
    3. Select a redeem code from the list above.
    4. Enter the code carefully in the designated redemption field.
    5. Click the Confirm button to submit the code.

    If the code is valid and successfully redeemed, the corresponding reward will be delivered to your in-game mailbox. Double-check each character — an incorrect entry can cause the redemption to fail. Guest accounts may not be eligible; link your game account to a supported login method before attempting redemption.

    Conclusion

    Free Fire MAX redeem codes provide a valuable opportunity to earn in-game items without direct purchase. However, success is not guaranteed, as codes can expire, reach their usage limits, or be restricted by region. To maximize your chances, try the codes immediately and ensure your account is properly linked.

  • When Low Graphics Settings Actually Improve FPS — And When They Don’t

    When Low Graphics Settings Actually Improve FPS — And When They Don’t

    Lowering graphics settings reduces GPU workload, which can raise FPS, but only when the GPU is the actual performance limit. Not all settings carry equal weight. Resolution, shadows, and anti-aliasing tend to have the largest impact on frame rate. Frame-time consistency matters as much as average FPS. A stable 80 FPS often feels smoother than an inconsistent 100 FPS.

    Just switching everything to Low doesn’t fix your game. It only masks the problem. Your FPS might go up, but the real slowdown could still be there. So the first step is figuring out what’s actually causing it. The GPU renders your visuals. The CPU handles logic, AI, and physics. If the GPU’s overloaded, cutting back on visual settings lightens its work. That gives you smoother, steadier frame rates.

    What Changes When Graphics Go Low

    Not every setting affects performance equally. Here is what actually moves the needle.

    • Resolution is often the single most effective lever. Fewer pixels mean less work per frame. Dropping from 1440p to 1080p can produce a meaningful FPS improvement when the GPU is already under pressure.
    • Shadows are expensive in games with complex real-time lighting. Reducing shadow quality from Ultra to Medium frequently delivers a solid performance gain with very little visible difference during fast-paced gameplay.
    • Anti-aliasing is more nuanced. Some techniques are relatively light. Others, like supersampling, are demanding. The performance impact depends on which method the game uses and which options are available. Switching to a less demanding AA method often helps.
    • Textures work differently. High-resolution textures consume VRAM rather than raw processing power. If the GPU has enough VRAM for the game’s recommended settings, texture quality often has a smaller effect on FPS. Keeping textures higher while reducing other settings is generally a smart trade when VRAM headroom allows it.

    When Lower Settings Do Not Help

    This is the part most guides skip. Lowering graphics only improves performance when the GPU is the limiting factor. When something else is holding the game back, the settings become almost irrelevant.

    A struggling CPU produces stutters and inconsistent frame pacing rather than a simple FPS drop. Games that are heavy on AI, physics, or large open worlds stress the CPU more than the GPU. Turning shadows down will not help if the processor is already at its limit.

    Insufficient RAM can cause the system to rely on slower storage, which leads to stuttering regardless of what the graphics settings are set to. A slow storage drive can create asset-streaming delays in open-world games that continuously load terrain and objects. These are system-level problems. They need system-level solutions.

    How to Find the Real Bottleneck

    There is a quick test worth doing before changing any settings. Run the game at the normal resolution and note the FPS. Then drop the resolution substantially and check again. If FPS rises sharply, the GPU is the limiting factor. Lowering graphics settings will help. If FPS stays roughly the same, the GPU was not the constraint. The problem lies with the CPU, RAM, or another system component. Lowering graphics settings in that case will change how the game looks without improving how it runs.

    Monitoring GPU and CPU utilization during gameplay adds more evidence. Utilization numbers alone are not conclusive, but they help narrow down where the strain is concentrated.

    FPS Is Not the Full Picture

    Average FPS is the number most players watch. It is not the only thing that matters. Frame-time consistency describes how evenly frames are delivered. A game producing 100 FPS but spiking unevenly will feel rougher than one holding 80 FPS steadily. Lowering graphics settings can stabilize frame delivery even when the average FPS change is modest. The improvement in smoothness is real, even if the numbers look similar.

    Where to Start

    The goal is not minimum settings across the board. It is removing the settings with the highest performance cost while keeping the ones that preserve visual quality.

    • Lower resolution or render scale first, especially when GPU load is high.
    • Reduce shadow quality to medium.
    • Switch to a lighter anti-aliasing method if alternatives are available.
    • Keep texture quality higher as long as VRAM usage stays within the card’s limit.

    If these changes produce a clear FPS improvement, the GPU was the constraint. If the numbers barely move, the issue lies elsewhere and needs a different approach.

    Final Thoughts

    Graphics settings are a tool for managing hardware load, not a quality sacrifice. The players who get the most out of their systems are not the ones who blindly select Low. They are the ones who understand what each setting costs and what the hardware can actually handle. As game engines grow more complex and rendering pipelines continue to evolve, that diagnostic understanding will matter more, not less.

    FAQs

    1. Does lowering graphics settings increase FPS? Yes, lowering graphics settings can increase FPS when the GPU is the main performance bottleneck. The improvement depends on the game, hardware, and settings changed.
    2. Which graphics setting affects FPS the most? Resolution is often one of the biggest performance factors because it directly changes the number of pixels the GPU must render. Shadows, reflections, and demanding effects can also have a major impact.
    3. Does lowering texture quality improve gaming performance? Not always. Texture quality mainly affects VRAM usage. If your GPU has enough VRAM, lowering textures may provide little FPS improvement compared with reducing resolution or demanding visual effects.
    4. Why does my game still stutter on Low graphics? Stuttering can occur even on Low settings if the CPU, RAM, storage, thermals, or game engine is limiting performance. Frame-time consistency also matters, not just average FPS.
    5. How can I tell if my GPU is causing low FPS? Lower the game’s resolution significantly and compare the FPS. A sharp increase suggests the game is likely GPU-limited, while little change may indicate a CPU or other system limitation.
  • The Steep Price of Seemingly Minor IT Incidents: Why Your Organization Needs a Workstoppage Framework

    The Steep Price of Seemingly Minor IT Incidents: Why Your Organization Needs a Workstoppage Framework

    Modern IT organizations have mature processes for handling major incidents. When a critical application fails or becomes unavailable to hundreds of users, established frameworks immediately activate. Teams follow defined procedures for triage, escalation, communication, and recovery.

    Yet another type of incident often receives far less attention despite its business impact: the complete loss of productivity experienced by an individual employee.

    An employee unable to access a workstation, email, VPN, multifactor authentication, or a critical application may represent only one affected user from an IT support perspective. From a business perspective, that employee may be completely unable to perform their job.

    These incidents are known as workstoppages—and most organizations are measuring them incorrectly.

    Traditional incident-management processes may classify workstoppages as routine support tickets because they affect only one person. Organizations should instead treat them as a distinct operational category with dedicated identification criteria, routing rules, service objectives, and performance measures.

    Why Traditional Incident Prioritization Creates a Blind Spot

    Most incident-management systems determine priority through a combination of impact and urgency. Impact is often associated with the number of affected users, systems, or business units, while urgency reflects how quickly action is required.

    This approach works for large outages but can underestimate the cost of complete productivity loss at the individual level. A single-user incident may receive a low priority even when its effect on that employee is absolute.

    Consider a salesperson unable to access CRM before a client meeting, a support agent locked out of the platform used to manage active cases, or a field technician unable to authenticate at a customer site. Each incident has a limited technical footprint, but the affected employee’s productive work has stopped.

    These incidents often enter the same queue as routine requests and compete for attention according to standard service-level agreements. Consequently, a password reset for someone with an available workaround may receive the same classification as an authentication failure that has brought another employee’s work to a complete halt.

    The issue is not that existing frameworks are wrong. They are generally designed to measure service impact, while the business also needs to understand productivity impact.

    A workstoppage framework should distinguish among three conditions:

    • Complete inability to perform primary job responsibilities.
    • A workaround is either unavailable or impractical.
    • Productive work has stopped for a measurable period.

    Repeated workstoppages also affect the digital employee experience. Research has linked workplace interruptions with increased workload, lost concentration, and lower performance. A study of office workers examined how the frequency and duration of interruptions affect perceived workload, while a review of digital working identified technostress and overload among the consequences of poorly managed workplace technology.

    Building a Workstoppage Maturity Model

    Organizations do not need to replace their existing incident-management practices. They can introduce a workstoppage framework alongside their current ITSM processes.

    Level 1: Reactive Support

    Employees who are completely unable to work follow the same process as those experiencing routine technical problems. The service desk records the affected technology but may not determine whether the employee can still perform their primary responsibilities.

    Level 2: Workstoppage Identification

    Service-desk personnel begin identifying complete losses of productive capability. A simple intake question—’Can the employee continue performing their primary job responsibilities?’—can establish whether an incident qualifies.

    The service desk should also determine whether a workaround exists, whether a customer interaction or transaction is at risk, and when productive work stopped.

    Level 3: Priority Recovery Routing

    Workstoppages receive dedicated routing and escalation paths. Tickets move directly to the appropriate resolver group rather than waiting in a general queue.

    This does not mean every workstoppage should trigger a major-incident response. The goal is proportional urgency: restoring productivity quickly without unnecessarily disrupting unrelated teams.

    Organizations should also separate productivity restoration from permanent resolution. A temporary device, alternative authentication method, backup connection, or virtual desktop may allow an employee to resume work before the underlying problem is fully resolved.

    Level 4: Automated Detection

    Organizations begin using automation and AI to identify productivity-blocking events. Authentication failures, account lockouts, endpoint problems, VPN interruptions, and application crashes can generate signals before an employee submits a ticket.

    Those signals can be correlated with information about the employee’s role, affected service, and available alternatives. The incident can then be classified and routed without relying entirely on manual triage.

    This transition is already underway. Reporting on AI adoption by ITSM teams found that organizations are applying AI to incident resolution, monitoring, knowledge management, and proactive incident prevention. However, many still emphasize ticket activity rather than business outcomes.

    Level 5: Productivity-Centric Operations

    Organizations measure productivity recovery, analyze workstoppage trends, and incorporate employee downtime into operational decisions. Leaders can identify which applications, devices, or processes cause the most workstoppages and prioritize preventive investments accordingly.

    Measuring and Operationalizing Workstoppages

    Many IT organizations track Mean Time to Resolution (MTTR) or Mean Time to Repair. These metrics remain useful, but they do not always capture the outcome that matters most: how quickly an employee can resume productive work.

    A complementary measure is Time to Productivity Restoration (TPR). TPR measures the time between the loss of productive capability and the point at which an employee can again perform their primary responsibilities.

    Suppose IT provides a loaner device within 30 minutes, but repairing the original workstation takes two days. The technical resolution time is two days, while TPR is 30 minutes.

    Tracking both measures provides a clearer picture:

    • MTTR measures technical resolution.
    • TPR measures business recovery.
    • The difference shows how effectively IT uses workarounds.

    Organizations can establish specific service objectives, including:

    • Workstoppage identification within 15 minutes.
    • Direct assignment to the correct resolver group.
    • Productivity restoration within an hour where feasible.
    • Separate tracking of root‑cause resolution.

    The financial impact can be estimated using a simple calculation:

    Workstoppage cost = Loaded hourly employee cost × Nonproductive hours

    Organizations may also include measurable downstream costs such as missed appointments, delayed transactions, overtime, or lost revenue. Even a conservative calculation based only on employee time can reveal substantial cumulative losses across hundreds or thousands of incidents.

    Implementation does not necessarily require a new platform. Most enterprise ITSM systems already provide configurable fields, routing rules, escalation workflows, automation, and reporting. Organizations can begin by adding a workstoppage flag to incident forms and measuring TPR before introducing more advanced detection and analytics.

    Major incidents will always deserve immediate attention. But organizations focused exclusively on large outages may be overlooking a significant source of operational inefficiency.

    By recognizing workstoppages as a distinct category and measuring success through restored productivity rather than ticket closure alone, IT teams can improve business performance and the employee experience. The future may involve predictive detection and autonomous remediation, but organizations can begin today by identifying workstoppages consistently and prioritizing the outcome that matters: getting employees back to productive work.

    Jisu Dasgupta has more than 15 years of experience helping organizations make technology work for the business. He has worked across oil and gas, retail, the federal government, hospitality, and other sectors through organizations including HCL, IBM, Accenture, and Maximus. Jisu holds an MS in Information Science and Engineering, a postgraduate qualification in systems and operations, and certifications in ITIL, ServiceNow, AI, and cloud technologies.

  • Amazon’s Weekend Sale: Top Fujifilm Instax Cameras, Instant Film, and Printers to Shop

    Amazon’s Weekend Sale: Top Fujifilm Instax Cameras, Instant Film, and Printers to Shop

    Instant cameras are making a strong comeback, especially among people who want tangible photos rather than files buried in a smartphone gallery. Fujifilm’s Instax lineup remains one of the most popular choices, offering both instant cameras and smartphone printers in a range of formats and price points. If you’re planning to pick one up this weekend, Amazon is featuring several Instax products worth a closer look.

    Important: Prices and availability can shift depending on the seller and ongoing offers, so always confirm the final amount before checking out.

    Budget-Friendly Instant Cameras

    Fujifilm Instax Mini 12

    The Instax Mini 12 is a solid entry point for first-time instant camera buyers. It keeps the experience simple with an easy-to-use design and credit-card-sized Mini prints that work well for parties, holidays, birthdays, or casual photos with friends. Fujifilm’s India store lists the Mini 12 at ₹7,499, against an MRP of ₹9,499.

    Fujifilm Instax Mini 13

    If you want another compact option, the Instax Mini 13 uses the same Mini format and is easy to carry for scrapbooks, journals, or photo collections. Before buying, check whether the Amazon listing includes film or accessories; a bundle can sometimes offer better value than buying the camera and film separately.

    Fujifilm Instax Mini 99

    The Mini 99 is aimed at users who want more creative control. It includes six colour effects and shooting modes like Bulb, Double Exposure, Sports, Macro, and Vignette. Fujifilm currently lists it at ₹17,999 on its India website, compared with an MRP of ₹20,999.

    Smartphone Printers for Instant Photos

    Fujifilm Instax Mini Link 3

    Not everyone needs another camera. If most of your photos live on your phone, the Instax Mini Link 3 is a practical alternative. This portable printer turns smartphone pictures into physical Instax Mini prints, making it useful for albums, journal decorations, or small personalised gifts.

    Fujifilm Instax Link Wide

    The Instax Link Wide is a good option if you prefer larger prints. It uses the wider Instax format and prints directly from a smartphone, with editing options and different print modes available through the companion app. Fujifilm lists it at ₹16,999, down from an MRP of ₹21,999.

    Fujifilm Instax Square Link

    For something different from rectangular Mini prints, the Instax Square Link works with Fujifilm’s square-format film. It connects to a smartphone and prints existing photos, making it a good fit for people who like the look of square images for albums, walls, or scrapbooks.

    Don’t Forget the Film

    An Instax camera is only part of the expense. Standard Instax Mini film works with several cameras and printers in the Mini range, and Amazon often sells it in different pack sizes. Compare the cost per print instead of only looking at the overall pack price, especially if you expect to shoot regularly.

    What to Check Before You Buy

    • Current price and seller rating
    • Warranty coverage and return policy
    • Whether film or accessories are included in the bundle
    • Film compatibility with the camera or printer
    • Delivery dates and availability

    Final Take

    The Instax range gives shoppers several ways to create physical photographs without relying on a traditional printing service. The Mini 12 keeps things simple, while the Mini 99 offers more advanced controls. Smartphone printers make sense if most of your photos are already on your phone. Just remember to factor in the ongoing cost of film and confirm the current deal details on Amazon before completing your purchase.

    Frequently Asked Questions

    Which Fujifilm Instax camera is best for beginners?

    The Instax Mini 12 is a straightforward choice for beginners, offering simple controls, compact handling, and credit-card-sized prints for everyday photography.

    Are Fujifilm Instax cameras worth buying?

    Instax cameras can be worthwhile for people who enjoy physical photographs. However, buyers should also consider recurring film costs, camera features, and how frequently they plan to use them.

    Can Instax printers print photos from smartphones?

    Yes, compatible Instax printers can turn smartphone photos into physical instant prints. Models such as the Mini Link 3 connect through Fujifilm’s companion app.

    How much does Fujifilm Instax film cost?

    Instax film prices vary by format, pack size, and seller. Comparing the cost per print is useful because regular photography can make film an ongoing expense.

    What should I check before buying an Instax product on Amazon?

    Check the current price, seller ratings, warranty, included accessories, film compatibility, and delivery details. Prices and availability can change, especially during weekend sales.