Category: Big Data

  • Your Complete Data Analytics Cheat Sheet: Excel, SQL, Python, and Power BI

    Your Complete Data Analytics Cheat Sheet: Excel, SQL, Python, and Power BI

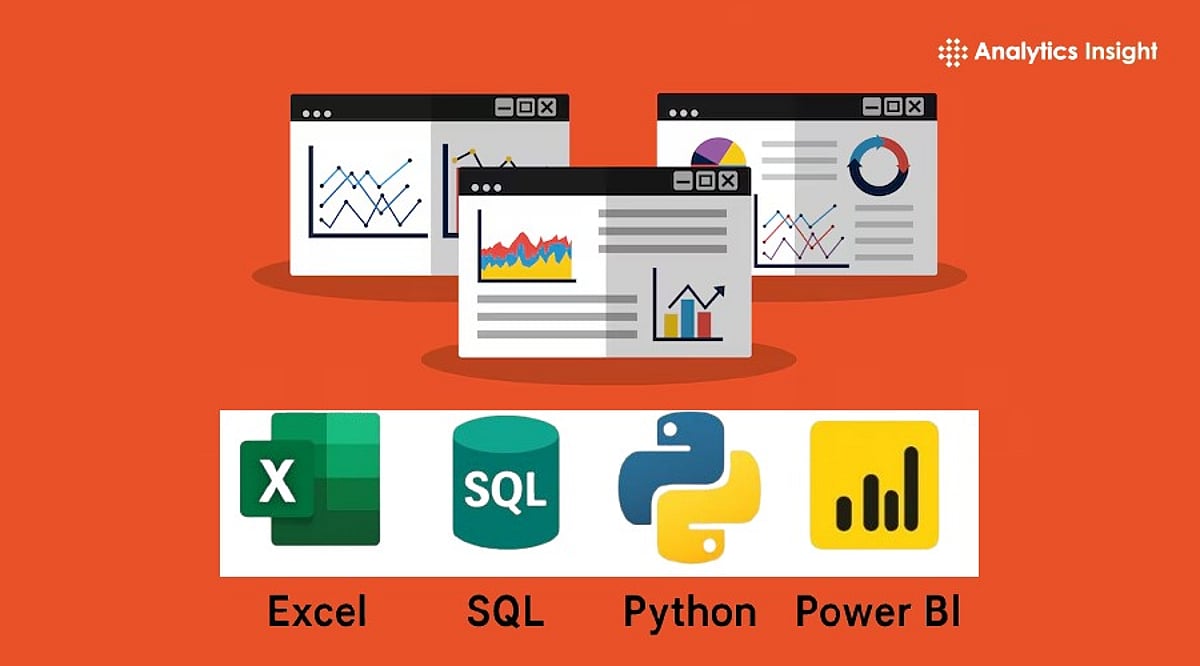
    Data analytics is the process of examining data to uncover useful insights. Every organization collects vast amounts of information daily—sales figures, customer feedback, website traffic, and growth metrics. Companies leverage this data to make smarter decisions and plan ahead. Mastering data analytics is a highly sought-after skill, and employers increasingly value professionals who can work across multiple tools. The four most popular tools in this domain are Excel, SQL, Python, and Power BI. Each serves a distinct purpose: Excel handles calculations and reporting; SQL retrieves data from databases; Power BI transforms data into visual dashboards; and Python manages large datasets and complex analyses. This guide provides a concise cheat sheet covering essential formulas, commands, and functions for these tools.

    Excel Cheat Sheet

    Excel remains a staple for everyday data analysis due to its simplicity and versatility. It is widely used for creating reports, analyzing numbers, and organizing information. Key formulas include SUM, AVERAGE, COUNT, MIN, and MAX for basic calculations; IF for conditional logic; XLOOKUP and VLOOKUP for searching large tables; and INDEX and MATCH for advanced lookups. Essential features include Pivot Tables to summarize data, Conditional Formatting to highlight key values, Power Query for data cleaning, and Data Validation to prevent input errors. Industry surveys indicate that over 75% of data professionals still use Excel daily.

    SQL Cheat Sheet

    SQL (Structured Query Language) is the standard for working with relational databases. Most businesses store critical data in databases, and SQL enables quick and efficient retrieval. Core commands include SELECT, FROM, WHERE, ORDER BY, GROUP BY, HAVING, DISTINCT, and LIMIT. Joins are crucial: INNER JOIN returns matching records; LEFT JOIN returns all records from the left table; RIGHT JOIN returns all from the right; and FULL OUTER JOIN returns all from both. Advanced features include Common Table Expressions (CTEs), CASE statements, subqueries, window functions (ROW_NUMBER, RANK, DENSE_RANK, LEAD, LAG). SQL remains indispensable because most business data resides in databases.

    Python Cheat Sheet

    Python is a powerful programming language for data analysis, valued for its readability and extensive library ecosystem. The top five libraries are Pandas (data manipulation), NumPy (numerical operations), Matplotlib and Plotly (visualization), and Scikit-learn (machine learning). Key Pandas commands include read_csv(), head(), info(), describe(), shape, columns, groupby(), merge(), sort_values(), drop_duplicates(), and fillna(). Python excels at data cleansing, automation, statistical analysis, and building AI models.

    Power BI Cheat Sheet

    Power BI, a Microsoft business intelligence tool, converts raw data into interactive charts, reports, and dashboards. Core components include Power Query (data preparation), Data Model (table relationships), DAX (formulas), Visualizations (charts), Dashboards, and Power BI Service (cloud sharing). Common chart types are bar, line, column, pie, maps, KPI cards, matrix tables, and slicers. According to Microsoft, Power BI is used by over 375,000 organizations and has more than 30 million monthly active users, reflecting its widespread adoption.

    Latest Trends in Data Analytics

    Data analytics continues to evolve with emerging technologies. Artificial intelligence accelerates analysis, enabling tools to answer business questions via natural language instead of code. Cloud technology facilitates storage and processing of massive datasets. Real-time reporting is increasingly common as organizations demand up-to-the-minute insights. Enhanced data security and self-service analytics are also top priorities. Industry experts highlight AI-powered analytics, robust data governance, and accessible business intelligence as the biggest current trends.

    Final Thoughts

    A comprehensive data analytics cheat sheet saves time and streamlines workflows. Excel handles numerical tasks and reporting; SQL retrieves database information; Python manages large-scale and advanced analysis; Power BI creates clear visual dashboards. Together, these four tools cover every essential aspect of data analytics. Mastering them builds a solid foundation for a successful career in today’s data-driven world.

    Frequently Asked Questions

    1. What is a data analytics cheat sheet? A quick reference guide summarizing important formulas, commands, and functions for popular analytics tools.
    2. Why is Excel important for data analytics? It helps organize data, perform calculations, create reports, and identify trends using simple formulas and built-in features.
    3. Why should SQL be part of data analytics skills? SQL enables access, filtering, and analysis of data stored in databases, which most businesses rely on daily.
    4. What is Python used for in data analytics? Python is used for data cleaning, task automation, visualization, statistical analysis, and building machine learning models.
    5. Why do companies use Power BI? Power BI transforms raw data into clear dashboards and reports, helping businesses understand information and make better decisions.
  • Selecting the Best Retail Business Intelligence Software in 2026: Key Considerations

    Selecting the Best Retail Business Intelligence Software in 2026: Key Considerations

    Choosing the right retail business intelligence (BI) software in 2026 requires a strategic approach that balances technical capabilities with business needs. The following factors are critical for making an informed decision.

    Data Integration

    Opt for software that seamlessly connects with point-of-sale (POS) systems, ecommerce platforms, CRM, ERP, and inventory databases. Unified data integration provides a single source of truth for comprehensive business insights.

    Real-Time Analytics

    Prioritize dashboards that deliver live updates on sales, customer behavior, inventory levels, and revenue. Real-time analytics enable faster, more informed decisions in daily retail operations.

    AI-Powered Forecasting

    Select platforms that leverage artificial intelligence to predict demand, optimize stock levels, and improve seasonal planning. AI-powered forecasting enhances operational accuracy and reduces waste.

    Custom Dashboards

    Ensure the software allows customization of dashboards so different teams can monitor the KPIs most relevant to their roles. This improves collaboration and speeds up decision-making across the retail organization.

    Scalability

    Choose a solution that can grow with your business—supporting multiple store locations, expanding product catalogs, and increasing customer data without performance degradation.

    Inventory Intelligence

    Advanced inventory analytics help identify slow-moving products, stock shortages, and replenishment opportunities, significantly reducing operational losses.

    User-Friendly Interface

    An intuitive interface minimizes the learning curve, enabling employees across departments to adopt analytics tools without extensive technical training or delays.

    Security and Compliance

    Verify strong encryption, access controls, and compliance with privacy regulations to protect sensitive business and customer information from threats.

    Pricing and Support

    Compare subscription costs, implementation expenses, and the quality of customer support. Consider future upgrade options before committing to a long-term investment.

  • Big Data Essentials: Hadoop, Spark, Hive, and Kafka Explained Simply

    Big Data Essentials: Hadoop, Spark, Hive, and Kafka Explained Simply

    Data pours in from websites, mobile apps, online shopping platforms, banks, hospitals, factories, and smart devices. To make sense of it all, companies rely on powerful tools that store, process, analyze, and move massive datasets efficiently. Among the most popular are Hadoop, Spark, Hive, and Kafka. This guide breaks down what each tool does and how they work together.

    What Is Big Data?

    Big data refers to datasets so large that traditional software cannot handle them effectively. Every online payment, video stream, and message generates data. Businesses study this data to understand customers, improve products, detect fraud, predict trends, and make smarter decisions.

    Apache Hadoop

    Apache Hadoop is an open-source framework that stores and processes enormous datasets. Instead of saving everything on one computer, Hadoop spreads data across many machines, making the system faster and more resilient. Hadoop has three core components:

    • HDFS (Hadoop Distributed File System): Stores large files across multiple computers and keeps duplicate copies. If one machine fails, data remains safe.
    • YARN: Manages cluster resources, allocating memory and processing power to each task to ensure smooth execution.
    • MapReduce: Breaks a large task into smaller pieces, processes them simultaneously across machines, and then combines the results.

    Companies use Hadoop to store historical records, build data lakes, run ETL jobs, analyze application logs, and generate reports. It can handle petabytes of data—an almost unimaginable volume.

    Apache Spark

    Apache Spark is a lightning-fast data processing engine. It outperforms MapReduce by keeping most data in memory (RAM) rather than repeatedly reading from disk. Spark works with both stored and live data, letting organizations use one tool for diverse workloads.

    Key Spark components include:

    • Spark SQL: Enables SQL queries on structured data.
    • Spark Streaming: Processes real-time data streams.
    • MLlib: Provides machine learning algorithms.
    • GraphX: Analyzes relationships within data.

    Spark is widely used for fraud detection, customer analytics, recommendation engines, predictive modeling, and AI projects. It supports Java, Scala, Python, and R, making it accessible to many developers.

    Apache Hive

    Apache Hive is a data warehouse system built on top of Hadoop. It lets users analyze large datasets using SQL-like commands called HiveQL, which closely resembles standard SQL. This means anyone familiar with SQL can query big data without learning a new language.

    Hive uses a schema-on-read approach: data doesn’t need a predefined structure before storage. The structure is applied only when reading, offering flexibility. Organizations rely on Hive for reporting, dashboard preparation, historical analysis, and business intelligence.

    Apache Kafka

    Apache Kafka is a real-time data streaming platform. It moves data from one system to another almost instantly, triggered by events rather than batch schedules. Kafka’s architecture includes:

    • Producers: Send messages into Kafka.
    • Topics: Organize related messages.
    • Brokers: Store messages reliably.
    • Consumers: Retrieve messages when needed.

    Kafka handles enormous data volumes with minimal delay, ensures data durability, and scales easily. Common use cases include real-time analytics, online payments, website activity tracking, IoT sensor data, application logs, and event-driven architectures.

    How They Work Together

    In a typical big data pipeline, Kafka captures live data from websites, apps, machines, and devices. Hadoop stores that data safely for long-term retention. Spark processes both stored and streaming data at high speed. Hive lets business teams and analysts query the processed results using simple SQL. Together, these tools form a powerful ecosystem for managing and extracting value from massive datasets.

    Latest Developments

    The big data market continues to expand. In April 2026, Apache Hadoop released version 3.5.0, featuring hundreds of bug fixes, performance improvements, and enhanced stability. Another major trend for 2026 is the rapid growth of AI and real-time data processing. More organizations are using Spark for machine learning projects and Kafka as the backbone for fast, event-driven systems. Cloud-native data platforms, lake house architectures, improved data governance, and better monitoring are becoming standard in modern enterprises.

    Final Thoughts

    Hadoop, Spark, Hive, and Kafka each solve a distinct big data challenge. Hadoop stores massive amounts of information securely. Spark processes data with remarkable speed. Hive simplifies analysis with SQL-like commands. Kafka moves live data between systems instantly. Together, they empower businesses to manage vast information, understand their data, and make better decisions in today’s digital world.

    Frequently Asked Questions

    1. What is Hadoop used for? Hadoop splits and stores massive datasets across multiple computers. It is primarily used for long-term data storage, building data lakes, and handling heavy batch-processed workloads securely.
    2. Why is Apache Spark faster than Hadoop MapReduce? Spark processes data directly in memory (RAM) instead of constantly reading and writing to disk. This memory-first architecture can make it up to 100 times faster.
    3. What is Hive used for? Hive acts as a data warehouse layer on top of Hadoop, letting data analysts query massive stored datasets using familiar SQL-like commands called HiveQL.
    4. What is Apache Kafka? Kafka is a real-time data streaming platform that acts as a digital pipeline, instantly moving continuous streams of data from sources like apps or devices to other systems.
    5. Can Hadoop, Spark, Hive, and Kafka work together? Yes. In a typical pipeline, Kafka captures live data streams, Hadoop stores that data safely, Spark cleans and processes it rapidly, and Hive allows teams to query the final results.
  • How Big Data Consulting Maximizes AI ROI Through Superior Data Quality

    How Big Data Consulting Maximizes AI ROI Through Superior Data Quality

    AI systems create value only when they can work with reliable business data. A predictive model trained on incomplete transaction records, a chatbot connected to outdated knowledge bases, or an AI agent using inconsistent customer data will usually produce limited results, regardless of how advanced the underlying model is.

    This is where big data consulting becomes critical for AI ROI. It connects data engineering, governance, integration, analytics, and business measurement into one implementation strategy.

    AI performance in enterprise environments depends heavily on the supporting data infrastructure. Production systems usually require stable ingestion pipelines, storage layers, governance controls, transformation workflows, and monitoring systems to operate reliably at scale.

    Why Does AI ROI Depend on Data Quality More Than on the Model Itself?

    Model performance alone rarely determines whether AI generates measurable ROI. In production environments, data quality often becomes the larger operational constraint.

    AI systems in enterprise environments continuously interact with business data across cloud platforms, operational applications, APIs, and storage environments. When this data lacks consistency, freshness, or governance, maintaining reliable AI performance becomes significantly more difficult.

    Poor Data Quality Creates Compounding Operational Problems

    AI workflows in enterprise environments commonly interact with multiple operational systems at once, from customer platforms and ERP environments to analytics pipelines and cloud storage layers. Weak governance or inconsistent data across these systems can significantly reduce operational reliability.

    Multiple industry studies, including research from Gartner and IBM, have shown that poor data quality contributes directly to rising operational costs, delayed decisions, increased compliance risk, and additional manual processing across organizations.

    Clean Data Usually Improves ROI Faster Than Model Upgrades

    In many projects, improving data consistency produces larger business gains than replacing the model itself.

    For example, a support automation system connected to fragmented CRM records may initially classify only 45–50% of tickets correctly. After customer records, ticket histories, and operational metadata are standardized through data analytics consulting, routing accuracy may improve significantly without modifying the underlying model itself.

    This is one reason why data analytics consulting services increasingly focus on data readiness assessments before expanding enterprise AI deployments.

    What Data Quality Issues Usually Prevent Companies from Getting ROI from AI?

    AI systems may struggle to generate reliable outputs when business data remains inconsistent across operational environments. Common data challenges include:

    • Data silos between departments
    • Legacy databases with inconsistent schemas
    • Poorly documented datasets
    • Duplicate customer information
    • Delayed analytics updates
    • Weak lineage tracking
    • Incomplete labeling structures
    • Limited monitoring visibility

    Many data analytics companies focus on resolving these issues before expanding AI deployments.

    How Should Businesses Prioritize Data Integration Before Scaling AI Initiatives?

    AI systems usually perform more reliably when core business data is integrated before automation expands across departments.

    1. Start with High-Impact Operational Systems

    AI systems often depend most on a small group of core operational platforms, including CRMs, ERPs, analytics systems, and transactional databases. Integrating these environments first can generate measurable ROI faster than rebuilding the entire data ecosystem at once.

    2. Stabilize Pipelines Before Expanding Automation

    Stable AI deployment usually requires lineage tracking, monitoring, schema validation, access controls, and synchronization reliability before automation layers expand across departments.

    What Metrics Should Be Used to Measure AI ROI in Data-Driven Projects?

    Many organizations initially evaluate AI through model performance alone. However, production AI systems are more commonly measured through business outcomes such as reduced operational overhead, faster execution, improved forecasting, and workflow efficiency gains.

    Operational Metrics Often Matter More Than Model Accuracy

    In production environments, businesses commonly evaluate AI initiatives using metrics such as:

    • Reduction in manual processing time
    • Faster reporting or decision cycles
    • Lower operational costs
    • Forecasting accuracy improvements
    • Workflow automation rates
    • Reduced support escalation volumes
    • Increased data accessibility across teams

    For example, an AI workflow that reduces manual invoice processing time by 40% may generate more measurable ROI than a slightly more accurate model operating inside an unstable workflow.

    Infrastructure Stability Also Affects ROI

    Data analytics services increasingly track operational infrastructure metrics alongside business KPIs, including:

    • Pipeline reliability
    • API uptime
    • Synchronization latency
    • Query performance
    • Data freshness
    • Monitoring coverage

    These metrics help companies evaluate whether AI systems can scale reliably without increasing operational overhead.

    How Do Big Data Consulting Companies Help Reduce Risk in AI Investments?

    As AI systems become more integrated with operational infrastructure, the financial and operational risks associated with poor data governance continue increasing.

    Data consulting services often help organizations reduce risk by:

    • Improving integration reliability
    • Standardizing governance policies
    • Expanding observability across pipelines
    • Monitoring synchronization quality
    • Reducing data inconsistency across systems
    • Establishing rollout and validation frameworks

    This helps businesses scale AI initiatives with greater operational stability and lower long-term maintenance overhead.

    What Is the Best Way to Align Data Modernization with Revenue, Efficiency, and Growth Goals?

    Effective data modernization typically starts with business operations rather than infrastructure selection alone. Many organizations first target workflows where poor visibility, fragmented systems, or delayed reporting create clear operational costs.

    These areas commonly include:

    • Forecasting systems
    • Customer operations
    • Financial analytics
    • Inventory management
    • Executive reporting pipelines

    This phased approach often improves ROI predictability while reducing infrastructure complexity during AI expansion.

    The Operational Side of AI ROI

    Enterprise AI is increasingly becoming an infrastructure challenge rather than only a modeling challenge. Reliable AI execution depends heavily on connected data systems capable of supporting ingestion, governance, transformation, monitoring, and operational synchronization at scale.

    For many organizations, this makes data strategy consulting a core part of long-term AI planning. Stronger data environments often lead to more stable automation, faster decision-making, improved forecasting, and more predictable business outcomes.

  • Top 10 Google Analytics 4 Tools for 2026: Comprehensive Comparison of Leading Platforms

    Top 10 Google Analytics 4 Tools for 2026: Comprehensive Comparison of Leading Platforms

    As businesses continue to rely on Google Analytics 4 (GA4) for event-based tracking and predictive insights, the right companion tools can unlock deeper data analysis, visualization, and optimization. Here’s a detailed comparison of the top 10 GA4 tools for 2026.

    1. Google Analytics 4 (Official)

    The cornerstone platform — GA4 itself offers event-based tracking, predictive insights, audience analysis, and cross-platform performance measurement for businesses of all sizes. It remains the primary hub for digital analytics.

    2. Looker Studio

    Looker Studio (formerly Google Data Studio) creates interactive dashboards that integrate seamlessly with GA4. Customizable visualizations, automated reporting, and collaborative business intelligence capabilities make it a top choice for data storytelling.

    3. Semrush

    Semrush combines website analytics with SEO intelligence, competitor research, keyword tracking, and dedicated GA4 integrations. Its all-in-one marketing dashboard is perfect for comprehensive performance analysis.

    4. Ahrefs

    Ahrefs supports traffic analysis, backlink monitoring, keyword insights, and content performance evaluation. Its integration with Google Analytics reporting workflows enables strategic optimization for organic growth.

    5. Mixpanel

    Mixpanel delivers advanced product analytics, user behavior tracking, funnel analysis, retention insights, and customer engagement measurement. It’s ideal for digital product teams seeking granular user data.

    6. Heap

    Heap automatically captures every user interaction without manual event tagging, simplifying behavioral analytics and product optimization. This reduces setup time and provides richer GA4 data context.

    7. Hotjar

    Hotjar provides heatmaps, session recordings, and user feedback collection that complement GA4’s quantitative data. These behavioral insights help optimize website usability and conversion rates.

    8. Supermetrics

    Supermetrics automates marketing data aggregation from GA4 and dozens of other platforms. It streamlines reporting, dashboard creation, and cross-channel performance analysis, saving hours of manual work.

    9. Databox

    Databox consolidates analytics from GA4 and marketing tools into real-time dashboards. Its KPI monitoring and automated reporting support executive decision-making with actionable insights.

    These tools collectively enhance GA4’s native capabilities, enabling better data visualization, SEO, user behavior analysis, and automated reporting. Choosing the right combination depends on your specific business goals, but each platform offers unique strengths for 2026 analytics strategies.

  • Top 10 Business Intelligence Dashboard Tools for 2026: Power BI, Tableau, and More

    Top 10 Business Intelligence Dashboard Tools for 2026: Power BI, Tableau, and More

    Data is one of the most valuable assets for modern businesses, but its true worth lies in how effectively it is analyzed and presented. Dashboard tools enable companies to transform large datasets into visual insights, driving faster and smarter decisions. Whether tracking sales trends, monitoring operations, or analyzing financial performance, Business Intelligence (BI) platforms have become essential for organizations of all sizes.

    With the growing volume of data generated daily, dashboard applications have evolved from simple reporting tools into powerful decision-making engines. Here are the top 10 BI dashboard tools to consider in 2026.

    1. Microsoft Power BI

    Microsoft Power BI remains a top choice for businesses seeking a balance of cost efficiency, flexibility, and analytics. Its deep integration with Microsoft products like Excel, Azure, and Dynamics 365 makes it especially valuable for organizations already in the Microsoft ecosystem.

    2. Tableau

    Tableau is renowned for its robust data visualization capabilities. Users can create interactive dashboards without coding skills, making it a favorite among analysts and executives who need deep insights from complex data.

    3. Looker

    Looker, a Google Cloud platform, focuses on reliable reporting through a semantic layer that centralizes metric definitions. This eliminates inconsistencies and is ideal for organizations with cloud-based infrastructure.

    4. Qlik Sense

    Qlik Sense uses an associative engine to explore relationships between data points, allowing users to navigate data freely without being limited by predefined queries.

    5. ThoughtSpot

    ThoughtSpot is a pioneer in AI-driven analytics, enabling users to type business questions in plain language and receive instant answers through dashboards and reports.

    6. Sisense

    Sisense specializes in embedded analytics, helping organizations integrate dashboard functionality into their own applications and digital products, sharing insights with customers and employees seamlessly.

    7. Domo

    Domo is designed for real-time insights, pulling data from multiple sources into interactive dashboards that provide up-to-the-minute performance metrics via its cloud platform.

    8. SAP Analytics Cloud

    SAP Analytics Cloud combines BI, planning, and predictive analytics, particularly for companies already using SAP software. Its strong data integration capabilities keep everything aligned.

    9. IBM Cognos Analytics

    IBM Cognos Analytics remains a reliable choice for large-scale, multi-tenant reporting. It offers solid governance, automation, and consistent performance even under heavy workloads.

    10. Zoho Analytics

    Zoho Analytics has gained popularity among cost-conscious businesses for its affordability, AI-powered reporting, and rich integrations. Its user-friendly dashboards make it an excellent starting point for companies new to data analytics.

    Choosing the Right Dashboard Tool

    The best tool depends on company size, budget, and IT architecture. Power BI excels in versatility, Tableau leads in visualization, Looker integrates well with Google Cloud, and ThoughtSpot is ideal for AI-driven insights. Sisense is perfect for embedded analytics, while Zoho Analytics is a sensible choice for small businesses.

    BI dashboards have evolved far beyond simple charts. Today, they help predict future trends and enable quick, informed actions based on real-time data.

  • Best Hadoop Platforms for Big Data in 2026: Vendors, AI Integration, and Cloud Flexibility

    Best Hadoop Platforms for Big Data in 2026: Vendors, AI Integration, and Cloud Flexibility

    As organizations race to harness artificial intelligence, predictive analytics, and real-time insights, managing large volumes of data has become more critical than ever. While cloud-native platforms have transformed the data landscape, Hadoop remains a foundational technology for processing and storing massive datasets. Today’s leading Hadoop vendors offer far more than distributed storage, combining analytics, security, machine learning, and hybrid-cloud capabilities into comprehensive data platforms.

    Leading Hadoop Vendors for 2026

    Cloudera: Enterprise-Grade Hybrid Cloud Platform

    Cloudera remains one of the most reliable brands in the Hadoop market, offering data engineering, analytics, machine learning, and AI services across private, public, and hybrid clouds. Its unified governance architecture helps businesses securely govern data across different environments. Enhanced AI solutions enable building complex models using large datasets, making Cloudera a top choice for enterprises handling complex workloads and compliance needs.

    AWS EMR: Simplified Big Data Processing

    Amazon Web Services Elastic MapReduce (EMR) has gained traction as a popular tool for firms wanting to leverage Hadoop in a managed way. Companies can create and scale workloads in an AWS environment with support for Hadoop, Spark, Hive, HBase, and Presto, handling large volumes of data without difficulty.

    Microsoft Azure HDInsight: Enterprise Analytics Strengthened

    Microsoft Azure HDInsight is a strong option for enterprises already on the Azure platform. It is compatible with Hadoop and Spark clusters, Azure Data Lake, Power BI, and Azure AI. Key advantages include security and governance capabilities, allowing enterprises to set up analytics processes compliant with regulations. Synergy with Microsoft cloud services makes HDInsight attractive for large digital transformation projects.

    Google Cloud: AI-Focused Big Data Platforms

    Google Cloud actively expands its big data services by adding Hadoop capabilities, analytics, and AI. Combined with BigQuery, it enables efficient analysis of large datasets. For custom AI solutions, Google Cloud machine learning services are available. The increasing integration of AI into big data strategies has made Google Cloud popular.

    IBM: Governance and Security at Scale

    IBM provides enterprise data management solutions relying on Hadoop and analytics, well-suited for banking, healthcare, and government sectors due to emphasis on governance, security, and compliance. IBM solutions manage both structured and unstructured data and control information assets. Its hybrid cloud enables infrastructure upgrades without removing legacy solutions. For regulated industries, IBM’s focus on trust and governance is unique.

    Oracle: Connecting Traditional Databases with Big Data

    Oracle positions itself as an intermediate solution between traditional enterprise databases and big data environments. Integration services with Hadoop technology help organizations conduct transactions and analytics simultaneously. Analytic services and data integration enable consistent analysis from different sources, especially for organizations using Oracle applications and databases, streamlining big data work without structural changes.

    Choosing the Right Hadoop Vendor

    The selection of a Hadoop provider depends on the company’s technological context, scalability needs, and data strategies. Hybrid cloud-friendly companies should choose Cloudera. Cloud-based application companies should choose AWS EMR for scalability and ease of use. Companies integrated with Microsoft should go for Azure HDInsight. AI companies should go for Google Cloud. IBM is best for governance situations, while Oracle offers competition due to its database-big data platform integration.

    The Future of Hadoop

    The Hadoop market is now different from 2006. The race no longer lies in storage and processing abilities; vendors are assessed on how well they integrate AI, cloud computing, security, governance, and deployment into their products. Given the large volumes of data businesses generate, those combining scalability with analytics and AI will dominate the big data market.

  • Why Data Engineering Skills Are Indispensable in Today’s Tech Landscape

    Why Data Engineering Skills Are Indispensable in Today’s Tech Landscape

    In the digital economy, data has become one of the most valuable assets for organizations across industries. Every second, companies generate massive amounts of data from customer interactions, online transactions, mobile apps, IoT devices, and business systems. However, raw data is of little value unless it is properly collected, processed, stored, and transformed into meaningful insights. This is where data engineering plays a critical role in modern technology ecosystems.

    Data engineering involves designing and maintaining the infrastructure that enables organizations to process vast quantities of data efficiently. It includes pipeline design, database management, data ingestion from multiple sources, and making data available for analytics and decision-making. As companies increasingly adopt data-driven strategies, the demand for skilled data engineers continues to rise globally.

    Understanding the Role of Data Engineering

    Data engineering is the foundation of modern data systems. It takes unstructured or raw information from diverse sources and converts it into structured formats that data scientists and business teams can easily use and evaluate. Without a strong data engineering foundation, organizations struggle to assess or understand the data they collect over time.

    A data engineer’s primary responsibility is to design and maintain pipelines that transport data from various sources to a centralized location, such as a data warehouse or data lake. Data engineers also clean, transform, and optimize data for performance and usability using programming languages, databases, cloud platforms, and architectural principles.

    As organizations move toward advanced analytics, AI, and machine learning, the role of data engineers becomes even more critical. Data quality is essential for sound decision-making, and data engineers ensure that reliable foundations are provided.

    Why Data Engineering Skills Are in High Demand

    The growing dependence on data-driven decision-making has created a strong demand for specialists who can work with complex data systems. Industries like finance, healthcare, retail, and technology require efficient data pipelines to support analytics and operational processes.

    Data engineering skills are especially relevant in cloud environments, where organizations use scalable infrastructure to store and process large data volumes. Cloud-based data platforms enable efficient big data management, but require skilled professionals for configuration, integration, and optimization.

    The rise of artificial intelligence and machine learning has further increased demand for data engineers. AI models rely heavily on high-quality data, and data engineers ensure that data is accurate, consistent, and available for model training and analysis.

    The Importance of Certification in Data Engineering Careers

    Professional certifications validate data engineering skills and provide structured learning paths. They demonstrate a candidate’s ability to work with complex data systems. Employers often prefer certified professionals as proof of technical competence and practical knowledge.

    Certification programs typically cover data storage, data processing, security, and integration techniques. They also help professionals stay updated with the latest tools and technologies. Many learners use resources like Cert Killer to strengthen their understanding and practice real-world scenarios.

    Certifications improve job prospects, enhance problem-solving skills, and provide a structured approach to learning and applying complex concepts in real-world environments.

    Key Responsibilities of a Data Engineer

    Data engineers perform numerous critical functions. One of the most important is building data pipelines that bring information from multiple systems into a single location. They also manage storage systems like data warehouses and data lakes, ensuring they are designed for performance, scalability, security, and reliability.

    Another crucial role is transforming raw data—which often comes in varied formats—into a standard format clean enough for reporting or analysis. Data engineers develop automated processes to perform these transformations to maintain consistency across systems.

    Finally, data engineers support data scientists and analysts, ensuring that the infrastructure meets the needs of analytics and machine learning teams. This collaboration enables organizations to make data-driven decisions effectively.

    Microsoft Azure Data Engineering Certification

    Microsoft offers specialized certifications for data engineering using Azure technologies. The DP-203 certification focuses on implementing data solutions on Microsoft Azure, covering data storage, processing, security, and integration. It is designed for professionals working with big data and cloud-based platforms.

    Earning this certification demonstrates strong knowledge of Azure data services and the ability to design scalable, efficient data systems. It is widely recognized and can significantly enhance career opportunities in data engineering and analytics.

    Career Opportunities in Data Engineering

    Data engineering offers diverse career opportunities across industries. Common roles include data engineer, cloud data engineer, data architect, ETL developer, and big data engineer. These roles involve building pipelines, managing databases, optimizing systems, and supporting analytics platforms.

    Data engineers often work on large-scale projects involving complex data integration and processing. The field is both challenging and rewarding, and demand is expected to remain strong as data becomes central to business operations.

    The Role of Continuous Learning in Data Engineering

    The field evolves rapidly with advances in technology, cloud computing, and processing tools. Continuous learning is essential for professionals to remain competitive. New tools and frameworks regularly improve efficiency and scalability, and engineers must stay updated.

    Learning can take many forms: certifications, online courses, hands-on projects, and participation in technical communities. Employers highly value individuals who commit to ongoing learning, as it ensures teams stay capable of handling new challenges.

    Frequently Asked Questions

    What is data engineering?
    Data engineering is the process of designing, building, and managing systems that collect, store, and process large volumes of data for analysis and decision-making.

    Why is data engineering important?
    It ensures organizations have access to clean, structured, and reliable data for analytics and business intelligence.

    What does the DP-203 certification cover?
    It focuses on implementing data solutions using Microsoft Azure, including data storage, processing, and integration.

    Are data engineering skills in demand?
    Yes, due to growing reliance on data-driven decision-making and big data technologies.

    What skills are required for data engineers?
    Skills in programming, databases, cloud platforms, data modeling, and data pipeline development.

    Conclusion

    Data engineering has become a critical discipline, enabling organizations to turn raw data into valuable insights. As businesses embrace data-driven strategies, demand for skilled data engineers will grow. By developing technical skills, gaining experience, and pursuing certifications, professionals can build rewarding careers. Continuous learning and adaptability are essential in this rapidly evolving field.

  • 10 Leading Data Platforms Driving AI-Powered Enterprise Transformation

    10 Leading Data Platforms Driving AI-Powered Enterprise Transformation

    Data is the bedrock of the AI-driven enterprise, converting raw information into actionable intelligence and competitive advantage. As organizations accelerate their AI initiatives, the ability to connect, govern, and activate data at scale has never been more critical. Leading data platforms are enabling this shift, providing the infrastructure for advanced analytics, generative AI, and real-time decision-making. Here, we highlight the top platforms that help enterprises unlock greater value from their data and transform insights into measurable business impact.

    1. Databricks – Top spot goes to Databricks for unifying data engineering, data science, and warehousing through its pioneering Lakehouse architecture. With full integration of Mosaic AI, enterprises can train and deploy proprietary models using their internal data. The Unity Catalog ensures robust governance, while open standards like Apache Iceberg and Delta Lake prevent vendor lock-in.
    2. Snowflake – Snowflake has evolved from a cloud data warehouse into a comprehensive data cloud. Its Snowflake Cortex service allows enterprises to build and deploy generative AI applications within their secure data perimeter, maintaining data sovereignty. The Data Marketplace facilitates seamless, secure data sharing across supply chains.
    3. Microsoft Fabric – Fabric unifies Data Factory, Synapse, and Power BI into a single analytics platform. The OneLake concept eliminates data silos, and deep integration with Microsoft 365 Copilot enables natural language queries, making it a favorite among Global 2000 companies.
    4. Google Cloud – Google’s BigQuery offers serverless, planet-scale analytics. BigQuery ML and native integration with Vertex AI let data scientists run machine learning models directly on data without movement, handling petabytes with zero infrastructure management.
    5. AWS – Amazon Redshift provides real-time insights by removing the friction of moving data between databases and warehouses. Integration with S3 and Bedrock AI creates a seamless pipeline for training foundation models, with serverless scaling for unpredictable workloads.
    6. IBM watsonx – IBM’s watsonx.data is an open-source lakehouse designed to scale AI workloads while reducing storage costs. Using open formats like Apache Iceberg and Presto, it supports hybrid environments and is backed by IBM’s global consulting arm.
    7. Informatica – Informatica manages over 110 trillion transactions monthly through its Intelligent Data Management Cloud (IDMC). It ensures data is AI-ready, clean, and compliant by automating data quality, metadata management, and master data synchronization.
    8. Cloudera – Cloudera excels in hybrid data management with its CDP platform, offering consistent security and governance across on-premises, private cloud, and public cloud. The Shared Data Experience (SDX) layer ensures compliance and discoverability.
    9. Teradata – Teradata handles massive data workloads, especially in telco and finance. VantageCloud Lake modernizes high-performance analytics into a cloud-native architecture, enabling complex multi-statement queries at scale across hybrid and multi-cloud environments.
    10. MongoDB – MongoDB has grown from a NoSQL database to a comprehensive developer data platform. MongoDB Atlas offers integrated vector search and stream processing, allowing teams to build AI-enriched applications with a unified document-based model that scales across public clouds.
  • Big Data Insights: Top Tools, Analytics Trends, and Industry Impact for 2025-2026

    What Is Big Data Analytics?

    Big Data analytics involves examining large, diverse data sets to uncover hidden patterns, correlations, and insights. In 2025-2026, open-source tools, predictive analytics, and industry-specific applications are driving transformation across healthcare, automotive, finance, and more.

    Top Trends and Tools

    • Best Open-Source Big Data Tools in 2026 – A roundup of leading open-source platforms for data processing and analysis.
    • Predictive Market Analysis – How Big Data is reshaping market forecasting and investment strategies.
    • Telehealth and Remote Diagnostics – Big Data’s role in improving patient monitoring and diagnostic accuracy.
    • Business Intelligence Platforms – Gartner’s essential features for BI tools in 2025.
    • Scala for Big Data – Top free courses to master Scala for data engineering.
    • Data Lakes for Analytics – The top 10 data lakes enabling large-scale analytics.

    Industry Applications

    Big Data is revolutionizing the automotive industry, healthcare (predictive analytics and precision medicine), and even the beverage sector (drinksworld uses data to drive growth). Without Big Data, modern decision-making would collapse—highlighting its critical role.

    Stay tuned for more insights from Analytics Insight, the leading tech and crypto publication.