Tag: Bitcoin

  • Bitcoin Holds Above $61K as Ether and Solana Lead Market Recovery: June Jobs Data Eases Fed Rate Hike Fears

    Bitcoin Holds Above $61K as Ether and Solana Lead Market Recovery: June Jobs Data Eases Fed Rate Hike Fears

    Market Overview: Bitcoin Rebounds Above $61,000

    Bitcoin is trading near $61,390, up 1.28% over the past 24 hours, as a weaker-than-expected June jobs report cools expectations of a near-term Federal Reserve rate hike. The recovery has lifted the broader crypto market, with Ethereum and Solana posting stronger gains. However, analysts warn that the rally may be a relief bounce rather than a confirmed reversal, citing persistent ETF outflows, thin liquidity, and regulatory uncertainty.

    Bitcoin Price Today: Key Levels and Analyst Insights

    Bitcoin stands at $61,547.78 (CoinMarketCap), having recovered roughly $3,400 from last week’s 21-month low near $58,115. It remains well below its 52-week high above $126,000.

    Akshat Siddhant, Lead Quant Analyst at Mudrex, notes: “Bitcoin is holding strong above $61,500 after weaker US jobs data reduced rate hike expectations. However, on-chain data shows exchange inflows have climbed above 50,000 BTC per day, historically followed by increased volatility. If Bitcoin loses $60,000 support, it could retest the realized price near $53,000. On the upside, a break above $62,600 could pave the way toward $65,000.”

    The CoinSwitch Markets Desk adds: “BTC’s rebound toward $62K was driven primarily by a short squeeze. Institutional demand remains weak due to persistent ETF outflows, while higher bond yields compete with risk assets. Entering Q3, the market is healthier from a leverage perspective but more susceptible to sharp price swings.”

    Top Crypto Prices Today: Biggest Gainers

    Ethereum leads the top ten with a 4.51% gain, supported by fresh ETF inflows. Hyperliquid follows at 4.29%, extending strong momentum in derivatives trading. Solana adds 2.85%, holding gains from its recent rally toward $80. No asset in the top ten posted losses today.

    News Driving Market Sentiment

    Weak June Jobs Report Cools Rate Hike Fears

    US payrolls grew by only 57,000 in June, missing expectations by a wide margin. The soft print reduced bets on further Fed tightening, lifting risk assets including Bitcoin and Ether. Traders now see a more accommodative Fed stance, with the next policy signal expected at the July 29 FOMC meeting.

    CLARITY Act Delayed

    The White House targeted a July 4 signing, but a Senate recess pushed the vote further out. Prediction markets trimmed 2026 passage odds. XRP traders watch closely, as the bill would set clearer digital asset rules.

    Citi Cuts Bitcoin and Ether Price Targets

    Citi lowered its 12-month Bitcoin forecast from $112,000 to $82,000 and Ether from $3,175 to $2,240, citing weak ETF flows and softer investor appetite. The bear case places Bitcoin near $53,000 if outflows persist.

    JPMorgan Flags Risk in Strategy’s Bitcoin Sales Policy

    JPMorgan said Strategy’s approach to selling Bitcoin adds unnecessary market uncertainty. The bank recommended equity issuance instead, adding scrutiny to corporate treasury strategies tied to Bitcoin.

    Investor and Market Outlook

    Bitcoin’s hold above $61,000 marks a steadier session, but most desks call it a relief bounce. The $60,000–$61,000 zone is key support. A break below could reopen the path toward $58,000, then realized price near $53,000. On the upside, $62,600 and $65,000 are targets for bulls. Ether’s strength above $1,650 and Hyperliquid’s climb suggest capital rotation into higher-beta names. Investors should track daily ETF flows, the CLARITY Act’s delayed Senate vote, and Fed commentary ahead of the July 29 FOMC meeting.

    Frequently Asked Questions

    What is the Bitcoin price today?

    Bitcoin is trading near $61,390.46, up 1.28% over 24 hours. Support near $60,000, resistance at $62,600 and $65,000.

    Why did Bitcoin recover this week?

    A weaker-than-expected June jobs report cooled Fed rate hike expectations, lifting Bitcoin and broader risk assets.

    What is the biggest crypto news today?

    The CLARITY Act’s delayed July 4 deadline, Citi’s price target cuts, and JPMorgan’s note on Strategy’s Bitcoin sales policy.

    Which coins are gaining the most today?

    Ethereum (+4.51%), Hyperliquid (+4.29%), and Solana (+2.85%) lead gains. No top-ten coin posted losses.

    What should crypto investors watch this week?

    Daily ETF flow data, CLARITY Act Senate vote, Fed commentary, and the $60,000 Bitcoin support level.

    Disclaimer: This article is for informational purposes only and does not constitute investment advice. Cryptocurrencies are risky assets; always conduct your own research before investing.

  • Bitcoin ETF Outflows Hit $294M: What the 10-Day Withdrawal Streak Means for Crypto Markets

    Bitcoin ETF Outflows Hit $294M: What the 10-Day Withdrawal Streak Means for Crypto Markets

    US spot Bitcoin exchange-traded funds recorded heavy net outflows on July 1, according to data from SoSoValue. Total net outflows reached $294.62 million, extending the withdrawal streak to 10 consecutive trading sessions.

    BlackRock’s IBIT posted the largest net outflow at $219.41 million. Fidelity’s FBTC recorded net outflows of $51.02 million, Ark Invest and 21Shares’ ARKB lost $39.9 million, and Grayscale’s GBTC saw $62.79 million leave the fund. By contrast, Morgan Stanley’s MSBT drew $29.81 million in net inflows, while Grayscale Mini Bitcoin added $36.33 million.

    The 10-day streak of outflows has surpassed the $1.2 billion mark. This is significant, as spot Bitcoin ETFs are considered the institutional demand channel. The heavy redemption shows that institutional investors are willing to cut back during periods of continued downtrend.

    Why ETF Outflows Matter

    The ongoing withdrawals indicate a conservative institutional sentiment. Pressure has been increasing since Bitcoin’s previous surge, with uncertainty around spot Ethereum ETFs, anticipated Mt. Gox distributions, and a risk-off macro environment.

    Macro conditions are also not favorable. The dollar is up, and risk assets like cryptocurrency are falling amid expectations that US rates may remain elevated. June was Bitcoin’s worst month in four years, down 20%. US spot Bitcoin ETFs bled a record $4.5 billion for the month, with BlackRock’s IBIT alone accounting for $3.55 billion.

    Macro headwinds include the Warsh Fed nudging the rate path toward holds, even hikes, while the dollar sits near yearly highs and gold keeps sliding.

    At press time, Bitcoin trades at $61,630 with an increase of 1.94% in the last 24 hours.

    Crypto Fear and Greed Index

    According to CoinGlass, the Crypto Fear and Greed Index stands at 22 in the fear territory. The index has improved from 10 on July 1, when BTC was trading at $58,410.60. Bitcoin Dominance stands at 57.9% with a decline of 0.14%.

    Technical Structure

    BTC rebounded from a 21-month low of $57,800 earlier this week. However, BTC maintains a bearish bias, as it remains below the 50-day, 100-day, and 200-day Exponential Moving Averages (EMAs) at $66,010, $69,816, and $75,777, respectively.

    The Relative Strength Index (RSI) at 44.87 stays below the midline, suggesting subdued buying pressure, while the Moving Average Convergence Divergence (MACD) shows a positive reading with the MACD line above its signal and above zero, indicating slightly improving momentum.

    On the upside, immediate resistance is placed at $64,004, ahead of the 50-day EMA at $66,010. Further up, the 100-day EMA at $69,816 and the 200-day EMA at $75,777 align as successive resistance levels.

    On the downside, a failure to reclaim the $64,000 level would leave BTC vulnerable to renewed selling pressure targeting the key psychological level at $55,000.

    Key Takeaways

    • Record ETF liquidations reveal institutional capital executing a massive risk-off retreat. With macro headwinds keeping interest rates high, this unprecedented selling pressure strips away Bitcoin’s institutional safety net, leaving the current market rebound highly vulnerable to further downside.
    • Some investors are rotating between ETF products rather than exiting the category completely, as seen by inflows into Morgan Stanley’s MSBT and Grayscale Mini Bitcoin.

    Disclaimer: This article is provided for informational purposes only and does not constitute investment advice. Cryptocurrencies are risky assets that may result in total loss. Always conduct your own research (DYOR) before making any investment decisions.

  • Bitcoin Wavers Near $60K as ETF Outflows and Economic Uncertainty Deepen Bearish Sentiment

    Bitcoin Wavers Near $60K as ETF Outflows and Economic Uncertainty Deepen Bearish Sentiment

    Bitcoin is trading in a precarious range around $58,800 to $60,000 as of early July 2026, following a steep decline of over 30% from its all-time highs above $120,000 in late 2025. The cryptocurrency has been under heavy selling pressure, driven by weakening institutional demand, unfavorable macroeconomic conditions, and growing regulatory concerns. This article examines the key factors behind Bitcoin’s current price struggles and what technical indicators suggest about the next major move.

    BTC Price and Recent Market Performance

    Bitcoin currently hovers near the critical $58,800–$60,000 zone, a dramatic decline from its January levels above $93,000. In six months, the market has lost more than 30% of its value, with the correction accelerating after the peak near $126,000 in late 2025. The rapid descent has surprised many investors who began the year with strong optimism.

    ETF Outflows Create Major Selling Pressure

    Institutional demand, once a primary driver of Bitcoin’s rally, has reversed sharply. Exchange-traded fund (ETF) outflows surpassed $5 billion in the first half of 2026, signaling that large investors are pulling capital from the market. This trend has forced major financial institutions to revise their outlooks. Citigroup, for example, cut its Bitcoin price target from $112,000 to $82,000, citing much weaker institutional demand than previously anticipated.

    Technical Charts Show Bearish Market Conditions

    Bitcoin now trades below key moving averages, indicating that sellers currently control the market. The $58,700 support level is critical; if broken, analysts expect the price to fall toward $49,000–$53,000. On the upside, immediate resistance sits at $61,000–$62,000. A move above this range could generate short-term positive momentum.

    Investors Fear Market Indicators

    The Relative Strength Index (RSI) has dropped near 32, reflecting weak momentum. Broader market sentiment has entered “Extreme Fear” territory, a state that historically can precede a recovery but may also lead to further declines if selling pressure persists.

    Economic Conditions Continue to Hurt Bitcoin

    High interest rates, a strong bond market, and attractive returns from sectors like artificial intelligence and semiconductors have drawn capital away from cryptocurrencies. The Federal Reserve has not delivered the expected rate cuts, making traditional investments more appealing.

    Regulation Concerns Add More Uncertainty

    Slow progress on U.S. cryptocurrency laws and ongoing regulatory challenges for exchanges like Binance have made institutional investors cautious. Many are waiting for clearer legal frameworks before committing significant resources to Bitcoin.

    Future Outlook Is Uncertain

    Analysts are divided. Optimists point to Bitcoin’s limited supply and growing adoption, forecasting a possible return to $100,000–$170,000 by year-end if ETF demand recovers and central banks ease policies. Pessimists warn that continued weakness could drive Bitcoin down to $53,000 or lower if recession fears intensify.

    Final Market View

    Bitcoin is at a pivotal juncture. The $58,000 support and $61,000 resistance levels will determine near-term direction. While long-term fundamentals remain solid, elevated volatility is expected in the short term. July 2026 could be a defining month for Bitcoin’s next major price move.

  • Bitcoin ETFs See $294M Outflow, Metaplanet Revenue Hits ¥11.4B, Avalanche Stock Plunges 73%

    Bitcoin ETFs See $294M Outflow, Metaplanet Revenue Hits ¥11.4B, Avalanche Stock Plunges 73%

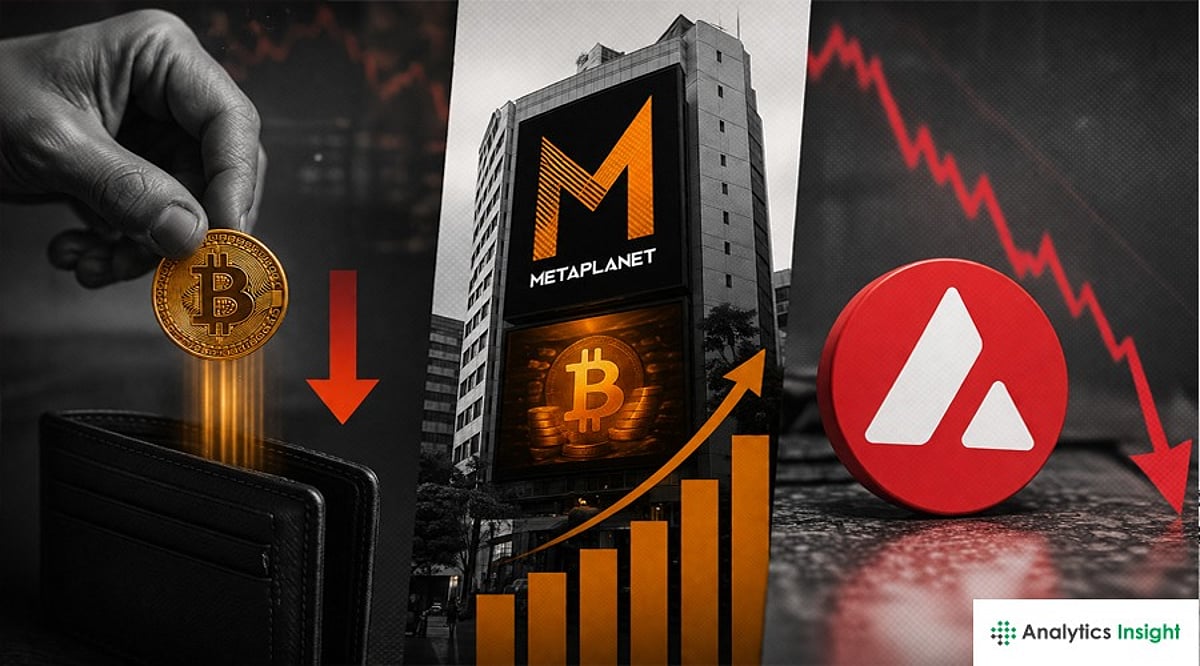
    The crypto market witnessed major developments as Bitcoin spot ETFs reported $294.62 million in net outflows, while XRP whales accumulated during the price dip. Meanwhile, Metaplanet disclosed its BTC revenue and Avalanche Treasury stock fell.

    Bitcoin Saw $294 Million in Outflows

    According to SoSoValue, the Bitcoin spot ETF saw a total net outflow of $294.62 million yesterday. The Bitcoin Spot ETF with the highest net inflow yesterday was the Grayscale Bitcoin Mini Trust ETF $BTC, with a daily net inflow of $36.33 million. The second highest was Morgan Stanley’s ETF MSBT, with a daily net inflow of $29.81 million, and the total historical net inflow of MSBT currently stands at $364.01 million. The Bitcoin Spot ETF with the highest net outflow yesterday was BlackRock’s ETF IBIT, with a daily net outflow of $219.39 million, and the total historical net inflow of IBIT currently stands at $60.03 billion. The total net asset value of Bitcoin Spot ETFs is $72.46 billion, with an ETF net asset ratio of 6.01%. The historical cumulative net inflow has reached $50.86 billion.

    XRP Whales are Accumulating

    According to market analyst Xaif Crypto, XRP’s drop to $1.04 appears to have triggered fear among smaller traders, but large investors saw it as a buying opportunity. XRP has since recovered to $1.06. A key indicator is the All CEX whale spread, which has climbed to 50.9%, signaling that whales now control a significantly larger share of XRP held on centralized exchanges. Coinbase whale outflows have surged. Transfers of more than 1 million XRP jumped from 10% to 25.7% of total exchange activity in just two weeks. Large withdrawals are widely viewed as a bullish signal, suggesting investors are moving tokens into private wallets for long-term holding instead of preparing to sell.

    Metaplanet Reports Bitcoin Income Business Revenue

    Japanese listed company Metaplanet released results for its Bitcoin income business revenue in the second quarter of fiscal 2026. According to Foresight News, the business recorded operating revenue of 1.75 billion yen in the second quarter. Metaplanet said cumulative revenue for the first half of the fiscal year reached 4.72 billion yen. The company added that over the past 12 months, cumulative revenue from its Bitcoin income business totaled 11.4 billion yen.

    Ethereum Posts Historic Third Straight Losing Quarter

    The second-largest cryptocurrency has fallen victim to the prolonged bear market as the second quarter closed. This makes it the asset’s third consecutive quarterly loss. Since reaching its all-time high of nearly $5,000 in August 2025, the price of the cryptocurrency has maintained a steady downward trajectory. Data from CoinGecko reveals that the asset is now trading around $1,560, representing a 70% contraction from its peak price. Historically, the month of July does not usually favor the platform’s performance, having closed lower in six of the last ten years.

    Avalanche Treasury Stock Collapses

    Avalanche Treasury Co. shares have fallen sharply since their Nasdaq debut as lower AVAX prices have weighed on the company’s digital asset holdings. The AVAX-focused digital asset treasury firm began trading under the ticker AVAT on June 11. The stock recently traded near $0.50, down about 73% from its $1.85 close on debut. AVAX recently traded near $6.69, up 0.94% over 24 hours but down 23% over the past month. Avalanche Treasury reported a net loss of $26.78 million for the quarter ended March 31, according to its latest SEC filing. The company also reported $1.22 million in cash and a net working capital deficit of $9.06 million at quarter-end.

    FAQs

    1. How much outflow did Bitcoin spot ETFs record?
    According to SoSoValue, Bitcoin spot ETFs recorded total net outflows of $294.62 million yesterday. BlackRock’s IBIT saw the largest withdrawal at $219.39 million.

    2. Which Bitcoin ETF saw the highest inflow?
    The Grayscale Bitcoin Mini Trust ETF recorded the highest daily inflow at $36.33 million. Morgan Stanley’s MSBT followed with $29.81 million in daily inflows, taking its historical inflow to $364.01 million.

    3. Why are XRP whales accumulating?
    According to market analyst Xaif Crypto, XRP’s fall to $1.04 created fear among smaller traders but attracted larger investors. Coinbase whale transfers above 1 million XRP rose from 10% to 25.7% of exchange activity in two weeks.

    4. How much revenue did Metaplanet report from its Bitcoin income business?
    According to Foresight News, Metaplanet’s Bitcoin income business generated ¥1.75 billion in operating revenue during Q2 FY2026. The company said revenue reached ¥4.72 billion in the first half and ¥11.4 billion over the past 12 months.

    5. Why did Avalanche Treasury stock fall sharply?
    Avalanche Treasury stock has dropped around 73% from its Nasdaq debut close as weaker AVAX prices pressured its digital asset holdings. The company also reported a quarterly net loss of $26.78 million and a working capital deficit of $9.06 million.

  • How Zero-Fee Trading Models Are Reshaping Bitcoin and Ethereum Profitability

    How Zero-Fee Trading Models Are Reshaping Bitcoin and Ethereum Profitability

    The structure of crypto trading is shifting toward lower explicit costs, tighter exchange competition, and more aggressive liquidity capture. Zero-fee models sit at the center of this transition, influencing not only how trades are priced but also how participants adapt to changing cost signals and execution conditions.

    Rather than acting as a simple pricing incentive, zero-fee regimes reshape the hierarchy of constraints that guide trading decisions. Cost is no longer a visible filter at the point of entry. Instead, it is embedded in execution mechanics, liquidity response, and order book interaction quality.

    Liquidity remains heavily concentrated in major digital assets rather than dispersed across the broader market. Bitcoin and Ethereum continue to function as the primary execution layer for global crypto exposure, meaning most meaningful cost dynamics and efficiency gains are expressed through these two instruments.

    Bitcoin trades in the high $59,000 range, while Ethereum holds near the mid $1,500 range. Both assets operate in a phase where directional conviction is inconsistent across time horizons. In this setting, returns depend less on directional accuracy and more on execution efficiency across entry, adjustment, and exit.

    Zero fees are therefore relevant not as a headline incentive, but as a structural change in how net returns are formed from gross market movement.

    What Zero Fees Actually Change

    Zero trading fees remove the explicit commission layer embedded in spot and derivatives execution, including maker and taker fees. On the surface, this compresses observable trading costs and appears to improve profitability uniformly.

    However, trading costs are not eliminated. They are redistributed into execution layers that behave dynamically rather than remaining fixed per trade. The cost structure shifts toward spread capture, slippage variability, and timing sensitivity. This creates a variable-cost regime where outcomes depend on liquidity depth, volatility, and order aggressiveness rather than predictable deductions.

    In highly liquid assets such as BTC and ETH, spreads remain tight and order books absorb moderate flow efficiently. Here, removing fees translates more directly into net performance gains because fewer structural inefficiencies offset the benefit. In thinner markets, execution friction dominates. Wider spreads and inconsistent liquidity reduce the marginal benefit, as market impact replaces commissions as the primary cost driver.

    The key shift is not cost removal itself, but the integration of execution quality into decision-making alongside price direction.

    Market Backdrop and Execution Sensitivity

    Crypto market structure continues to reflect selective liquidity concentration, where participation clusters around a limited set of large-cap assets rather than dispersing evenly across the ecosystem. Within this structure, BTC and ETH function as both tradable assets and liquidity infrastructure, acting as pricing references and absorption layers for broader market flow. This dual role increases sensitivity to cost structure changes, as execution efficiency improvements propagate through concentrated capital channels.

    When momentum weakens, price behavior becomes more fragmented. Movement shifts toward shorter cycles driven by liquidity gaps, positioning adjustments, and reactive order flow. Activity increases not because conviction strengthens, but because portfolios are adjusted more frequently. This creates a structural effect where execution frequency rises even without changes in exposure. Zero fees therefore matter through cumulative interaction rather than isolated trades.

    Why Zero Fees Do Not Automatically Improve Performance

    Zero fees do not improve trading edge. They improve the efficiency of edge realization. Research in market microstructure, including Barber and Odean’s Trading Is Hazardous to Your Wealth, shows that higher trading frequency is associated with lower net returns among retail participants. The driver is not only cost accumulation but also declining decision quality under increased activity.

    When friction exists, it filters marginal trades. When removed, that filter weakens, increasing the probability of lower-conviction execution. In crypto markets, this effect is amplified by continuous access and instant execution. Reduced friction increases both financial and behavioral trading frequency. Importantly, this does not necessarily reduce individual trade quality. It increases variation in decision quality over time, which reduces consistency in aggregate performance.

    How Zero Fees Affect Profit Mechanics

    The impact is best understood through trade-level economics. Consider a BTC position entered at $60,000 and exited after a 1% move. Gross profit is $600 per BTC. Under a typical 0.20% round-trip fee structure, about $120 is deducted, reducing net profit to $480 before slippage and spread effects. With zero fees, this deduction disappears. Market outcome remains unchanged, but gross-to-net conversion improves structurally.

    Zero fees do not change expectancy, volatility distribution, or directional probability. They improve retention of returns generated by existing strategy design. ETH and other liquid assets follow the same logic, though realized impact depends on liquidity stability and execution timing.

    Liquidity Concentration and Structural Advantages

    Liquidity remains concentrated in a small group of large-cap assets rather than evenly distributed across the ecosystem. This reflects where capital can enter and exit with minimal friction. Bitcoin and Ethereum sit at the center of this structure, functioning as both investment assets and liquidity hubs for retail, institutional, and algorithmic flow. This produces deeper order books and more stable execution compared to smaller assets.

    Two advantages follow: spreads remain tighter, reducing deviation between theoretical and executable pricing, and order books absorb volatility more efficiently, limiting extreme dislocations during rapid moves. Under zero-fee conditions, these factors determine how much of the cost reduction translates into real performance. In BTC and ETH, fee removal compounds efficiency because execution impact is already controlled. In thinner markets, slippage dominates and reduces the benefit.

    Portfolio Behavior and Rebalancing Dynamics

    Zero fees reshape portfolio construction by changing the cost of capital rotation. Active traders frequently adjust exposure between BTC, ETH, stablecoins, and selected altcoins based on volatility shifts, macro signals, or relative strength. Each adjustment normally carries a cost that influences rebalancing frequency. When fees are removed, this constraint disappears. Adjustments become easier and faster to reverse, increasing responsiveness to market shifts.

    Rebalancing becomes more continuous rather than episodic. Instead of waiting for large thresholds, traders can adjust exposure in smaller increments. This allows positioning across BTC and ETH, or majors and altcoins, to be recalibrated more fluidly as leadership rotates. Decisions become more real-time rather than delayed. The trade-off is clear: responsiveness improves, but discipline becomes more important in filtering signal from noise.

    Execution Quality Becomes the Primary Constraint

    Once explicit fees are removed, execution quality becomes the dominant performance variable. Execution quality includes entry precision, slippage behavior, order type efficiency, and liquidity depth at execution time. These replace fees as the main source of cost variation. Skill shifts from cost management to execution precision under changing liquidity conditions. Lower friction also increases trading velocity, raising the importance of pre-planned decision-making before entry.

    Leverage amplifies this dynamic. Fee savings do not affect liquidation thresholds or volatility exposure. When combined with higher frequency, portfolio risk can expand independently of execution gains.

    The Hidden Risks

    The most immediate risk is overtrading. When costs disappear, marginal setups become easier to justify, which can increase trading activity without any real improvement in strategy quality or edge. A second risk is underestimating spreads. Even in zero-fee models, bid-ask spreads and market impact can, in some cases, exceed traditional trading fees, particularly in less liquid conditions or during volatility spikes when order books thin out.

    A third risk is implicit leverage expansion. Lower friction can encourage larger position sizes or more frequent trades, while actual risk exposure per trade remains unchanged. Over time, this can quietly increase overall portfolio risk without being clearly recognized. A fourth risk is performance misinterpretation. Cleaner net P&L figures may mask inefficiencies in execution quality, timing, or order selection, leading traders to overestimate their true skill level. Over time, these factors can contribute to strategy drift, where increased activity is mistaken for improved performance or a stronger edge.

    How to Use Zero Fees on Toobit

    A practical approach starts with liquid pairs. BTC and ETH provide the clearest environment for translating fee savings into measurable gains due to deeper liquidity and tighter spreads. Monitor Toobit VIP rates and execution conditions, then evaluate whether expected movement justifies total cost, including spread and slippage. Order type selection becomes more important. Limit orders improve price control, while market orders provide speed when necessary. Lower friction increases execution frequency, so planning before entry becomes essential. Selective participation remains critical. Even without fees, not every move is worth trading. Liquidity, volatility, and structure still determine opportunity quality.

    Final Thoughts

    Zero trading fees improve crypto trading economics by removing explicit cost layers, but their real impact depends on execution behavior. The strongest benefits appear in BTC and ETH due to liquidity depth and stable execution. However, these same conditions require greater discipline because trading becomes easier and more frequent. The main limitation is behavioral, not structural. Reduced friction weakens natural constraints on unnecessary activity, increasing the importance of selectivity and execution control. Ultimately, performance depends less on cost reduction and more on disciplined capital deployment. Liquidity, timing, spread quality, and position sizing remain the core drivers of outcomes. Zero fees improve efficiency but do not replace judgment or structure.


  • Bitcoin Bounces Above $60K as Long-Term Holders Resume Accumulation

    Bitcoin Bounces Above $60K as Long-Term Holders Resume Accumulation

    Bitcoin recovered to around $60,350 on July 2, gaining 2.37% in 24 hours as the US dollar and crude oil prices dropped to four-month lows. The rebound followed a dip to a 21-month low earlier in the week, with improved risk sentiment helping the cryptocurrency reclaim the key $60,000 level.

    Weaker Dollar Supports Bitcoin’s Recovery

    CoinSwitch noted that the dollar’s retreat created a favorable environment for Bitcoin, as long-term investors increased their holdings during the recent market decline. The firm reported that long-term holders added 270,000 BTC within two weeks, absorbing some of the selling pressure from spot Bitcoin exchange-traded fund (ETF) outflows.

    Funding rates remained positive for three consecutive days, indicating that derivatives traders continued to favor long positions despite June’s steep decline. CoinSwitch advised traders to wait for a confirmed close above $61,000 before treating the rebound as a reliable shift in Bitcoin’s short-term direction.

    ETF Outflows Meet Renewed Accumulation

    Spot Bitcoin ETFs recorded $4.5 billion in net outflows during June, adding selling pressure as Bitcoin lost about 20% across the month. However, Glassnode data showed that the long-term holder net position change returned to positive territory after an extended period of distribution.

    The indicator tracks the 30-day supply change among wallets holding Bitcoin for at least 155 days, which Glassnode classifies as long-term holders. Current net accumulation ranges between approximately 50,000 and 100,000 BTC, according to Glassnode’s chart. Previous bullish buying waves approached 400,000 BTC.

    Glassnode said transitions from distribution to accumulation have often appeared during weak markets, as committed investors increase exposure while shorter-term participants reduce risk.

    Buying Spreads Across Bitcoin Wallet Groups

    Glassnode’s Accumulation Trend Score increased over the past month, suggesting that buying expanded across several wallet groups rather than remaining concentrated within one category.

    • Wallets holding less than one BTC recorded the strongest score, near 0.8 to 0.9.
    • Holders of between 100 and 1,000 BTC showed similar accumulation.
    • Wallets holding between one and 100 BTC posted moderate readings of about 0.6 to 0.7.
    • Wallets containing 1,000 to 10,000 BTC also became net buyers.

    By contrast, wallets holding more than 10,000 BTC remained near neutral, with readings around 0.4 to 0.5 and limited evidence of aggressive accumulation. Glassnode said widespread buying can support longer-term market recoveries, but cautioned that Bitcoin has not entered a complete accumulation phase.

    Meanwhile, investors continued monitoring the upcoming US nonfarm payrolls report, which could influence expectations surrounding the Federal Reserve’s interest-rate outlook. Mudrex Lead Quant Analyst Akshat Siddhant identified $61,000 as the next important upside level, while $58,300 remained Bitcoin’s main support area.

    What’s Next?

    Bitcoin’s rebound above $60,000 gained support from a weaker US dollar and renewed accumulation by long-term holders, although ETF outflows and cautious whale activity still limit confidence. Traders should watch for a confirmed break above $61,000 and the $58,300 support level before judging whether the recovery can continue.

  • Bitcoin Rebounds to $60,700, Solana Surges Past $78 as Fed Chair Warsh Eases Inflation Concerns

    Bitcoin Rebounds to $60,700, Solana Surges Past $78 as Fed Chair Warsh Eases Inflation Concerns

    Bitcoin is stabilizing above the crucial $60,000 level as long-term holders absorb heavy ETF outflows, while the upcoming US jobs report and shifting dollar strength are expected to shape the crypto market’s next major move.

    Bitcoin Price Today: $60,677

    Bitcoin is trading near $60,677, up 2.63% over the past 24 hours and holding above the $60,000 mark. The token slid to a 21-month low of $57,950 earlier this week but has since clawed back above $60,000, a level that dominated traders’ conversation through most of June.

    Market sentiment improved after Fed Chair Kevin Warsh told an ECB forum panel that inflation risks appear to be easing, even as he avoided firm guidance on rate policy. A weaker US dollar and crude oil sliding to a four-month low have also removed some pressure from risk assets. Robinhood’s launch of its own public blockchain added further momentum, pulling fresh attention toward crypto infrastructure plays just as the broader market searched for a positive catalyst.

    Market Analysis and Expert Insights

    Akshat Siddhant, Lead Quant Analyst at Mudrex, noted: “Bitcoin is stabilising near the $60,000 psychological level after rebounding from a 21-month low of $57,950. A weaker U.S. dollar and crude oil prices falling to a four-month low have improved risk sentiment, helping BTC recover.” He added, “Although spot Bitcoin ETFs ended June with $4.5 billion in net outflows, long-term holders have absorbed some of the selling pressure, accumulating 270,000 BTC over the past two weeks.”

    The CoinSwitch Markets Desk commented: “BTC reclaimed the key $60K level after dipping to $58K. On the macro side, the US dollar pulled back from its highs, a tailwind for BTC. The long-dollar trade is crowded at +$34.3B, an 18-month high, hinting a dollar reversal may be near. Long-term holders added roughly 270K BTC in two weeks, showing big players are buying the dip.”

    Crypto Prices Today: Top 10 Coins at a Glance

    Based on CoinMarketCap data as of July 2:

    • Biggest Gainers: Solana leads with a 3.85% gain, followed by Hyperliquid at 2.98% and Bitcoin at 2.63%.
    • Biggest Laggards: TRON is the weakest mover among the top ten, up just 0.29%. USDC and Tether stayed near their dollar pegs.

    Crypto News Today Driving Market Sentiments

    Fed Chair Warsh Signals Cooling Inflation Risk

    Kevin Warsh told an ECB forum panel that inflation pressures appear to be easing. He declined to offer forward guidance on rates but described the upcoming July Fed meeting as likely to bring a real internal debate over policy direction. Bond yields stayed elevated after his remarks, with the 10-year Treasury near 4.50%.

    Spot Bitcoin ETFs Post Record Monthly Outflow

    US spot Bitcoin ETFs shed roughly $4.5 billion in June, their worst month since launching in January 2024. BlackRock’s IBIT absorbed a large share of the redemptions. XRP and Hyperliquid funds bucked the trend, pulling in $59.4 million and $161 million, respectively, suggesting investors are growing selective rather than exiting crypto altogether.

    Robinhood Launches Public Blockchain and Expands Crypto Suite

    Robinhood unveiled Robinhood Chain, a public layer-2 blockchain built on Arbitrum, at a London event this week. The launch brings tokenized stock trading live across more than 120 countries. A new lending product, Robinhood Earn, is part of the rollout too. Robinhood shares jumped 8% on the announcement.

    Investor and Market Outlook

    Bitcoin enters July with cautious optimism after a historically weak first half. The token fell in both Q1 and Q2, only the third time that has happened since 2018. In the two earlier instances, the second half brought little relief. July has historically been kind to Bitcoin, with the token closing green in 9 of the last 13 years, with average returns near 7.25%. That seasonal pattern, paired with Warsh’s softer tone, leaves room for further upside if ETF flows stabilize.

    Investors should track daily ETF flow data from SoSoValue and Treasury yield movement this week. Bitcoin’s ability to hold above $60,000 remains the key signal to watch. A confirmed break past $62,000 would strengthen the bullish case, while a slip under $58,000 would revive downside risk toward $55,000.

  • Bitcoin Clings to $60K as Record ETF Outflows and Dollar Strength Intensity Pressure

    Bitcoin Clings to $60K as Record ETF Outflows and Dollar Strength Intensity Pressure

    Bitcoin remained stubbornly near the $60,000 mark on July 2, 2026, as a combination of heavy institutional outflows from spot Bitcoin ETFs and a strengthening U.S. dollar kept the world’s largest cryptocurrency under pressure. After a dismal June performance, the digital asset traded within a tight range of $58,800 to $60,000, with traders closely watching the key support level.

    The total market value of Bitcoin hovered around $1.2 trillion, while daily trading volume remained robust at $38–$40 billion, signaling continued trader activity even as uncertainty dominated sentiment.

    Heavy ETF Outflows Shake Investor Confidence

    Spot Bitcoin ETFs bled a staggering $4.5 billion in outflows during June, the worst monthly withdrawal since their launch in early 2024. BlackRock’s iShares Bitcoin Trust (IBIT) and Grayscale’s Bitcoin Trust (GBTC) faced the heaviest redemptions, collectively losing roughly 71,600 BTC from their holdings. On June 30 alone, more than $220 million exited Bitcoin ETF products, highlighting persistent caution among large investors.

    These outflows have raised fresh concerns about waning institutional interest, which had previously been a major driver of Bitcoin’s upward momentum.

    Strong U.S. Dollar Adds Headwinds

    The U.S. Dollar Index (DXY) remained firm near 101.3, bolstered by expectations of strong labor market data and uncertainty around Federal Reserve interest rate cuts. A stronger dollar typically diverts capital away from riskier assets like cryptocurrencies, as investors seek safer returns in bonds and other traditional instruments.

    Citigroup Slashes Bitcoin Price Target

    Adding to the bearish sentiment, Citigroup lowered its 12-month Bitcoin price forecast from $112,000 to $82,000. The bank cited weaker ETF demand, lower institutional participation, and slower progress in crypto regulation. In a worst-case scenario, Citigroup warned Bitcoin could fall as low as $53,000 if ETF outflows persist and recession fears intensify.

    Derivatives Market Shows Mixed Signals

    Despite the broader weakness, the derivatives market displayed some resilience. Over $79 million in short liquidations occurred as traders who bet on further declines were forced to cover positions, triggering a brief price bounce. Bitcoin’s Fear and Greed Index hovered near 10, indicating extreme fear — a level that historically sometimes precedes temporary recoveries. Meanwhile, open interest in Bitcoin futures stood at roughly $44.5 billion, suggesting active trader participation.

    What’s Next for Bitcoin?

    Analysts are focused on the critical support zone between $57,700 and $58,000. A break below this level could trigger additional selling, potentially driving Bitcoin toward $55,000. Conversely, a move above $62,000 would likely restore some market confidence and set the stage for a July recovery. For now, direction hinges on ETF flow trends, Federal Reserve policy signals, and broader investor risk appetite.

  • Bitcoin Price at Critical Crossroads: Will BTC Break $60K or Slide to $49K?

    Bitcoin Price at Critical Crossroads: Will BTC Break $60K or Slide to $49K?

    Bitcoin has entered July 2026 under intense market pressure. As of July 2, 2026, BTC trades near $58,800 — one of its weakest price levels in over a year. The market has remained unstable for weeks, causing concern among traders and investors worldwide.

    In recent days, Bitcoin suffered another major decline, dropping to nearly $57,950 — the lowest level in almost 21 months. After touching that low, the cryptocurrency staged a modest recovery, moving back into the $58,600–$59,000 range. Despite this slight uptick, the overall trend remains bearish.

    This latest fall has surprised many market observers, given that Bitcoin reached an all-time high near $126,000 in late 2025. The stark contrast between that peak and the current price underscores how quickly crypto markets can shift.

    Current Price Reflects Weak Market Sentiment

    Sellers have clearly taken control. Bitcoin lost nearly 20% in June 2026 alone, making it one of the worst months for the asset this year. Year-over-year, Bitcoin has fallen roughly 44%, fueling fear across the crypto ecosystem. Trading volumes remain elevated, suggesting that many traders are rapidly entering and exiting positions amid uncertainty.

    Technical indicators also point to weakness. Bitcoin now trades below key long-term levels that institutional investors typically monitor — most notably the 200-week exponential moving average. Historically, when BTC falls below this threshold, it often enters a prolonged correction. Many analysts draw parallels to the 2022 crypto crash, when Bitcoin remained under pressure for months before recovering.

    Key Price Levels Under Watch

    Bitcoin faces formidable resistance near $60,000. Every recent recovery attempt has stalled at this zone, and buyers have failed to push through with conviction. On the downside, $57,500 serves as immediate support. A breakdown below this level could trigger a slide toward $53,000–$54,000, and if selling intensifies, the market may target $49,000 — what many analysts call the most dangerous short-term level.

    Conversely, a decisive break above $60,000 could restore market confidence and set the stage for a recovery toward $64,000. Analysts view the $60,000 zone as the most critical pivot point for Bitcoin’s near-term direction.

    Headwinds From Institutional and Regulatory News

    Recent developments have added to the selling pressure. Citigroup, a major global financial institution, slashed its 12-month Bitcoin forecast from $112,000 to $82,000, citing weak investor demand and slow progress on U.S. crypto regulation. Meanwhile, Bitcoin ETFs have seen nearly $3.3 billion in outflows during 2026, signaling diminished institutional confidence.

    Investor attention has also shifted to other sectors, particularly artificial intelligence and semiconductors, diverting capital away from digital assets. Adding to the unease, Strategy Inc. (formerly MicroStrategy) reportedly sold part of its Bitcoin holdings in June, rattling a market already on edge.

    What’s Next for Bitcoin?

    The path ahead remains uncertain, with analysts offering divergent views. Conservative forecasts suggest Bitcoin could recover to $82,000–$100,000 by year-end if institutional demand returns and ETF inflows resume. More bullish projections see BTC reaching $120,000–$180,000 by late 2026, driven by limited supply, rising global adoption, and improved market confidence.

    However, bearish scenarios persist. If recession fears mount and institutional money continues to exit, Bitcoin could fall to $40,000–$50,000 before finding a stable floor.

    Final Market Snapshot

    Bitcoin stands at a pivotal juncture. The current price near $58,800 reflects fear, weak short-term confidence, and extreme caution among investors. The next move hinges on two critical levels: $60,000 resistance and $57,500 support. Long-term belief in Bitcoin remains intact, as adoption continues worldwide, but short-term signals are undeniably fragile.

    As the second half of 2026 begins, the crypto market confronts one of its most uncertain periods in recent years, and all eyes remain fixed on Bitcoin as traders await the next major move.

  • Bitcoin ETFs See $222M Outflow, UK FCA Finalizes Crypto Rulebook, Binance Hit With $200M Lawsuit: Crypto News Roundup

    Bitcoin ETFs See $222M Outflow, UK FCA Finalizes Crypto Rulebook, Binance Hit With $200M Lawsuit: Crypto News Roundup

    The cryptocurrency market witnessed a flurry of notable events today, as Bitcoin spot ETFs recorded massive outflows, the UK Financial Conduct Authority (FCA) published its final crypto rulebook, and Binance faced a $200 million class-action lawsuit in London. Additionally, hackers managed to steal over $75 million from crypto platforms in June.

    Bitcoin Spot ETFs Suffer $222 Million in Net Outflows

    According to data from SoSoValue, Bitcoin spot ETFs experienced a total net outflow of $222.64 million on the last trading day. BlackRock’s IBIT led the withdrawals with a daily net outflow of $212.45 million, bringing its total historical net inflow to $60.25 billion. Fidelity’s FBTC followed with a $10.20 million outflow, and its historical net inflow now stands at $10.13 billion. The total net asset value of Bitcoin spot ETFs is $70.95 billion, with an ETF net asset ratio of 6.02%. Cumulative net inflows across all Bitcoin ETFs have reached $51.15 billion.

    CryptoQuant CEO Predicts Parabolic Bitcoin Rally

    CryptoQuant CEO Ki Young Ju took to X (formerly Twitter) to share his outlook, stating that Bitcoin is poised for another parabolic surge. He noted that while capital efficiency is declining, the current cycle has seen $697 billion in net capital inflows, generating only a 689% return. In contrast, $2.7 billion in 2011 drove a 55,436% increase. Ju believes that the next parabolic bull run will require deeper institutional allocation and that Bitcoin must transition into a core macro asset rather than remaining an ETF product driven primarily by retail investors. He added that this shift is still in its early stages and that Bitcoin could achieve another parabolic surge if it absorbs over $1 trillion in realized market cap.

    UK FCA Releases Final Crypto Rulebook

    The UK’s Financial Conduct Authority has finalized a comprehensive crypto rulebook, published on June 30. The framework introduces mandatory licensing, custody standards, market-abuse protections, disclosure requirements, and prudential rules. Firms wishing to conduct regulated crypto activities in the UK must obtain FCA approval. Applications will open on September 30, 2026, and close on February 28, 2027, with the regime expected to take effect on October 25, 2027. A notable change from the initial proposal is the reduction in capital requirements for non-systemic stablecoin issuers from 2% to 1% of the total value issued. The UK’s stablecoin framework operates on two tracks: the FCA oversees most qualifying stablecoin issuers and cryptoasset custodians, while the Bank of England handles systemic stablecoins.

    June Hacks Drain $75.87 Million From Crypto Platforms

    According to blockchain security firm PeckShield, crypto platforms lost approximately $75.87 million across 40 separate hacking incidents in June. This figure marks a 7.13% decline from May’s total of $81.7 million. The largest single breach was the Humanity Protocol exploit, which accounted for over $30 million in losses. Attackers compromised private keys that had been backed up to a malware-infected developer machine. Security firm Quantstamp reported that the methods and tools used in the attack are commonly associated with North Korean hacking groups. The exploiter has since laundered the stolen funds across multiple networks, including Bitcoin, Solana, Hyperliquid, and BNB Chain.

    Binance Faces $200 Million Class-Action Lawsuit in London

    Approximately 1,700 British investors have filed a class-action lawsuit before the High Court in London against Binance and its co-founder Changpeng Zhao. The plaintiffs are demanding $200 million in damages for losses allegedly incurred due to the trading of unauthorized derivative products. The case was officially filed on June 30. The traders claim that Binance promoted high-risk leveraged products since late 2019 without obtaining the necessary regulatory permissions. According to KP Law, the firm representing the claimants, many of the clients were ordinary citizens who invested their life savings and suffered losses of tens of thousands of pounds.

    Disclaimer: This article is for informational purposes only and does not constitute investment advice. Cryptocurrencies are highly volatile and involve significant risk. Always conduct your own research before investing.