Tag: Bitcoin

  • Bitcoin Holds Near $59K as Solana Rallies 2% Ahead of Fed Chair’s ECB Speech — Market Overview

    Bitcoin Holds Near $59K as Solana Rallies 2% Ahead of Fed Chair’s ECB Speech — Market Overview

    Bitcoin Steadies, Solana Leads Gains as Markets Await Fed Chair Warsh

    Bitcoin opened July on firmer footing, trading near $59,190 after a rough June. The cryptocurrency is up 0.30% in the past 24 hours and 5.64% over the week, as bargain hunters begin to step back in. Meanwhile, Solana outperformed major coins, surging 2.05% on renewed DeFi activity. All eyes now turn to Federal Reserve Chair Kevin Warsh’s remarks at the ECB Forum, which could set the tone for the week ahead.

    Bitcoin Price Today

    Bitcoin is currently at $59,190.41, with a market cap near $1.18 trillion and 24-hour volume of $35.11 billion. Key support sits between $58,000 and $59,000, while resistance is at $61,800–$62,500. A breakout above $62,500 could open the door to $64,000.

    Akshat Siddhant, Lead Quant Analyst at Mudrex, notes that nearly 45% of Bitcoin’s supply is now at a loss — a level not seen since 2019. He warns that a hawkish Warsh could push Bitcoin to $55,000, while a dovish tone might fuel a rally back to $60,000.

    Solana and Other Top Movers

    • Solana (SOL): Up 2.05% daily, 8.55% weekly, driven by rising decentralized finance activity.
    • TRON (TRX): Gained 0.86%, supported by steady stablecoin settlement volumes.
    • Stablecoins (USDT, USDC): Traded flat near $1.00, behaving as expected.

    Key News Driving Sentiment

    • Circle shares slide after Stripe, Coinbase, and BlackRock back a competitor stablecoin network, Open USD, threatening USDC’s dominance.
    • Strategy (formerly MicroStrategy) nears its 11th losing month out of 12, with shares down 41% in June. The firm unveiled a $2 billion buyback plan and flexibility to sell Bitcoin if needed.
    • Spot Bitcoin ETFs posted their worst month ever in June, with $4.06 billion in outflows, driven by a hawkish Fed meeting and a stronger dollar.
    • SEC opens comment period on ETF rule changes that could reshape how crypto funds operate.
    • Jefferies warns the CLARITY Act faces a make-or-break Senate test; passage could boost institutional adoption, while failure keeps regulatory fog in place.

    Market Outlook

    This week hinges on two catalysts: Fed Chair Warsh’s ECB Forum remarks and the US payrolls report. A dovish surprise from either could send Bitcoin back toward $60,000. Traders should also monitor daily ETF flows, dollar strength, and whether Solana’s momentum spreads to other altcoins.

    FAQs

    What is the Bitcoin price today?

    Bitcoin is trading at $59,190.41, up 0.30% in 24 hours and 5.64% on the week. Support is at $58,000–$59,000; resistance is $61,800–$62,500.

    Why did Bitcoin fall in June?

    A record $4.06 billion in spot Bitcoin ETF outflows, a hawkish Fed meeting, a stronger dollar, and rising Treasury yields combined to pressure Bitcoin lower.

    What’s the biggest crypto story today?

    The launch of a rival stablecoin network (Open USD) backed by Stripe, Coinbase, and BlackRock is challenging Circle’s USDC. Also, the SEC’s ETF rule review could have long-term implications.

    Which coins are leading gains?

    Solana leads with a 2.05% daily gain, followed by TRON at 0.86%. Stablecoins remain flat.

    What should traders watch this week?

    Fed Chair Warsh’s ECB speech and US payroll data will be key. Also track ETF flows and Bitcoin’s ability to hold above $59,000.

    Disclaimer: This article is for informational purposes only and does not constitute financial advice. Always do your own research before investing.

  • Bitcoin Slides to $58,650 Amid $6B ETF Outflows and Strong Dollar

    Bitcoin Slides to $58,650 Amid $6B ETF Outflows and Strong Dollar

    Bitcoin has come under strong pressure as the price stays close to the important $60,000 mark. The world’s biggest cryptocurrency has faced a difficult period after several market developments created fresh uncertainty. Investors now monitor closely as Bitcoin trades around levels that could decide its short-term direction.

    As of 1 July 2026, Bitcoin stands near $58,650. The price has dropped almost 2.7% in the last 24 hours and more than 6.5% over the past seven days. This recent fall has raised concern since Bitcoin had shown stronger performance earlier this year. The current weakness now puts the market under pressure as traders wait for signs of recovery.

    Large ETF Withdrawals Hurt Market Confidence

    One of the biggest reasons behind Bitcoin’s recent fall comes from heavy withdrawals from spot Bitcoin exchange-traded funds, commonly known as ETFs. These investment products had played a major role in pushing Bitcoin higher during previous months. Large institutions had entered the market through these funds and helped create strong buying demand.

    However, June turned into a difficult month for Bitcoin ETFs. Market data shows more than $4 billion left spot Bitcoin ETFs during June alone. Over the last thirty days, total withdrawals have crossed $6 billion. This marks one of the largest monthly outflow periods since spot Bitcoin ETFs first entered the market in early 2024.

    Strong US Dollar Creates More Pressure

    Another major reason behind Bitcoin’s weakness comes from the strength of the U.S. dollar. The dollar has become stronger as financial markets now expect the U.S. Federal Reserve to keep interest rates high for a longer period.

    Bitcoin usually performs better when cheap money enters financial markets and investors feel comfortable taking bigger risks. Right now, the opposite situation exists. Higher Treasury yields and tighter monetary policy have created a difficult environment for digital assets.

    Institutional Sentiment Starts to Change

    The market also faced fresh pressure after major corporate Bitcoin holder Strategy Inc. announced a new liquidity management plan. The company revealed that up to $1.25 billion in Bitcoin sales may become possible under this plan.

    Analysts estimate that the company’s move may create a possible $4.4 billion supply overhang. This has hurt confidence since institutional buying had been one of the strongest factors behind Bitcoin’s earlier rally.

    Derivatives Market Shows Signs of Weakness

    The derivatives market has also shown clear signs of stress. Open interest in Bitcoin futures has fallen almost 14% in recent sessions. This number usually reflects weaker trader confidence and reduced market participation.

    At the same time, many traders who placed leveraged bullish bets have faced forced liquidations after Bitcoin moved lower. This situation has added extra selling pressure and made price recovery more difficult.

    Fear Returns Across Crypto Markets

    Overall sentiment in the crypto market has weakened sharply. The widely followed Crypto Fear and Greed Index recently dropped to 14 points, which places market sentiment inside the ‘Extreme Fear’ zone.

    Such a low reading usually shows that many investors feel nervous about short-term market direction. Fear often rises after sharp price declines, especially when large institutions begin reducing exposure.

    Important Price Levels Traders Watch Next

    From a technical market view, Bitcoin’s inability to move back above $60,000 has become a major concern. This price level now acts as an important resistance zone.

    At present, immediate support sits between $58,000 and $59,000. If Bitcoin fails to stay above this range, analysts believe the next downside target could move closer to $55,000.

    Why this Matters

    Bitcoin’s drop below $60,000 tests institutional conviction after a record $6 billion ETF exit. How the market reacts at this critical support floor will dictate the entire crypto trajectory for the remainder of 2026.

    What Happens Next for Bitcoin

    Despite the current weakness, some analysts believe this may only be a temporary correction rather than the start of a larger collapse. Bitcoin has experienced sharp declines many times in previous market cycles before eventually recovering.

    For now, the market remains focused on ETF flow data, future decisions from the U.S. Federal Reserve, and broader global market conditions.

    Until institutional demand returns and the U.S. dollar loses strength, Bitcoin may continue to face pressure near the important $60,000 level.

    The next few weeks could decide whether Bitcoin begins a fresh recovery or enters a deeper correction that changes the crypto market for the rest of 2026.

    FAQs

    1. What is driving Bitcoin’s drop below the $60,000 threshold? The recent decline is primarily fueled by massive capital outflows from spot Bitcoin ETFs, a strengthening U.S. dollar backed by prolonged high interest rates, and a potential $4.4 billion supply overhang following a liquidity management announcement by Strategy Inc.
    2. Exactly how much capital has exited Bitcoin ETFs recently? Market confidence took a major hit after more than $4 billion left spot Bitcoin ETFs during June 2026 alone. Total withdrawals over the last 30 days have surpassed $6 billion, marking one of the most severe outflow periods since the funds launched in early 2024.
    3. Why does a stronger U.S. dollar negatively impact Bitcoin? A dominant U.S. dollar, paired with higher Treasury yields and tighter monetary policy, makes traditional risk-free assets more attractive. This environment reduces investor appetite for higher-risk digital assets like cryptocurrencies.
    4. What are the key technical support and resistance levels to watch right now? As of July 1, 2026, Bitcoin is trading near $58,650. The $60,000 mark has now flipped into a major resistance zone. Immediate downside support sits between $58,000 and $59,000; if this floor breaks, analysts warn the price could slide toward $55,000.
    5. How severely has market sentiment been affected by this sell-off? Sentiment has deteriorated sharply into “Extreme Fear,” with the Crypto Fear and Greed Index plunging to 14 points. This shift is mirrored in the derivatives market, where Bitcoin futures open interest has dropped by roughly 14% alongside significant liquidations of leveraged longs.
  • Bitcoin Drops to $58,500 as Bearish Sentiment Intensifies

    Bitcoin Drops to $58,500 as Bearish Sentiment Intensifies

    Bitcoin entered July 2026 under significant pressure, trading near $58,500 after a prolonged downward trend. The leading cryptocurrency has lost over 30% of its value since its all-time high of $126,000 in October 2025, driven by weak investor sentiment, ETF outflows, and broader economic headwinds.

    Key Developments

    • Price Action: Bitcoin currently trades between $58,500 and $59,000. Over the past 24 hours, it slipped 0.7%, extending year-to-date losses beyond 30%. In India, the asset is valued at approximately Rs. 55.84 lakh.
    • Support and Resistance: The critical support level sits at $58,000. A breakdown could push prices toward $55,000 or even $46,000. On the upside, Bitcoin needs to reclaim $62,500 to initiate a recovery, with resistance at $65,600 and $70,000.
    • Technical Indicators: The Relative Strength Index (RSI) is near oversold territory, while the MACD continues to show bearish momentum, indicating sellers remain in control.

    Why Bitcoin Is Falling

    Several factors are fueling the decline:

    • ETF Outflows: Spot Bitcoin ETFs have seen $5–6 billion exit in recent weeks, signaling reduced institutional appetite.
    • Macroeconomic Pressure: Higher global interest rates dampen demand for risk assets like cryptocurrencies.
    • Capital Rotation: Investment funds are shifting from crypto to artificial intelligence stocks, which have seen strong growth.
    • Corporate Selling: Strategy, a major corporate Bitcoin holder, introduced a plan allowing partial sales, raising fears of increased supply.

    Market Sentiment and Outlook

    Sentiment remains bearish as sellers dominate short-term price action. However, long-term adoption continues: companies like Visa, Google, and Morgan Stanley are still investing in blockchain technology. For July 2026, Bitcoin could trade between $59,000 and $66,000 if support holds, with a potential recovery toward $65,000–$70,000. Conversely, a break below $58,000 would likely trigger further declines toward $55,000 or deeper.

    The $58,000 level is the most important to watch. It will determine whether the market stabilizes or enters another leg of the correction.

    Frequently Asked Questions

    1. What is Bitcoin’s price on July 1, 2026? It trades between $58,500 and $59,000.
    2. Why has Bitcoin fallen so much in 2026? ETF outflows, high interest rates, and reduced investor confidence have driven the decline.
    3. What is the biggest support level? The key support is near $58,000.
    4. Can Bitcoin recover this month? If support holds, prices may move back toward $65,000–$70,000.
    5. Is sentiment bullish or bearish? Currently bearish, with sellers controlling the market.

    Disclaimer: This article is for informational purposes only and does not constitute financial advice. Cryptocurrency investments carry risk. Always conduct your own research before investing.

  • Bitcoin ETFs See $231M Outflow, XRP Holds $1, AAVE Surges 21%: Crypto Market Update

    Bitcoin ETFs See $231M Outflow, XRP Holds $1, AAVE Surges 21%: Crypto Market Update

    Market Overview

    The crypto market witnessed major developments as Bitcoin spot ETFs logged $231.10 million in net outflows, while XRP held $1 support and AAVE jumped 21% over seven days. Meanwhile, Solana teamed up with Toss Bank, and Strategy authorized Bitcoin sales.

    Bitcoin Saw $231 Million in Outflows

    According to SoSoValue, Bitcoin spot ETFs saw a total net outflow of $231.10 million yesterday. The Bitcoin spot ETF with the highest net inflow was Ark Invest and 21Shares’ ETF ARKB, with a daily net inflow of $49.97 million, bringing its total historical net inflow to $1.21 billion. Grayscale’s ETF GBTC followed with a daily net inflow of $35.10 million, though its total historical net outflow stands at $27.11 billion. BlackRock’s ETF IBIT recorded the largest daily outflow at $300.38 million, with a total historical net inflow of $60.47 billion. The total net asset value of Bitcoin spot ETFs is $73.19 billion, with an ETF net asset ratio of 6.05%. The historical cumulative net inflow has reached $51.37 billion.

    Solana Partners with Toss Bank on Cross-Border Payments

    The Solana Foundation and South Korean digital lender Toss Bank have signed a memorandum of understanding to explore blockchain-powered remittance and settlement services. The agreement establishes a framework for developing a proof-of-concept that could use Solana’s blockchain infrastructure to support faster and lower-cost international payments for Toss Bank’s 15 million customers. This partnership represents the first direct collaboration between a South Korean internet-only bank and the Solana ecosystem, highlighting growing interest among financial institutions in blockchain-based payment infrastructure. The initial phase centers on a proof-of-concept designed to evaluate Solana as a platform for cross-border remittance and settlement services.

    XRP Holds $1 Support

    XRP held above $1 and traded marginally higher during the session, while network activity rose sharply and ETF inflows continued. XRP daily active addresses rose from 23,000 on June 14 to nearly 39,500 by June 27, a 72% increase in two weeks. Activity increased on June 29, when volume reached 86.5 million XRP, about 67% above the 24-hour average. Open interest across major exchanges fell below 150 million from a 1.3 billion peak, and XRP ETFs added $15.34 million in net inflows on June 29. The $1 level remains key support, with $1.06 as the first short-term resistance, followed by $1.09-$1.10.

    AAVE Price Is Up 21% in 7 Days

    Aave climbed back above the $90 level. The token rose nearly 21% in the last seven days; at press time, AAVE was up 3.4%, trading at $91.48. During the rally, AAVE’s market capitalization and 24-hour trading volume surged by 3.4% and 3.66%, respectively, to $1.4 billion and $279.41 million. The price surge followed Aave founder Stani Kulechov’s rejection of claims tied to a discounted AAVE token sale and his announcement that the protocol is working on Aavenomics 3.0, which will include an automated buyback mechanism. Kulechov stated, “There is NO WAY we’d sell AAVE at a 70% discount lol.”

    Strategy Authorized BTC Sale

    In a press release and 8-K filing dated June 29, the firm formerly known as MicroStrategy unveiled a “Digital Credit Capital Framework,” a five-part overhaul of how it manages its balance sheet. This is the first time Strategy’s board has authorized the sale of Bitcoin, up to $1.25 billion to build a cash reserve, plus further sales to cover preferred dividends, interest, and stock buybacks. Strategy holds 847,363 BTC, bought for about $64.1 billion at an average price near $75,650. With bitcoin trading below $60,000 this week, that stack is worth roughly $50 billion, leaving the company with $13 billion in unrealized loss on paper.

    FAQs

    1. How much outflow did Bitcoin spot ETFs record? According to SoSoValue, Bitcoin spot ETFs recorded total net outflows of $231.10 million yesterday. BlackRock’s IBIT saw the largest outflow at $300.38 million.

    2. Which Bitcoin ETF saw the highest inflow? Ark Invest and 21Shares’ ARKB recorded the highest daily inflow at $49.97 million. Its total historical net inflow now stands at $1.21 billion.

    3. Why is XRP’s $1 level important? The $1 level is a key support zone for XRP and has helped stabilize short-term sentiment. The next resistance levels are seen at $1.06 and then $1.09-$1.10.

    4. Why did AAVE rise 21% in seven days? AAVE rallied as the token moved back above $90 and investor attention returned to Aavenomics 3.0. Founder Stani Kulechov also rejected claims of a discounted token sale, saying, “There is NO WAY we’d sell AAVE at a 70% discount lol.”

    5. What did Strategy announce about Bitcoin sales? Strategy authorized Bitcoin sales of up to $1.25 billion to build cash reserves under its Digital Credit Capital Framework.

  • Bitcoin Tests Key Support as Early Bottom Signals Emerge: What Traders Should Watch

    Bitcoin Tests Key Support as Early Bottom Signals Emerge: What Traders Should Watch

    Bitcoin has reached a critical price zone as on-chain data reveals early signs of a market bottom, while long-term chart levels continue to expose the cryptocurrency to further losses. Selling pressure appears to be easing after heavy market declines, but analysts caution that Bitcoin must hold nearby support before any sustained recovery can develop.

    The next several weeks will be pivotal in determining whether buyers can establish a stable base or if sellers will drive prices toward lower levels.

    On-Chain Model Enters Bottoming Zone

    On-chain analyst MorenoDV notes that Bitcoin has produced one of its first signals of a deeper market cleanup, though the data does not confirm a final bottom. The analyst uses the Bitcoin UTXO Block Profit and Loss Count Ratio Model, which compares profitable UTXO blocks with those holding unrealized losses.

    A high ratio indicates many holders still have profits available, creating room for further selling as investors reduce exposure or lock in gains. Conversely, a lower reading suggests more holders have moved into losses after the market has already absorbed heavy selling pressure.

    The latest ratio has entered a zone associated with earlier bottoming periods, but MorenoDV says the 365-day moving average still needs to decline further. Until that longer-term measure drops, the current signal may reflect a temporary oversold phase rather than a complete market reset.

    Bitcoin Range Keeps $67,000 in View

    Crypto trader Honey observes that Bitcoin has already moved below the June low near $59,000, leaving the June high around $67,000 as the next major range level. The trader expects the strongest range-bound outcome to involve a rise over the next four to six weeks before Bitcoin approaches the June high.

    That path would carry the price from one side of the current range to the other before any larger decline develops during the fourth quarter. This outlook does not signal the start of a new bull market, as Bitcoin would remain inside an established range while traders await clearer direction.

    Short-covering could also trigger brief rallies if bearish traders close positions, although MorenoDV says those moves would not prove a lasting recovery. The key question is whether buyers can sustain enough demand to push Bitcoin toward $67,000 while the broader market still tests long-term support.

    200-Week Average Shifts Focus Lower

    Chart analyst Nic Puckrin notes that Bitcoin closed below its 200-week simple moving average for the first time in more than three years. The break also marked the first move below that average during the current market cycle, increasing attention on lower support levels.

    In earlier bear markets, the 200-week average served as a major reference point for traders tracking long-term market weakness. Puckrin identifies the 61.8% Fibonacci retracement near $57,900 as the next support level if Bitcoin remains below the long-term average.

    If sellers break that zone, traders may turn toward the on-chain realized price near $53,200 as the next major level. For now, on-chain conditions suggest slower selling, while chart signals show that Bitcoin still faces pressure around several important support areas.

    What’s Next?

    Bitcoin shows early bottoming signals as selling pressure begins to ease, but the market still faces major risks below the 200-week moving average. Support at $57,900 and $53,200 remains critical, while $67,000 marks the next recovery target. Traders should watch these levels before confirming a stronger rebound.

  • Bitcoin and Gold Sink Together in 2026 as Market Pressures Mount

    Bitcoin and Gold Sink Together in 2026 as Market Pressures Mount

    Bitcoin and gold have both declined as higher interest rates, tighter liquidity, and market uncertainty reduced demand for traditional and digital stores of value. The rare move has raised attention because the two assets often follow different paths during market stress.

    Bitcoin and gold have fallen sharply in 2026, marking an uncommon period when two assets often viewed as stores of value declined together. Market strategist Charlie Bilello reported that Bitcoin is down 31% while gold has lost 6% this year, making them the weakest-performing major asset classes so far.

    The unusual move has drawn attention because the two assets have historically performed differently during periods of market stress.

    Bitcoin and Gold Record an Unusual Year

    Charlie Bilello reported that Bitcoin and gold have become the two worst-performing major asset classes in 2026. He described the development as something ‘we havenʼt seen before in any calendar year.’

    The simultaneous decline suggests investors have reduced exposure to both digital and traditional stores of value. Instead, capital has moved toward other asset classes that have delivered stronger returns during the year.

    Several factors have contributed to the shift. Market conditions have become more challenging in 2026 as investors respond to higher interest rates, tighter liquidity, geopolitical uncertainty and a rise in crypto-related security incidents. These factors have weakened demand for both Bitcoin and gold.

    Analysts also point to the stronger US dollar and the Federal Reserve’s restrictive monetary policy as key drivers behind the downturn. Higher borrowing costs have encouraged investors to shift toward income-generating assets, reducing interest in investments that do not produce regular yields.

    Correlation Between Bitcoin and Gold

    Bitcoin climbed above $110,000 during the second half of 2025 while gold continued to post steady gains. Even though both assets advanced, they responded to different market conditions and showed only a limited price correlation.

    The relationship changed during 2026. Bitcoin dropped from around $90,000 to nearly $60,000 after February. Gold held up better at first but later moved lower as well. By June, both assets were declining at the same time, pushing their price correlation into positive territory for one of the rarest periods on record.

    Data from CryptoQuant also showed noticeable changes in the Bitcoin-gold price correlation between June 2025 and June 2026. The correlation moved between positive and negative readings before strengthening as both assets declined together.

    Bitcoin researcher Adam Livingston commented on the trend, stating that “2026 is officially the most oversold year for Bitcoin versus gold ever recorded.” At the same time, the Bitcoin-to-gold ratio continued to weaken, reflecting Bitcoin’s larger decline compared with gold.

    Gold Outlook Remains Mixed as Market Uncertainty Continues

    Investor Robert Kiyosaki recently shifted his focus from Bitcoin to precious metals after discussing both assets earlier in June. On June 25, he announced that gold had “made the turn” and predicted a longer-term bull market for gold and silver while maintaining a $35,000 long-term price target.

    Days later, however, he revised his short-term view after gold extended its decline. On June 29, Kiyosaki admitted, “I was wrong. Gold still crashing.” Despite the setback, he maintained his longer-term bullish outlook for the metal.

    Gold has also faced pressure from changing geopolitical developments. Reports surrounding US-Iran nuclear negotiations reduced demand for safe-haven assets as some investors shifted toward riskier investments. At the same time, uncertainty over future Federal Reserve policy has continued to influence both gold and Bitcoin prices.

    Market participants are now watching central bank decisions, US dollar strength and geopolitical events for signs of whether the recent weakness in both assets will continue or begin to reverse.

  • Bitcoin 2026 Mid-Year Outlook: Will the Second Half Spark a Recovery?

    Bitcoin 2026 Mid-Year Outlook: Will the Second Half Spark a Recovery?

    Bitcoin entered 2026 with high expectations after a strong rally in late 2025. During the previous market surge, Bitcoin crossed $126,000, which created huge excitement across the crypto market. Now, Bitcoin trades close to $60,000, meaning the asset has lost more than 50% of its value from the peak level. The first half of the year turned into one of the weakest periods for Bitcoin since the major crypto crash of 2022.

    Why Bitcoin Fell

    Several major reasons pushed Bitcoin lower during the first half of the year. One of the biggest reasons came from the global economy. Central banks across many countries kept interest rates high for longer than expected. Higher rates usually hurt risky assets as investors move money into safer places.

    Another reason came from changing market trends. Over the past year, large investors shifted focus toward artificial intelligence companies, technology stocks, and traditional safe assets like gold. As money moved elsewhere, Bitcoin lost some of the strong demand that helped push prices higher in previous years.

    Recently, Bitcoin even dropped below the important $60,000 support level and touched nearly $59,800. This price level worried traders since it showed that sellers still control short-term market action.

    Institutional Demand Became Weak

    Institutional demand played a huge role in Bitcoin’s rally during 2024 and 2025. Large investment firms poured billions of dollars into Bitcoin exchange-traded funds, also known as ETFs. That steady flow of money helped prices move upward very quickly.

    Recent reports show nearly $4.5 billion moved out of Bitcoin investment funds this year. This large withdrawal clearly shows that big institutions have become more careful. Many investors now wait for stronger market conditions before they put fresh money back into crypto.

    Problems Faced by Bitcoin Mining Companies

    Bitcoin miners also faced serious challenges this year. Mining companies help secure the Bitcoin network, but their business depends heavily on the market price. Right now, many mining firms face rising costs. Electricity prices remain high in several countries, while equipment costs continue to put pressure on profits. For some miners, production expenses now sit dangerously close to Bitcoin’s actual market value.

    A Big Surprise From Strategy Inc

    Strategy Inc, the company previously known as MicroStrategy, has always stood as one of Bitcoin’s biggest corporate supporters. For years, the company followed a simple strategy and kept buying Bitcoin without any plan to sell. The company announced a major restructuring plan that could lead to up to $1.25 billion worth of Bitcoin sales. Along with this move, the company also announced stock buybacks and plans to strengthen reserves.

    Reasons Recovery Still Looks Possible

    Historically, Bitcoin often follows a four-year market cycle. Price weakness usually appears after major rallies, but recovery often arrives later than expected. Some analysts believe the current correction may continue for a few more months before the market finds stability. Technical experts say the $58,000 price zone now acts as a very important support level. If Bitcoin stays above this range, price could move back toward $70,000 to $75,000 before summer ends.

    Experts Still Expect Higher Prices

    Some analysts from major firms have predicted Bitcoin could reach anywhere between $100,000 and $170,000 by the end of the year. These forecasts depend on several important factors. One major factor involves ETF demand returning later this year. Another factor depends on better government regulation. If clear crypto laws arrive in major economies, many institutions may return with fresh capital.

    What Comes Next for Bitcoin

    Right now, market sentiment remains cautious, but long-term belief has not disappeared. Some market predictions suggest Bitcoin may recover toward $80,000 to $90,000 before 2027 begins, while others remain more conservative. Much depends on economic conditions, investor confidence, and regulatory progress during the next few months.

    Bitcoin faced a very disappointing first half of 2026, but history shows sharp corrections do not always signal the end of a bull cycle. If confidence returns and institutional demand rises again, the second half of the year may finally bring the recovery that many market watchers still expect.

  • How India’s Income Tax Department Tracks Bitcoin and Crypto Transactions: KYC, TDS, and Blockchain Analytics

    How India’s Income Tax Department Tracks Bitcoin and Crypto Transactions: KYC, TDS, and Blockchain Analytics

    Yes, the Income Tax Department can trace Bitcoin and crypto transactions in India through various sources including exchange KYC records, TDS forms, blockchain analytics, bank transactions, and income tax return disclosures. Crypto is decentralized, but it’s not invisible. The department actively uses these methods, as evidenced by over 44,000 enforcement notices issued to undisclosed crypto users in 2025-26.

    In India, Virtual Digital Assets (VDAs) like cryptocurrencies such as Bitcoin, Ethereum, and others are taxable. The Income Tax Department states that income from the transfer of VDAs is taxed at a flat rate of 30% plus surcharge and cess. Further, 1% TDS is applicable on VDA transfers under Section 194S.

    How Crypto Transactions are Tracked

    Exchange Records: Exchanges gather identity information like PAN, Aadhaar-linked bank account numbers, and transaction history during every crypto transaction on FIU-approved platforms. This attaches a face to crypto transactions, purchases, sales, deposits, and withdrawals.

    TDS Reporting: Under Section 194S, 1% TDS is deducted from the consideration received on VDA transfers. This creates a tax trail even before investors file their returns. When TDS is reported by the exchange but the taxpayer does not report crypto income in Schedule VDA, a mismatch occurs, triggering scrutiny.

    Blockchain Analytics: Bitcoin and Ethereum transactions are not private. While wallet addresses do not reveal names, a wallet can be linked to a KYC exchange account, and analytics can track fund flows and historical transactions.

    FIU and PMLA Monitoring

    VDA service providers must register as reporting entities with FIU-IND under PMLA. Platforms are required to keep records and report suspicious transactions. Tax officials reported discovering Rs. 888.82 crore in undisclosed crypto transaction income during searches or arrests.

    Foreign Exchanges and Self-Custody

    Some visibility is lost with foreign exchanges, but not eliminated with self-custody wallets. Even when transactions occur through banks or P2P payments, movement of wallets and conversion to rupees may leave a trail. The OECD Crypto-Asset Reporting Framework may soon enhance cross-border information sharing.

    Why This Matters

    Crypto is not anonymous in India. Advanced tracking through KYC, TDS, blockchain analytics, and 44,000 issued tax notices makes accurate reporting under the flat 30% tax rate vital for investors to avoid severe legal scrutiny.

    What Indian Crypto Users Should Do

    Maintain exchange statements, wallet records, TDS certificates, bank transfer proofs, and transaction history. Report gains properly in Schedule VDA and disclose foreign holdings if necessary. Compliance is safer than assuming Bitcoin or other digital assets cannot be traced.

    FAQs

    1. Can the Income Tax Department track Bitcoin transactions in India? Yes, through exchange KYC, bank records, TDS filings, and blockchain analytics. Once a wallet is linked to a verified exchange account, past and future transactions become traceable.
    2. Is crypto income taxable in India? Yes, at a flat rate of 30% plus surcharge and cess, with 1% TDS on qualifying VDA transfers under Section 194S.
    3. How does 1% TDS help track crypto transactions? It creates a transaction trail linked to PAN. If gains are not reported in Schedule VDA despite TDS data, it triggers scrutiny.
    4. Can self-custody wallets hide crypto from tax authorities? They add pseudonymity but not invisibility. Wallet movements, exchange withdrawals, P2P payments, and rupee conversion can still create traces.
    5. What should Indian crypto users do for tax compliance? Maintain exchange statements, wallet records, TDS certificates, bank proofs, and transaction history.

    Disclaimer: This article is for informational purposes and does not constitute financial or investment advice. Cryptocurrencies involve risk; conduct your own research before investing.
  • Bitcoin Stumbles to $59,800 as $4 Billion ETF Exodus Rattles Crypto Markets

    Bitcoin Stumbles to $59,800 as $4 Billion ETF Exodus Rattles Crypto Markets

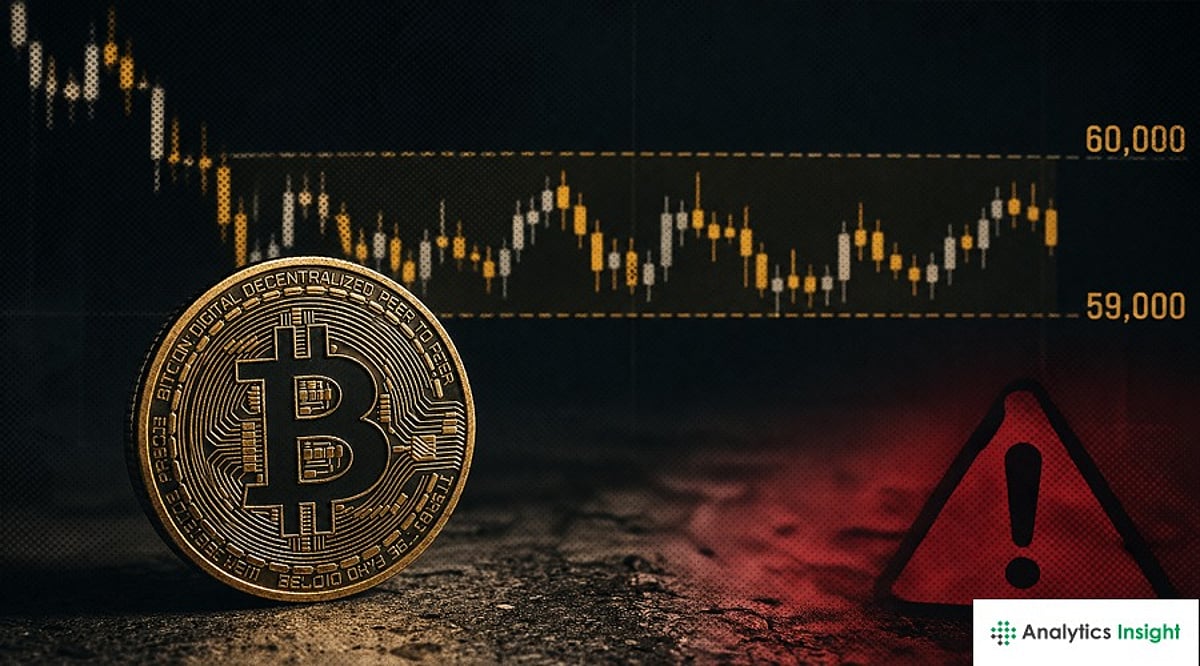
    Bitcoin is trading near the critical $60,000 support level after a steep decline from its all-time high of $126,223. The cryptocurrency has lost nearly 50% of its value since late 2025, with recent outflows of more than $4 billion from spot Bitcoin ETFs amplifying selling pressure. Market uncertainty, weak technical signals, and shifting investor sentiment have combined to create one of the most challenging periods for Bitcoin in 2026.

    Current Price Performance

    As of June 30, 2026, Bitcoin hovers between $59,800 and $60,000. The price briefly dipped below this key level during the past week before staging a modest recovery. Trading volume remains subdued compared to the highs of the 2025 rally, indicating that buyer conviction has not yet returned. The contrast with the $126,223 peak is stark, placing Bitcoin in its most severe correction since the previous bear market.

    Technical Indicators Point to Bearish Control

    Technical analysis shows Bitcoin trading below major long-term moving averages. The price is under the 20-month exponential moving average (EMA) near $79,900 and the 50-month EMA around $65,600. This positioning suggests that sellers retain control. The nearest support lies at $58,100; a break below that could open the door to $55,000. On the upside, resistance is clustered between $62,000 and $65,600. Momentum oscillators such as the Relative Strength Index (RSI) and Moving Average Convergence Divergence (MACD) remain weak, making a strong rally unlikely in the near term.

    Key Drivers of the Decline

    • Massive ETF Outflows: More than $4 billion has exited spot Bitcoin ETFs in recent weeks, as institutional investors reduce exposure.
    • Macroeconomic Headwinds: Central banks’ cautious stance on interest rate cuts continues to weigh on risk assets like cryptocurrencies.
    • Capital Rotation: Investor attention has shifted toward artificial intelligence and semiconductor stocks, siphoning demand from Bitcoin.
    • Corporate Selling: Strategy Inc. (formerly MicroStrategy) sold a portion of its Bitcoin holdings for the first time since 2022, raising concerns about corporate support.
    • Regulatory Caution and Weaker Retail Participation: Stricter crypto regulations in several countries and lower retail engagement have added to the pressure.

    Outlook for the Rest of 2026

    Despite the short-term gloom, many analysts maintain a bullish long-term outlook. Forecasts suggest Bitcoin could recover to the $100,000–$130,000 range by year-end if institutional demand returns and macroeconomic conditions improve. More optimistic projections place Bitcoin between $150,000 and $180,000, though such targets would require strong positive catalysts. For now, the $60,000 level is pivotal: holding above it may restore confidence, while a breakdown could trigger further downside. The market remains at a crossroads, making the coming weeks critical for Bitcoin’s trajectory.

    Frequently Asked Questions

    1. What is Bitcoin’s current price in June 2026?
      Bitcoin is trading near $59,800 to $60,000 following recent market weakness.
    2. Why has Bitcoin price fallen in 2026?
      Major reasons include ETF outflows, weak investor confidence, high interest rates, and reduced demand.
    3. What is the key support level for Bitcoin now?
      The strongest short-term support is at $60,000, with lower support around $58,100.
    4. Can Bitcoin recover later in 2026?
      Many analysts expect recovery if institutional demand returns and market conditions improve.
    5. What price targets do experts predict for Bitcoin by year-end?
      Most forecasts place Bitcoin between $100,000 and $130,000, with bullish estimates reaching $180,000.

    Disclaimer: This article is for informational purposes only and does not constitute investment advice. Cryptocurrency investments carry high risk; always conduct your own research.

  • Today’s Tech Brief: Snapdragon Summit 2026 Dates, Nordic Unicorns, AI Commerce & Crypto Slump

    Today’s Tech Brief: Snapdragon Summit 2026 Dates, Nordic Unicorns, AI Commerce & Crypto Slump

    Good morning! Here’s your quick scan of the latest developments in mobile technology, higher education, startups, artificial intelligence, and cryptocurrency markets.

    What’s New Today

    Qualcomm has announced the dates for its Snapdragon Summit 2026, where its next-generation flagship chipset is expected to debut. A Delhi University graduate’s viral post has reignited conversations around campus placements for humanities students. At the same time, a new report highlights the Nordic region’s emergence as a global startup powerhouse with more than 100 unicorns.

    Fast-Track Insights

    AI search analytics platforms are becoming essential for ecommerce brands looking to improve visibility across generative AI tools. Meanwhile, the cryptocurrency market remains under pressure as Bitcoin, Ether, Solana, and Dogecoin declined following concerns over Strategy’s proposed Bitcoin sales plan.

    Dates for Qualcomm’s Snapdragon Summit 2026 Announced

    The Snapdragon Summit 2026 will take place between September 22 and 24 at Qualcomm’s headquarters in Hawaii. It is anticipated that during the summit, Qualcomm will reveal its new Snapdragon 8 Elite Gen 6 chipsets, most probably manufactured using the 2 nm process technology. Also, the summit is likely to see announcements of new technologies for AI, PCs, cars, and phones.

    Delhi University History Student’s Post Highlights Campus Recruitment Inequalities

    A LinkedIn post by a DU History graduate, who graduated with 84%, stating that none of the companies recruit humanities students from her campus’ placement cell, has gone viral.

    Nordic Startup Ecosystem Crosses 100 Unicorn Milestone

    A new industry report shows that Nordic startups have created 105 unicorns and managed to surpass $560 billion in enterprise value, which is pretty substantial. The study highlights how the region continues to build globally competitive tech companies, primarily by pursuing capital-efficient growth, leaning into invention, and improving mentorship for entrepreneurs.

    AI Search Analytics Platforms Become Essential for Ecommerce

    As consumers discover more and more items through AI assistants, e-commerce companies are investing in AI search analytics platforms to track brand presence, monitor rivals, and tune product recommendations across ChatGPT, Gemini, Claude, Perplexity, and classic search engines.

    Crypto Markets Slip as Strategy’s Bitcoin Sales Plan Weighs on Sentiment

    Crypto prices dropped after Strategy put forward a plan to sell Bitcoin, which unsettled investors. Ether and Dogecoin logged notable weekly losses, while XRP and BNB also moved down. Solana looked more resilient, yet the overall market mood remained cautious because selling pressure is still there.