Tag: Federal Reserve

  • Bitcoin Price Analysis: BTC Hovers Near $64,000 as Fed Decision Puts Key Resistance in Focus

    Bitcoin Price Analysis: BTC Hovers Near $64,000 as Fed Decision Puts Key Resistance in Focus

    Bitcoin (BTC) is trading around $63,916.87 on Thursday, down 0.23% over the last 24 hours and 2.66% across the past seven days, after the US Federal Reserve left interest rates unchanged. Investors are closely watching the macroeconomic backdrop, institutional appetite, and key technical levels that could determine Bitcoin’s next major directional move.

    Fed Decision Keeps Markets on Edge

    The US Federal Reserve held its interest rate steady at 3.50%-3.75%, matching market expectations. Minutes from the meeting indicated that economic activity has been expanding at a strong pace despite elevated uncertainty. The central bank also noted that job gains have “kept pace with the workforce.” The policy vote was 9-3, with Cleveland, Minneapolis, and Dallas Fed Presidents dissenting in favor of a 25-basis-point rate increase.

    Technical Structure

    BTC price trades close to $64,000, maintaining a bearish near-term bias as it holds below the 50-day, 100-day, and 200-day Exponential Moving Averages (EMAs), with the nearest EMA resistance at $64,967. The Relative Strength Index (RSI) hovers just below 50 on the daily chart, hinting at neutral-to-slightly constructive momentum, but the Moving Average Convergence Divergence (MACD) has slipped into negative territory, suggesting that upside attempts remain vulnerable.

    On the upside, immediate resistance is seen at the 50-day EMA around $64,967, followed by the 100-day EMA near $67,621 and the 200-day EMA close to $73,665. A more distant resistance stands at $84,410. On the downside, immediate support stands at $64,000, and a clear break below this floor would push BTC toward the yearly low of $57,800, set on July 1.

    Institutional Flows and Macro Risks

    According to Glassnode, Bitcoin has underperformed the US dollar during the latest dollar rally, making this one of its weakest relative performances compared with previous market cycles. However, BTC’s current performance ranks among the weakest, with only three of the 20 previous dollar rallies producing a worse performance at a comparable point. The underperformance could continue as the 30-year Treasury Yield rose above 5.20% on Wednesday. Glassnode also highlighted pressure from the three-month Bitcoin futures basis, which has remained below the two-year US Treasury yield since February.

    Bitcoin ETF Recorded Inflows

    According to SoSoValue, Bitcoin spot ETFs recorded a net inflow of $32.10 million on July 29, breaking a four-day outflow streak. BlackRock’s IBIT led with $89.8281 million, bringing its total to $60.421 billion. Fidelity’s FBTC experienced a $43.0832 million outflow, with a total of $9.959 billion. Bitcoin news highlights the ETFs’ net asset value at $77.455 billion.

    FAQs

    1. Why is Bitcoin trading near $64,000 after the Fed meeting?

    Bitcoin remained range-bound after the US Federal Reserve kept interest rates unchanged. Investors are weighing macroeconomic uncertainty, Treasury yields, and institutional demand before making larger directional bets.

    2. What are the key resistance levels for Bitcoin?

    The first resistance lies near the 50-day EMA around $64,967, followed by the 100-day EMA near $67,621 and the 200-day EMA around $73,665. A sustained move above these levels could strengthen bullish momentum.

    3. What support levels should Bitcoin traders watch?

    Immediate support is located around $64,000. If this level fails, Bitcoin could revisit the yearly low near $57,800, making it a crucial area for buyers to defend.

    4. How are Bitcoin ETFs influencing the market?

    Spot Bitcoin ETFs recorded net inflows of $32.10 million, ending a four-day outflow streak. Continued institutional inflows through ETFs are viewed as a positive indicator for long-term market confidence.

    5. Why is Glassnode cautious about Bitcoin’s outlook?

    According to Glassnode, Bitcoin has underperformed during the latest US dollar rally, while higher Treasury yields and weaker futures basis may reduce institutional participation, potentially limiting near-term upside momentum.

    Disclaimer: This article is provided for informational purposes and does not constitute investment advice. You are responsible for conducting your own research (DYOR) before making any investments. Read more about the financial risks involved here.
  • Oil Surge and AI Stock Sell-Off Push Wall Street Lower Ahead of Fed Decision

    Oil Surge and AI Stock Sell-Off Push Wall Street Lower Ahead of Fed Decision

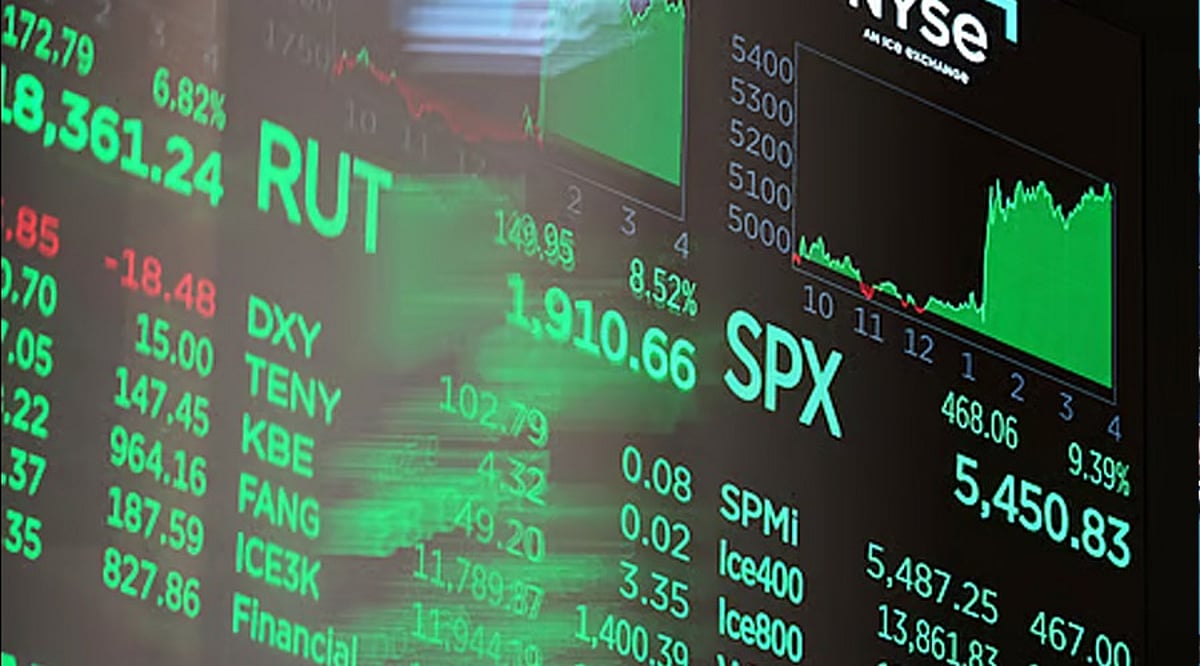
    US stocks fell sharply Wednesday as rising oil prices and semiconductor losses weighed on major indexes. The Dow Jones Industrial Average dropped about 800 points during morning trading. The S&P 500 and NASDAQ Composite also declined before the Federal Reserve’s rate decision.

    Oil prices jumped after a new exchange of attacks involving Iran and US forces in the Middle East, renewing concerns about energy costs and inflation. Investors also watched chip stocks after several sessions of heavy selling.

    Dow Jones Leads Broad Market Decline

    The Dow Jones fell more than 1% as industrial, financial, and consumer shares moved lower. At one stage, the index lost over 800 points. The S&P 500 fell about 0.7%, while the NASDAQ dropped roughly 1%. Market figures fluctuated through the morning as trading remained volatile.

    Declining shares outnumbered advancing stocks on both the New York Stock Exchange and NASDAQ. Caterpillar fell as the industrial sector led losses. Consumer staples and healthcare posted small gains, showing limited demand for defensive shares.

    Oil Surge Adds Pressure Ahead of Fed Decision

    Crude oil prices rose after Iran launched missiles toward US forces in Jordan. US Central Command said forces intercepted the missiles. President Donald Trump then said the United States would respond strongly, adding pressure across energy and equity markets.

    Brent crude gained about 6%, while West Texas Intermediate rose close to 7%. Higher oil prices can raise transport and production costs. The latest jump arrived as the Fed prepared to announce its policy decision at 2 p.m. Eastern Time.

    Futures markets placed the highest probability on the Fed keeping rates between 3.5% and 3.75%. Available pricing showed a hold probability near 64%. The remaining probability supported a quarter-point increase. Traders also expected further tightening later in 2026.

    Jay Woods of Freedom Capital Markets said, “Any Fed surprise could cause this sell-off to accelerate.” Investors will review Chair Kevin Warsh’s press conference for details about inflation, employment, and future policy decisions.

    Semiconductor Stocks Extend Weekly Losses

    Semiconductor shares extended a four-session decline as investors questioned returns from large artificial intelligence spending programs. The iShares Semiconductor ETF fell nearly 4% during Wednesday trading. Its weekly loss moved above 10% as selling spread across major chip companies.

    Micron Technology and Advanced Micro Devices each lost more than 6% during the session. KLA fell more than 8%, while NVIDIA also traded lower. The Philadelphia Semiconductor Index dropped as investors reviewed spending, revenue growth, and competition from Chinese technology companies.

    Gina Martin Adams of HB Wealth said, “The pressure is shifting from spending plans to returns.” Big Tech earnings will provide more data on revenue from AI investments. Microsoft and Meta will report after Wednesday’s close. Amazon and Apple will release results later this week.

    Truist Securities maintained a positive long-term view on chip demand despite the sell-off. Analyst William Stein said industry contacts still reported strong demand. He also noted that buyers now place larger orders for longer periods. However, current trading showed concern about valuations and near-term earnings.

    Ford Rises as Procter and Gamble Falls

    Ford Motor gained more than 6% after raising its annual profit forecast. The automaker also reported results above market expectations. The increase made Ford one of the stronger stocks during a session dominated by broad losses.

    Procter and Gamble fell almost 3% after reporting weaker revenue than expected. The company also forecast slower sales growth for fiscal 2027. Seagate Technology gained after issuing quarterly revenue and profit forecasts above estimates. These moves created pockets of strength and weakness across the market.

    Investors now face three immediate events: the Fed decision setting policy direction for rates, Warsh’s comments shaping expectations for later meetings, and Big Tech earnings testing whether heavy AI spending has started producing stronger revenue.

  • Bitcoin Holds Above $64K as Traders Await Fed Rate Decision Amid $430M Liquidation Wave

    Bitcoin Holds Above $64K as Traders Await Fed Rate Decision Amid $430M Liquidation Wave

    Bitcoin traded near $64,300 on Wednesday as traders prepared for the Federal Reserve’s interest-rate decision. The asset recovered part of Tuesday’s decline after moving between $62,400 and $66,700 during a volatile period. The broader crypto market also gained, even after exchanges closed more than $430 million in leveraged positions.

    Moreover, the Fed’s July 28–29 meeting kept traders cautious. Markets largely expect officials to hold the federal funds target range at 3.50% to 3.75%. However, traders still assign roughly a one-in-three chance of a quarter-point increase. Inflation stays above the Fed’s 2% goal, while easing oil prices have reduced some immediate pressure.

    Bitcoin Price Holds as Fed Decision Nears

    Bitcoin gained about 1.5% over 24 hours and stayed above $64,000. The move tracked a 1.2% rise in total crypto market value. Ether advanced toward $1,913, while XRP and Cardano posted smaller gains. Jupiter led major decentralized finance tokens with a gain of nearly 6%.

    Traditional markets showed limited direction before the announcement. S&P 500 and NASDAQ 100 futures edged higher, while gold stayed above $4,000. Silver rose about 1.4%. These moves showed demand across several assets rather than a clear shift into one market segment.

    Bitcoin’s immediate range centers on support near $63,410 and resistance around $64,748. A move above resistance could open a retest of recent highs. A break below support would place $62,329 back in focus. Price action may stay sensitive to the Fed statement and press conference.

    Long Positions Lead $435 Million Liquidation Wave

    Meanwhile, CoinGlass data cited in the supplied report showed that exchanges liquidated 111,555 traders over 24 hours. Total liquidations reached $430 million. Long positions accounted for $324.03 million, while short positions represented $111.47 million.

    Ethereum recorded the largest asset-level total at $74.34 million. Bitcoin followed with $65.78 million. Binance handled $201.08 million of the closures, close to half of the market total. Hyperliquid followed with $93.93 million, while OKX recorded $53.89 million.

    The liquidation wave did not trigger a broad price collapse. Instead, Bitcoin and several large altcoins recovered as forced selling slowed. The total was far below the approximately $19 billion liquidation event recorded on October 10, 2025. However, the Fear and Greed Index stayed in the ‘Fear’ zone at 29.

    Derivatives Traders Keep Exposure Steady

    However, derivatives data showed traders had not added large new positions before the Fed decision. Total crypto open interest stayed near $113 billion, while trading volume rose 10% to $205 billion. The taker long-short volume ratio also stayed close to balance.

    Bitcoin open interest held near 750,000 BTC. Ether open interest declined for a fourth day to 14.14 million ETH. UNI moved against the wider trend, with open interest rising to 68.53 million tokens after its price gained about 5%.

    Options data showed stronger demand for Bitcoin downside protection. Put options at $62,000, $60,000 and $54,000 led Deribit’s 24-hour volume rankings. Ether calls ranked higher than puts. Meanwhile, 30-day implied volatility for both assets stayed near recent lows.

    The Fed is scheduled to release its decision at 2 p.m. Eastern Time, followed by a press conference. Traders will watch whether Bitcoin holds above $63,410 or faces rejection near $64,748 after the announcement.

  • Bitcoin Holds Steady Near $63.9K, Ethereum and XRP Gain Ahead of Fed Decision

    Bitcoin Holds Steady Near $63.9K, Ethereum and XRP Gain Ahead of Fed Decision

    Bitcoin traded near $63,882, up 0.96%, as investors awaited the Federal Reserve’s rate decision. Whale accumulation supported sentiment despite ETF outflows and liquidations, while Ethereum, XRP, and Hyperliquid outperformed. Markets now watch the Fed for the next major crypto catalyst.

    Bitcoin Price Today

    Bitcoin trades at $63,882.29, up 0.96% over the past 24 hours. This reflects live CoinMarketCap data tracked through today’s session. Market cap stands near $1.28 trillion, with 24-hour volume at $23.65 billion. Price action stays tied to Fed rate bets and whale accumulation trends.

    Whales Accumulate Despite Weak Sentiment

    Akshat Siddhant, Lead Quant Analyst at Mudrex, said Bitcoin is consolidating after briefly touching a 10-day low near $63,000. A sell-off in Asian semiconductor stocks spilled into crypto this week. Liquidations crossed $510 million, while ETF outflows added further pressure. Whale wallets still added nearly 19,700 BTC over eight days. Bitcoin needs to reclaim $65,000 to regain momentum.

    Fed Decision and Inflation Data in Focus

    The CoinSwitch Markets Desk noted BTC dipped below $63,000 on Senate delays around the CLARITY Act. Prices recovered toward $64,000 soon after. Near-term direction depends on the Fed’s tone, core PCE inflation, and GDP data. A rate hold with softer guidance could push Bitcoin toward $68,000.

    Institutions Turn Cautious Before FOMC

    Vikram Subburaj, CEO of Giottus, placed Bitcoin near $63,620 heading into the Fed decision. Markets still see roughly a 33% chance of a rate hike this cycle. US spot Bitcoin ETFs booked outflows near $476.8 million across three sessions. Support holds near $62,700, with resistance at $66,700. He advised staggered buying over large directional bets.

    Consolidation Ahead of the Next Catalyst

    Riya Sehgal, Research Analyst at Delta Exchange, said crypto markets are consolidating after the recent correction. Bitcoin is recovering from support but stays below the $65,500 resistance zone. Ethereum mirrors this pattern, holding support near $1,865. Elevated oil prices remain a watch point for inflation and Fed policy.

    Institutional Flows Turn Selective

    Nischal Shetty, founder of WazirX, said Bitcoin retreated earlier this week before stabilizing near $63,785. Liquidation activity and softer institutional flows weighed on broader sentiment. Spot Bitcoin ETFs saw modest outflows, while Ethereum products kept attracting inflows. XRP holds above $1.05, with a push past $1.10 signaling renewed altcoin strength.

    Crypto Prices Today: Top 10 Coins at a Glance

    Based on live CoinMarketCap data as of today’s session.

    Biggest Gainers: HYPE, XRP, ETH

    Hyperliquid led the top 10 board, climbing close to 4% through the session. XRP followed with a sharp 2% move, while Ethereum extended its steady climb past $1,900.

    Relative Laggards: USDC, USDT, SOL

    Stablecoins stayed pinned near their peg, barely moving through the day. Solana posted the smallest gain among majors, holding just above the $73 mark.

    Crypto News Today: Top Headlines Impacting Prices

    Macro data, regulatory delays, and geopolitical risk are steering sentiment across desks today.

    Fed Meeting Concludes With Rate Verdict Due

    The Fed’s two-day meeting wraps up today, with the decision and press conference due this afternoon. CME’s FedWatch data shows hold odds have firmed, though hike bets stay elevated. Traders view this announcement as the week’s defining catalyst for crypto and equities alike.

    Apple Crosses $5 Trillion as Oil Rebounds on Iran Tensions

    Apple’s stock hit an all-time high, pushing its market capitalization above $5 trillion past Nvidia. Reports of renewed tension near a US military base sent crude oil rebounding sharply higher. The move revived geopolitical risk concerns that had briefly eased earlier this month, adding pressure on rate-sensitive assets.

    CLARITY Act Stays Stalled in the Senate

    The crypto market structure bill remains stuck over ethics provisions, with Republicans needing seven Democratic votes to advance it. Prediction markets have trimmed 2026 passage odds sharply from earlier estimates. The delay keeps regulatory uncertainty elevated for exchanges awaiting clearer digital asset rules heading into August.

    Whale Wallets Keep Buying Through the Dip

    On-chain data shows large Bitcoin holders added nearly 19,700 BTC over eight sessions. This accumulation came even as spot ETF flows turned choppy and outflows persisted. Analysts read this as a sign of longer-term conviction beneath short-term price weakness.

    Ethereum ETFs Keep Attracting Fresh Inflows

    Spot Ethereum products continued pulling in fresh capital even as Bitcoin funds saw outflows. This divergence suggests institutional investors are rotating exposure rather than exiting crypto broadly. Ether’s relative strength this week reflects that shifting allocation pattern among larger funds.

    HYPE Token Unlock Adds Supply Pressure

    Hyperliquid faces a token unlock releasing over 4% of circulating supply this week. Despite the added supply, HYPE still posted the sharpest gain among the top 10 coins. Traders are watching whether this momentum holds once the unlocked tokens hit the market.

    Investor and Market Outlook

    Bitcoin holds near $63,880 as traders weigh whale accumulation against Fed rate uncertainty. A close above $65,000 could open a path toward the $68,000 resistance zone. A slip below $63,000 risks exposing support closer to $62,500 in coming sessions.

    Ethereum trades near $1,903, holding firm above key support after a volatile week. Altcoins including Hyperliquid and XRP remain most sensitive to shifts in risk appetite. The Fed’s rate verdict stands as this week’s defining catalyst for broader crypto direction.

    FAQs

    What is the Bitcoin price today?

    Bitcoin trades near $63,882.29, up 0.96% over the past 24 hours. Support holds near $63,000, while resistance builds around $65,000 and $68,000. Analysts expect range-bound trading until the Fed’s decision brings clearer direction to markets this week.

    Why is the Fed meeting affecting crypto prices?

    Traders are pricing in a likely hold with some chance of a hawkish surprise at today’s FOMC decision. Higher rate expectations typically pressure risk assets like Bitcoin and altcoins. A dovish tone could ease that pressure and support a relief rally.

    What is the biggest crypto news today?

    The CLARITY Act’s stalled Senate progress and Apple’s $5 trillion milestone are shaping sentiment today. Renewed Iran-linked tensions pushed oil higher, adding fresh weight to the broader market narrative heading into the Fed decision.

    Which coins are performing best today?

    Hyperliquid leads gains with a near 4% rise, followed by XRP and Ethereum with solid advances. Stablecoins and Solana posted the smallest moves, staying relatively flat across the top 10 board today.

    What should investors watch this week?

    Track the Federal Reserve’s rate verdict, ETF flow trends, and Bitcoin’s key support zones closely. Senate action on the CLARITY Act remains a critical signal. Watch Treasury yields and oil prices for added direction cues.

  • Bitcoin Dips Below $64,000, Holds Steady at $63,500 as Markets Eye Fed Policy

    Bitcoin Dips Below $64,000, Holds Steady at $63,500 as Markets Eye Fed Policy

    Bitcoin traded near $63,500 on July 28 after a sharp decline during the early hours. The largest cryptocurrency slipped from almost $64,900 to nearly $63,200 in a short period. Strong selling pressure pushed prices lower, while high trading volume confirmed active market participation. Later, buyers stepped in near the lower range and helped Bitcoin recover part of the loss. The price settled close to $63,497, which showed that both buyers and sellers remained active near current levels.

    The latest market data showed a daily decline of around 2.7% to 3%. Bitcoin moved inside a 24-hour range of roughly $63,000 to $65,650. The digital asset held a market capitalization near $1.27 trillion, while daily trading volume reached almost $27 billion. These figures reflected healthy market activity even after the sharp move lower.

    Technical Picture Shows Signs of Recovery

    The five-minute chart displayed three clear phases throughout the session. The first phase brought a strong decline that erased earlier gains. Large red candles and rising trading volume highlighted firm selling pressure across the market. Bitcoin then entered a second phase where the price moved inside a narrow range around $63,100 to $63,300. This section showed that selling pressure started to slow as buyers entered the market.

    The final phase brought a gradual recovery. Bitcoin created higher lows and climbed above the middle Bollinger Band, which traders often watch as a short-term trend indicator. The rebound reached the upper Bollinger Band, although fresh buying strength slowed near that level. The overall structure pointed toward a short-term recovery inside a wider corrective move instead of a complete trend reversal.

    Bollinger Bands Suggest Fresh Volatility Ahead

    The Bollinger Bands offered another important signal. Bitcoin traded between the middle band and the upper band after the recovery. The distance between the bands narrowed compared with the sharp move earlier in the session. This pattern often reflects lower volatility after a large price swing.

    A narrow band setup usually comes before another notable move. A strong push above the upper band could attract fresh buyers and support another advance. On the other hand, failure near current levels could invite sellers back into the market and place pressure on nearby support zones.

    RSI Shows Balanced Market Momentum

    The Relative Strength Index, also known as RSI, recovered well after the earlier decline. The indicator stood near 56, while its moving average remained close to 61. These values showed that market momentum improved after the morning sell-off.

    The RSI stayed above the neutral level of 50, which suggested that buyers regained some control. At the same time, the indicator stayed below stronger bullish territory, which left room for either side to influence the next move. The chart also showed no clear bearish divergence, which reduced immediate concern about fading upward momentum.

    Key Price Levels Remain Important

    At present, Bitcoin lingers around various crucial technical points. Support first lays at the $63,450 mark, followed by $63,300 and $63,050. A significant intraday support area AFP is positioned between $62,950 to $63,000. Prices closing above this level might continue enhancing buyers’ positive sentiment in the next trading session.

    Resistance is visible above $63,600 and $63,750. A major hurdle exists around $64,000, and is then followed by $64,250. A positive move above the $64,000 mark may strengthen one’s market sentiment.

    Market Focus Turns Toward Major Economic Events

    The financial markets are currently monitoring the impending Federal Reserve policy meeting, which may impact risk assets worldwide. Traders anticipate new information regarding interest rates and future monetary policy, and a surprise by the central bank may induce significant price fluctuations in Bitcoin and other digital currencies.

    Lately, recent statistics have pointed toward improved investments in Bitcoin exchange-traded funds after a lackluster first semester of 2026. There has been some uptick in institutional interest, although institutional investors are still quite careful when it comes to opening positions.

    Another significant move has been made by Strategy, formerly known as MicroStrategy. The company suspended making new Bitcoin acquisitions for the third week in a row and rather concentrated on managing capital and repurchasing stock. Market participants continue to pay attention to corporate buying dynamics as major acquisitions have a tendency to increase the attractiveness of investing.

    On the global level, the developments in the world have had an impact on market sentiment. Recent signals of declining geopolitical tension steered investment towards risk assets in the financial markets. Still, analysts kept a close eye on developments around the world, knowing perfectly well that any unexpected development may have a serious impact on investor sentiment.

    Outlook Remains Cautiously Positive

    Bitcoin is beginning to establish itself in a new phase of stability following its previous steep drop and the gradual recovery of some of those losses. The buy side showed the strength necessary to establish some important support levels, while indicators of momentum seem to change positively. Markets await a strong enough signal to resume trend activity.

    Successful testing at the $63,450 level can open a pathway toward $63,700, $64,000, and $64,300. If the price drops below that area of support, the focus will shift toward $63,300, $63,050, and that general area between $62,950 and $63,000. At this point, the prices show a balanced situation on the market with both sides doing their best to take control.

  • FTSE 100 Opens Higher as Oil Prices Surge on Middle East Tensions; Investors Eye Fed Decision

    FTSE 100 Opens Higher as Oil Prices Surge on Middle East Tensions; Investors Eye Fed Decision

    The FTSE 100 opened 64.86 points higher at 10,935.88 on Wednesday, driven by renewed tensions in the Middle East that pushed oil prices higher. Investors are now awaiting the latest US Federal Reserve interest rate decision, which could influence market direction.

    Oil and Currency Markets

    Brent crude futures rose 3.54% to $87.07 per barrel, while US West Texas Intermediate (WTI) advanced 3.60% to $82.11. Sterling eased slightly to $1.3298 from $1.3306, and against the euro it fell to €1.1662.

    Top Gainers and Losers

    Gainers: Weir Group surged 8.40% to 2,736p, Reckitt Benckiser advanced 5.37% to 5,454p, Burberry Group gained 4.91% to 1,196p, Standard Chartered climbed 4.44% to 2,190p, Glencore rose 3.93% to 526.40p, and Sage Group increased 3.15% to 969.40p.

    Losers: Admiral Group declined 1.22% to 3,720p, Endeavour Mining fell 1.03% to 3,551p, Severn Trent slipped 0.92% to 3,032p, Halma eased 0.91% to 3,498p, Coca-Cola HBC dropped 0.79% to 5,045p, and Coca-Cola Europacific Partners edged 0.47% lower to 8,400p.

    Sage Revenue Growth

    Sage reported another quarter of double-digit revenue growth. Revenue rose 11% to £2.06 billion in the first nine months, with third-quarter growth accelerating to 12%, fueled by demand for its cloud accounting, payroll, and HR software. Cloud revenue climbed 15% to £1.76 billion, while recurring subscription revenue topped £2 billion. CFO Jacqui Cartin noted “nine months of accelerating revenue growth,” boosted by AI features and strong demand for products like Sage Intacct. The company maintained its forecast for organic revenue growth above 9% and expects continued operating margin improvements. Sage shares remain about 13% lower than a year ago.

    Greggs Shares Jump on Profit Surge

    Greggs shares rose more than 10% in early trade to 1,862p after the bakery chain posted a 20% jump in pre-tax profit to £76 million. The company plans to expand to at least 3,500 stores across the UK. Analyst Duncan Ferris of Freetrade said the profit boost came more from cost controls and lower inflation than from sales growth, adding that strong performance at new stores may alleviate fears of cannibalization.

    Glencore Trading Profit

    Glencore reported first-half profits of around $3.3 billion from its commodities trading arm, slightly below its annual earnings guidance of $3.5 billion. CEO Gary Nagle said the company delivered a “strong production performance” with key assets meeting expectations. Full-year production guidance for copper, zinc, and nickel remains unchanged, while energy and steelmaking coal guidance saw minor adjustments.

    Global Market Overview

    In the US, the Dow Jones climbed 537 points (1%) to 52,747, and the S&P 500 added 0.2%, while the Nasdaq slipped 0.2% to 24,877. In Asia, Tokyo’s Nikkei 225 fell 1.49% to 61,434.19, China’s Shanghai Composite gained 0.4%, Hong Kong’s Hang Seng advanced 1.77%, and South Korea’s Kospi edged lower by 5.98%. India’s Nifty 50 and Sensex rose 0.99% and 1.15%, respectively.

    Disclaimer: This article is for informational purposes only and does not constitute investment advice. Always conduct your own research before making investment decisions.

  • Sensex Surges Over 860 Points, Nifty Nears 24,250 as Indian Markets Rally Ahead of Fed Decision; Crude Oil Prices Climb

    Sensex Surges Over 860 Points, Nifty Nears 24,250 as Indian Markets Rally Ahead of Fed Decision; Crude Oil Prices Climb

    Indian benchmark indices extended their winning streak on Wednesday, rallying ahead of the US Federal Reserve’s monetary policy decision. The Sensex soared 866.97 points, or 1.12%, to close at 77,632.89, while the Nifty gained 1.06% to finish just shy of the 24,250 mark at 24,241. The Bank Nifty also rose 450.30 points, or 0.79%, and the India VIX eased by 4.28%, indicating reduced market volatility.

    Oil Prices Rise on Middle East Tensions

    Crude oil prices climbed as renewed geopolitical tensions in the Middle East reignited concerns over global supply disruptions. Lower US crude inventories and expectations regarding OPEC+ production policy also supported the upward move. Brent crude futures jumped 3.78% to $87.42 per barrel, while US West Texas Intermediate (WTI) advanced 3.68% to $82.18 per barrel.

    Top Gainers and Losers

    Market sentiment remained stock-specific, with investors favoring financials, IT, metals, and FMCG counters. Jio Financial Services led the gainers with a nearly 5% rise, followed by strong buying in Hindustan Unilever, Infosys, Hindalco Industries, and Tata Steel, buoyed by optimism around earnings, consumption demand, and improving sector outlooks.

    On the downside, Adani Ports emerged as the top loser amid profit booking, while Mahindra & Mahindra also traded lower. Selling pressure was relatively limited, with Power Grid Corporation, Eicher Motors, and Bajaj Auto witnessing marginal declines as investors remained cautious ahead of key domestic and global market triggers.

    Fed Meeting in Focus

    The US Federal Reserve kicked off its two-day monetary policy meeting on Tuesday, July 28. The rate-setting Federal Open Market Committee (FOMC), which convenes eight times a year, is scheduled to announce its interest rate decision on Wednesday, July 29. The FOMC will assess key economic data, including inflation, economic growth, and labor market conditions, before deciding on the federal funds rate.

    This upcoming meeting will also be Kevin Warsh’s second Federal Reserve policy meeting, with the US central bank widely expected to keep interest rates unchanged. During its previous policy meeting, the Fed maintained the benchmark interest rate within the 3.5%–3.75% target range.

    Disclaimer: This article is for informational purposes only and does not constitute investment advice. Readers are encouraged to conduct their own research before making any financial decisions.

  • Bitcoin ETFs See First Outflows in Days as Fed Hawkishness Weighs on Crypto Markets

    Bitcoin ETFs See First Outflows in Days as Fed Hawkishness Weighs on Crypto Markets

    Spot Bitcoin exchange-traded funds in the United States recorded net outflows, breaking a recent streak of consecutive inflows. The shift came as investors turned cautious ahead of the Federal Reserve’s upcoming policy meeting. While the outflows mark a notable change in fund flows, analysts view them as a short-term adjustment rather than a sign of declining institutional interest in Bitcoin.

    The recent winning streak had signaled healthy demand for Bitcoin ETFs, with many market experts interpreting it as evidence of steady institutional adoption. However, the latest data shows that many investors chose to reduce risk before a major economic event. Such positioning is common when financial markets anticipate important policy updates that could influence multiple asset classes.

    Federal Reserve Expectations Shape Market Mood

    The upcoming Federal Reserve meeting remains the biggest catalyst for financial markets. Most investors expect officials to keep interest rates elevated for an extended period. This outlook has created pressure across risk assets, including cryptocurrencies.

    Higher interest rates typically make traditional investments like government bonds more attractive. At the same time, a stronger U.S. dollar often curbs demand for higher-risk assets. Bitcoin and other digital currencies usually face headwinds in such an environment. As a result, many investors have decided to wait for the Fed’s latest commentary before making fresh commitments.

    Market participants are now scrutinizing every statement from policymakers. Even subtle shifts in language could alter expectations for future rate cuts and directly impact Bitcoin prices.

    Bitcoin Holds Near Key Price Levels

    Bitcoin traded near the $65,000 mark while investors monitored economic developments. The digital asset remained relatively stable even after the ETF outflows. Although price momentum slowed, the market avoided a sharp decline.

    This price action indicates that selling pressure remains contained. Many traders are holding existing positions rather than making large moves before the Federal Reserve meeting. Such caution has become typical whenever major economic announcements approach.

    The current trading range reflects a balance between buyers and sellers. While some investors reduced exposure, others continue to view Bitcoin as an attractive long-term asset. This equilibrium has helped support prices even as short-term confidence weakened.

    ETF Outflows Reflect Short-Term Caution

    The latest ETF data marks a clear break from the previous series of inflows. Earlier sessions had attracted steady investments into spot Bitcoin ETFs, bolstering confidence across the crypto market. The recent outflows changed that pattern, although the overall picture remains more positive than earlier periods that saw much larger withdrawals.

    Several analysts believe the latest numbers represent temporary caution rather than a fundamental shift in institutional demand. Large investors often adjust portfolios before important economic events. Such decisions help manage risk until fresh information becomes available.

    The recent outflows also highlight how closely Bitcoin ETFs now track broader financial trends. Institutional investors play a larger role in the crypto market than in previous years, meaning economic policy now carries greater influence over digital asset prices.

    Macroeconomic Pressure Stays Strong

    Economic conditions remain the primary driver of Bitcoin’s recent price action. Investors continue to monitor inflation data, interest rate expectations, Treasury yields, and the strength of the U.S. dollar. Each of these factors shapes confidence across financial markets.

    A hawkish policy outlook typically limits demand for assets that rely on strong investor confidence. Many traders prefer safer investments until economic uncertainty begins to fade. This pattern has affected cryptocurrencies several times over the past few years.

    Bitcoin has shown strong resilience during earlier periods of market pressure. However, short-term price swings often emerge whenever expectations around monetary policy change. The current market reflects that same pattern as investors wait for more clarity from the Federal Reserve.

    Attention Turns to the Next Market Catalyst

    The Federal Reserve’s next decision could determine the direction of Bitcoin and spot Bitcoin ETFs in the near term. Investors are also watching for new inflation reports that could alter expectations about interest rate changes. Strong economic data may reinforce the hawkish sentiment, while softer figures could increase the chances of future rate cuts.

    Market participants will also track ETF fund flows after the Fed meeting. A rapid return to inflows would signal renewed institutional confidence. Conversely, continued outflows could keep Bitcoin prices at lower levels for an extended period.

    Bitcoin’s ability to hold above the $64,000–$65,000 range is crucial. Maintaining this level would provide market confidence after a period of caution.

    Why This Matters

    Spot Bitcoin ETFs have become a major bridge between traditional finance and the cryptocurrency market. Changes in ETF flows often reflect institutional confidence and broader market sentiment. Federal Reserve policy also shapes investor decisions across global markets. Together, these factors influence Bitcoin prices, investment strategies, and the direction of the digital asset sector.

    Outlook Remains Focused on Institutional Demand

    The latest ETF outflows ended a strong winning streak, yet the overall outlook has not changed dramatically. Institutional demand remains stronger than in earlier periods that experienced heavy withdrawals. The recent slowdown reflects caution ahead of a major economic event rather than a complete shift in investor sentiment.

    Bitcoin continues to trade within an important price range while the market waits for fresh guidance from the Federal Reserve. Future ETF flows, inflation data, and central bank policy will remain the key factors shaping the next phase of the cryptocurrency market.

  • Wall Street on Edge: Fed Decision, Inflation Data, and Big Tech Earnings Set for Volatile Week

    Wall Street on Edge: Fed Decision, Inflation Data, and Big Tech Earnings Set for Volatile Week

    Global markets are bracing for a turbulent 72-hour period as a wave of major events—including a Federal Reserve decision, key inflation data, GDP figures, and earnings from tech giants Microsoft, Meta, Apple, and Amazon—converge on the calendar. The sequence kicks off with consumer confidence data, followed by the Fed’s policy announcement, economic growth and inflation reports, and a flurry of earnings from four of the largest companies in the S&P 500. Traders are poised for sharp moves across stocks, bonds, currencies, and cryptocurrencies as each release could shift expectations for the next Fed meeting.

    Fed Decision Takes Center Stage

    Tuesday’s Conference Board consumer confidence report provides an early gauge of household demand. A weak reading may signal slower spending, while a stronger figure could reinforce the view that the economy can handle higher borrowing costs. Consumer spending drives the bulk of U.S. economic activity, making this data a key precursor to the Fed’s decision.

    The Federal Reserve will announce its rate decision Wednesday after a two-day meeting. Rate futures indicate roughly a one-in-three chance of a quarter-point increase, though most economists expect the central bank to hold the federal funds rate at 3.50% to 3.75%. Markets will scrutinize Chairman Kevin Warsh’s remarks for hints about September and any signs of policy division. A surprise hike would likely lift short-term yields and the dollar while pressuring rate-sensitive equities. Even a hold could spark volatility if the statement signals another increase is imminent. Investors will also watch the number of dissenting officials.

    PCE and GDP Data Drop on Thursday

    Thursday brings a double dose of economic data: the advance estimate for second-quarter GDP and the June personal income and outlays report, which includes the Personal Consumption Expenditures (PCE) price index—the Fed’s preferred inflation gauge. Both releases are scheduled for 8:30 a.m. Eastern Time.

    GDP data will reveal whether consumer demand and business investment sustained economic growth during the quarter. Forecasts generally point to annualized growth above 2%, though estimates vary. A stronger reading could buoy risk assets but may also strengthen the case for tighter policy if inflation remains elevated. The PCE figures may carry more weight for rate expectations. Softer monthly and annual readings would support the view that price pressures are easing, while firm core inflation could reignite concerns about the need for another rate increase. The worst-case scenario for markets would be weak GDP combined with stubborn inflation.

    Big Tech Earnings Add Pressure

    Microsoft and Meta report after Wednesday’s closing bell. Microsoft investors will focus on Azure growth, AI demand, and capital spending. Meta’s report will draw attention to advertising revenue, user activity, and the cost of expanding its AI infrastructure. Both companies have the power to influence broader tech valuations.

    Apple and Amazon follow after Thursday’s close. Apple’s iPhone demand, services sales, and AI plans will shape expectations for its next quarter. Amazon Web Services growth will indicate the pace of corporate cloud spending, while retail margins and delivery costs will impact Amazon’s broader results. Together, these four companies represent a significant portion of the S&P 500, and their guidance could move index futures even if headline earnings beat forecasts.

    Weekend Sentiment Check

    Friday’s final University of Michigan sentiment reading closes the seven-event stretch. Inflation expectations will be closely watched to see if the preliminary July improvement survived later changes in fuel prices, financial markets, and household views nationwide.

  • Bitcoin Hovers Near $63,500 as Fed Decision Approaches, Key Support Levels Hold

    Bitcoin Hovers Near $63,500 as Fed Decision Approaches, Key Support Levels Hold

    Bitcoin Price Action and Key Levels

    Bitcoin traded near $63,500 on July 28 after a sharp decline during the early hours. The largest cryptocurrency slipped from nearly $64,900 to around $63,200 in a short period. Strong selling pressure pushed prices lower, while high trading volume confirmed active market participation. Later, buyers stepped in near the lower range and helped Bitcoin recover part of the loss. The price settled close to $63,497, indicating that both buyers and sellers remained active near current levels.

    The latest market data showed a daily decline of approximately 2.7% to 3%. Bitcoin moved inside a 24-hour range of roughly $63,000 to $65,650. The digital asset held a market capitalization near $1.27 trillion, while daily trading volume reached almost $27 billion. These figures reflect healthy market activity even after the sharp move lower.

    Technical Indicators Show Signs of Recovery

    The five-minute chart displayed three clear phases throughout the session. The first phase brought a strong decline that erased earlier gains. Large red candles and rising trading volume highlighted firm selling pressure across the market. Bitcoin then entered a second phase where the price moved inside a narrow range around $63,100 to $63,300. This section showed that selling pressure started to slow as buyers entered the market. The final phase brought a gradual recovery. Bitcoin created higher lows and climbed above the middle Bollinger Band, which traders often watch as a short-term trend indicator. The rebound reached the upper Bollinger Band, although fresh buying strength slowed near that level. The overall structure pointed toward a short-term recovery inside a wider corrective move rather than a complete trend reversal.

    Bollinger Bands Suggest Fresh Volatility Ahead

    The Bollinger Bands offered another important signal. Bitcoin traded between the middle band and the upper band after the recovery. The distance between the bands narrowed compared with the sharp move earlier in the session. This pattern often reflects lower volatility after a large price swing. A narrow band setup usually comes before another notable move. A strong push above the upper band could attract fresh buyers and support another advance. On the other hand, failure near current levels could invite sellers back into the market and place pressure on nearby support zones.

    RSI Shows Balanced Market Momentum

    The Relative Strength Index (RSI) recovered well after the earlier decline. The indicator stood near 56, while its moving average remained close to 61. These values showed that market momentum improved after the morning sell-off. The RSI stayed above the neutral level of 50, which suggested that buyers regained some control. At the same time, the indicator stayed below stronger bullish territory, which left room for either side to influence the next move. The chart also showed no clear bearish divergence, reducing immediate concern about fading upward momentum.

    Key Price Levels to Watch

    Support first lies at $63,450, followed by $63,300 and $63,050. A significant intraday support area is positioned between $62,950 and $63,000. A close above this level may continue enhancing buyers’ positive sentiment. Resistance is visible above $63,600 and $63,750. A major hurdle exists around $64,000, followed by $64,250. A positive move above the $64,000 mark could strengthen market sentiment.

    Market Focus Turns Toward Major Economic Events

    Financial markets are currently monitoring the impending Federal Reserve policy meeting, which may impact risk assets worldwide. Traders anticipate new information regarding interest rates and future monetary policy, and a surprise from the central bank may induce significant price fluctuations in Bitcoin and other digital currencies. Recent statistics have pointed toward improved investments in Bitcoin exchange-traded funds after a lackluster first half of 2026. There has been some uptick in institutional interest, although institutional investors remain cautious when it comes to opening positions.

    Another significant move has been made by Strategy (formerly MicroStrategy). The company suspended making new Bitcoin acquisitions for the third week in a row and instead focused on managing capital and repurchasing stock. Market participants continue to pay attention to corporate buying dynamics, as major acquisitions tend to increase the attractiveness of investing.

    Outlook Remains Cautiously Positive

    Bitcoin is beginning to establish a new phase of stability following its steep drop and gradual recovery. The buy side showed the strength necessary to establish some important support levels, while momentum indicators appear to be changing positively. Markets await a strong enough signal to resume trend activity. Successful testing at the $63,450 level could open a pathway toward $63,700, $64,000, and $64,300. If the price drops below that support area, the focus will shift toward $63,300, $63,050, and the zone between $62,950 and $63,000. At this point, prices show a balanced market with both sides vying for control.

    FAQs

    What is Bitcoin’s current price?
    Bitcoin trades near $63,500, with the latest chart showing a price around $63,497.
    Why did Bitcoin fall today?
    Strong selling pressure triggered a sharp decline, while traders also remained cautious ahead of key economic developments.
    What are the important support levels for Bitcoin?
    The main support levels stand at $63,450, $63,300, $63,050, and the $62,950–$63,000 zone.
    Which resistance levels should traders watch?
    Important resistance levels include $63,600, $63,750, $64,000, and $64,250.
    What could influence Bitcoin’s next move?
    Federal Reserve policy announcements, institutional investment trends, ETF flows, and broader market sentiment could shape Bitcoin’s short-term direction.