Tag: Investment

  • Top Fintech Stocks to Watch in July 2026: Global and Indian Picks for Digital Payments and Lending

    Top Fintech Stocks to Watch in July 2026: Global and Indian Picks for Digital Payments and Lending

    The fintech sector continues to surge, offering investors a mix of high-growth opportunities and varied risk profiles. From global payments leaders to Indian digital-finance champions, these seven stocks provide exposure to digital payments, lending, cross-border finance, and financial technology innovation.

    PayPal (PYPL, US)

    PayPal stock trades at $56.08 with a market cap of $49.53 billion, a P/E ratio of 10.64, and a dividend yield of 0.74%. Growth drivers include rising digital payments, merchant services, and new products like cryptocurrency and buy now, pay later (BNPL). The stock is down 27.72% over the past year after peaking in 2025, with a 52-week range of $38.46 to $79.50.

    Risks: Intensifying competition (Visa, fintechs), margin pressure, regulatory scrutiny.
    Thesis: PayPal’s entrenched network and transition to AI-driven merchant tools and crypto features could revive growth, though near-term execution and macro uncertainty temper the outlook.

    Block, Inc. (SQ, US)

    Block trades at $77.15 with a market cap of $45.92 billion, a P/E of 63.33, and average daily volume of 4.9 million shares. Its 52-week range is $48.21 to $84.08. Key drivers are Cash App (payments, Bitcoin) and SMB payment terminals (Afterpay BNPL). Analysts give a Positive/Buy rating.

    Risks: High valuation, crypto volatility, consumer spending slowdown.
    Thesis: Block’s diversified fintech ecosystem (POS, digital bank products, crypto) drives strong revenue growth. Prudent reinvestment and expansion in developing markets and crypto can reward long-term holders despite short-term volatility.

    Adyen (ADYEY, Netherlands)

    Adyen’s market cap is $28.55 billion, stock at $9.01. The company powers payments for global merchants (Netflix, Shopify) and expands in Asia. FY25 net revenue grew 17%, but market cap dropped 50% YoY amid margin pressure. P/E is 23.7, and analysts rate it Buy on 30%+ long-term EPS growth.

    Risks: E-commerce slowdown, pricing competition, FX swings.
    Thesis: Adyen’s unified platform and global reach support above-market growth. Despite headwinds, its conservative profitability and digital commerce migration make it attractive.

    Wise plc (WISE, UK)

    Wise market cap is £9.28 billion, FY25 revenue £1.212 billion, profit before tax £565 million. It has 10 million+ users for low-cost cross-border transfers and multi-currency accounts. P/E is 24.8. Analysts rate it Buy.

    Risks: FX risk, competition from banks and fintechs, economic downturn cutting remittances.
    Thesis: Wise dominates peer-to-peer currency transfers with a trusted brand and asset-light model. As cross-border payments grow, Wise should deliver steady profit growth.

    One97 Communications (PAYTM, India)

    Market cap: Rs. 82,213 crore ($9.8 billion), FY25 revenue Rs. 6,494 crore (+5.7% YoY). Turned profitable in FY26 (est. profit $5.4 billion). Paytm’s digital payments, financial services (UPI, wealth, lending), and commerce platforms fuel India growth. Q1 FY26 revenue rose 28% YoY to Rs. 2,410 crore. Analysts raised target to Rs. 1,476.

    Risks: Regulatory changes, intense competition (Google Pay, banks), profitability execution.
    Thesis: India’s leading fintech super-app with immense scale. Government push for digital finance and expansion into banking/loans should drive outsized growth. Suits high-growth, India-focused investors.

    Bajaj Finance (BAJFINANCE, India)

    Market cap: Rs. 6,30,565 crore, FY25 net profit Rs. 16,779 crore, AUM Rs. 4.17 lakh crore. Bajaj Finance offers consumer loans, BNPL, insurance, and app-based lending. Stock up 10% in one year, near fair value per analysts. P/E is 32.6.

    Risks: Rising credit defaults (auto, MSME loans), higher borrowing costs, regulatory lending limits.
    Thesis: Blends fintech innovation (BFL app) with prudent risk management. Should deliver 20%+ annual growth, strong franchise and capital make it a core long-term holding in India.

    MercadoLibre (MELI, Argentina/US)

    Market cap: $91.2 billion, FY25 net revenues over $30 billion (Q126: $8.8 billion, +49% YoY). Net income $1.99 billion (2025 estimate). Dominates Latin American e-commerce and fintech (MercadoPago payments, credit). Trades at 46x earnings. Analysts: Moderate Buy.

    Risks: Latin America economic instability, high valuation, rising competition.
    Thesis: With 600M+ addressable users and increasing fintech penetration, MercadoLibre is uniquely positioned. Diversified model (commerce + fintech) should generate strong double-digit growth. High-risk, high-reward.

    Frequently Asked Questions

    1. Which fintech stocks are included in this July 2026 list? The seven companies are PayPal, Block, Adyen, Wise, MercadoLibre, One97 Communications (Paytm), and Bajaj Finance.
    2. Which stock may suit value-focused fintech investors? PayPal’s P/E of 10.64 is considerably lower than peers, though its valuation reflects competition and margin concerns.
    3. Which two Indian fintech stocks are covered? One97 Communications (Paytm) and Bajaj Finance — the former high-growth digital ecosystem, the latter established consumer lending.
    4. Which stock carries the highest growth and valuation risk? Block and MercadoLibre, due to valuation and execution risks, crypto volatility, consumer spending, and economic instability.
    5. Are fintech stocks suitable for conservative investors? Fintech can be volatile. Conservative investors may prefer Bajaj Finance or PayPal over speculative high-growth names.

    Disclaimer: This article is for informational purposes only and does not constitute investment advice. Always conduct your own research before investing.

  • Why Massive AI Spending Is Rattling Wall Street

    Why Massive AI Spending Is Rattling Wall Street

    Artificial intelligence is reshaping industries, but the enormous investments required are creating a wave of anxiety on Wall Street. As tech giants pour billions into AI infrastructure, talent, and compliance, investors are questioning whether the returns will ever justify the costs.

    The Infrastructure Boom

    Companies are spending staggering sums on AI chips, cloud servers, and massive data centers. This infrastructure buildout is essential for training and deploying advanced models, but it also locks firms into long-term capital commitments that may not pay off for years.

    Profit Pressure Mounts

    Investors are increasingly worried about whether AI investments will generate sufficient returns. The gap between spending and revenue is widening, and any hint of disappointing earnings triggers sharp market reactions. Wall Street’s patience is wearing thin.

    Rising Competition and Talent Costs

    Big Tech firms are locked in an arms race, escalating AI spending to stay ahead. At the same time, hiring top AI engineers and researchers has become prohibitively expensive, further squeezing margins. The talent war shows no signs of cooling.

    Regulatory and Monetization Hurdles

    Compliance with emerging AI governance frameworks adds billions to operational expenses. Meanwhile, many companies still struggle to convert AI capabilities into sustainable profits. Monetization challenges remain a critical weak point in the AI business case.

    Market Volatility and Long-Term Opportunity

    Wall Street reacts swiftly whenever AI earnings fall short of expectations, creating volatility. Yet despite these risks, AI remains one of the most significant investment opportunities of the decade. The key will be balancing bold spending with realistic milestones and clear paths to profitability.

    As the AI revolution accelerates, the tension between massive outlays and financial discipline will continue to shape market sentiment. The companies that navigate this delicate balance may emerge as the leaders of the next economic era.

  • Top Layer-1 Blockchain Coins to Watch in July 2026: Bitcoin, Ethereum, Solana, and More

    Top Layer-1 Blockchain Coins to Watch in July 2026: Bitcoin, Ethereum, Solana, and More

    Layer-1 blockchains are the backbone of the cryptocurrency ecosystem, enabling transactions, smart contracts, decentralized applications, and more. In July 2026, these foundational networks continue to attract significant investor attention. Here’s a look at the most promising Layer-1 coins to consider for your portfolio.

    Key Takeaways

    • Bitcoin remains the safest and most trusted Layer-1 cryptocurrency.
    • Ethereum leads the smart contract and decentralized application market.
    • Solana, Sui, and Hyperliquid offer higher growth potential with greater risk.

    Bitcoin (BTC) – The Gold Standard

    Bitcoin, currently trading at $63,056, is widely regarded as digital gold. Its limited supply and institutional adoption through ETFs make it a cornerstone of any crypto portfolio. While its growth may be slower than smaller coins, it remains the most secure choice for long-term investors.

    Ethereum (ETH) – Smart Contract Leader

    Ethereum, priced at $1,785, is the largest smart contract platform, hosting thousands of dApps, NFTs, and DeFi projects. Its robust community, staking rewards, and improved scalability keep it among the top Layer-1 investments for 2026.

    BNB and Solana – Strong Ecosystem Growth

    BNB ($570) powers one of the most extensive blockchain ecosystems, used for trading, payments, and DeFi. Solana ($76.6) is renowned for its high-speed, low-cost transactions, attracting developers in gaming and finance. Both networks continue to expand their user bases.

    TRON and Hyperliquid – Rising Stars

    TRON ($0.32) has become a key network for stablecoin transfers, handling billions daily. Hyperliquid ($60) is a newer Layer-1 focused on decentralized trading, gaining traction among traders despite higher risk.

    Cardano, Avalanche, Sui, and Aptos – Diverse Options

    Cardano ($0.16) emphasizes research-backed development and staking rewards. Avalanche ($20-25) allows custom blockchain creation, attracting enterprise users. Sui and Aptos, both modern Layer-1s, are growing rapidly with DeFi ecosystems, though they carry higher risk due to smaller market caps.

    Investment Strategy

    A balanced portfolio might include 35% Bitcoin, 25% Ethereum, 15% Solana, 10% BNB, 5% Avalanche, 5% Sui, and 5% Hyperliquid. For lower risk, stick with Bitcoin and Ethereum. For higher potential returns, consider Solana, Hyperliquid, and Sui.

    FAQs

    1. What is a Layer-1 blockchain?

    A Layer-1 blockchain is the main network that processes transactions and supports apps, smart contracts, and other blockchain services.

    2. Which Layer-1 coin is the safest to invest in?

    Bitcoin is widely considered the safest Layer-1 cryptocurrency because of its strong security and global adoption.

    3. Why is Ethereum still popular?

    Ethereum has the largest smart contract ecosystem and supports thousands of decentralized apps and crypto projects.

    4. Which Layer-1 coins have high growth potential?

    Solana, Sui, Hyperliquid, Avalanche, and Aptos are popular choices for investors seeking higher growth opportunities.

    5. Should beginners invest only in one Layer-1 coin?

    Many investors prefer a mix of Layer-1 coins to reduce risk and increase long-term growth potential.

    Disclaimer: This article is for informational purposes only and does not constitute financial advice. Cryptocurrency investments carry risk; always do your own research before investing.

  • Key Railway Stocks to Monitor for Investment Opportunities

    Key Railway Stocks to Monitor for Investment Opportunities

    The railway sector continues to attract investor attention, driven by government infrastructure spending and strong operational performance from key players. Below is a curated list of railway-linked stocks that are worth watching in the current market environment.

    Indian Railway Finance Corporation (IRFC)

    IRFC finances the expansion projects of Indian Railways. As a preferred public sector undertaking (PSU) stock, it benefits from consistent earnings and strong government backing, making it a stable choice for long-term investors.

    Rail Vikas Nigam Limited (RVNL)

    RVNL executes railway infrastructure projects across India. The company enjoys a robust order book and continues to benefit from sustained government capital expenditure on rail development.

    Indian Railway Catering and Tourism Corporation (IRCTC)

    IRCTC operates ticketing, catering, and tourism services. It is one of India’s most recognized railway-linked listed companies, with a strong brand and diversified revenue streams.

    IRCON International

    IRCON specializes in railway engineering and infrastructure projects. With both domestic and international contracts, the company supports long-term business growth and offers exposure to global railway markets.

    RailTel Corporation of India

    RailTel provides telecom and digital infrastructure for Indian Railways. It is expanding its services across government and enterprise sectors nationwide, positioning itself as a key player in digital connectivity.

    Texmaco Rail & Engineering

    Texmaco manufactures freight wagons and railway equipment. Increasing demand for rolling stock and logistics infrastructure development supports its growth trajectory.

    Jupiter Wagons

    Jupiter Wagons produces railway wagons, braking systems, and mobility solutions. Rising freight transportation and manufacturing expansion are key drivers for the company.

    Titagarh Rail Systems

    Titagarh builds passenger coaches, metro trains, and freight wagons. It is expanding its presence in both domestic and international railway markets, offering diversified exposure.

    BEML

    BEML manufactures metro coaches, rail equipment, and defence vehicles. As a diversified engineering company with railway sector exposure, it provides a unique investment angle.

    These stocks represent a cross-section of India’s railway ecosystem, from financing and infrastructure to rolling stock and digital services. Investors should conduct their own research before making decisions.

  • Alphabet Reveals $94.1 Billion SpaceX Stake Under Full Trading Lock-Up

    Alphabet Reveals $94.1 Billion SpaceX Stake Under Full Trading Lock-Up

    Alphabet has disclosed that its SpaceX investment was valued at approximately $94.1 billion at the end of the second quarter. This holding makes the Google parent one of SpaceX’s largest outside shareholders.

    The disclosure follows SpaceX’s listing on NASDAQ in June. The filing explains how market gains boosted Alphabet’s reported profit without adding cash to its accounts. Currently, Alphabet cannot sell any part of the position because all shares remain under short-term or long-term trading restrictions.

    Alphabet’s SpaceX Stake Reaches $94.1 Billion

    Alphabet’s quarterly filing shows that about $80 billion of SpaceX shares carry short-term restrictions on the ability to sell. Another $14.1 billion remains restricted through the third quarter of 2027. Together, these two groups cover the full reported position.

    The investment dates back to January 2015, when Google and Fidelity invested a combined $1 billion in SpaceX, receiving a stake of just under 10% at the time. Later funding rounds and SpaceX’s public offering reduced Alphabet’s ownership percentage through dilution.

    The filing provides the stake’s dollar value but does not disclose an ownership percentage. Published estimates range from about 4% to 6%, based on valuation and share-count methods. SpaceX stock has since fallen below its $135 IPO price, so Alphabet’s position is now worth less than its reported June 30 value.

    Unrealized Gain Boosts Alphabet’s Quarterly Profit

    Alphabet recorded a $99 billion gain on equity securities during the quarter. The company stated that the increase mainly came from unrealized gains tied to SpaceX and another private company investment, which media reports have identified as AI developer Anthropic.

    Alphabet’s net income rose to $112.1 billion, with earnings reaching $9.11 per share. Revenue increased 24% from a year earlier to $119.8 billion. Google Cloud revenue rose 82% to $24.8 billion during the same period.

    However, the equity gain did not provide cash for Alphabet’s daily operations or investment plans. The company adjusted the value of the holdings on its balance sheet without selling the shares. Future price changes can raise or lower the reported value.

    Meanwhile, Alphabet reported negative free cash flow of $5.9 billion. It also raised its 2026 capital spending forecast to between $195 billion and $205 billion, mainly to support data centers, servers, networking equipment, and other AI infrastructure.

    SpaceX Lock-Up Releases Start in August

    SpaceX priced its initial public offering at $135 per share and began trading under the SPCX ticker on June 12. The company later confirmed that the offering raised about $85.7 billion after underwriters exercised their option for additional shares.

    SpaceX plans to publish its first quarterly results as a public company after the market closes on August 4. Its lock-up schedule starts releasing some restricted shares on August 6, two full trading days after the earnings report.

    Alphabet has not announced plans to sell its shares when the first restrictions expire. A separate $14.1 billion group will stay restricted through September 2027, limiting how much of the position Alphabet can convert into cash. SpaceX shares recently traded near $112, below both the IPO price and their June peak.

    This decline lowers the market value of Alphabet’s holding. Later quarterly filings will record changes based on SpaceX’s share price and any shares that Alphabet sells after the restrictions end.

  • HDFC Bank Dips to Rs 766.35: Why Analysts Stay Bullish on Long-Term Growth

    HDFC Bank Dips to Rs 766.35: Why Analysts Stay Bullish on Long-Term Growth

    HDFC Bank shares slipped to Rs. 766.35 for a second consecutive session, as earnings concerns weighed on market sentiment. Despite the correction, analysts remain optimistic, citing the bank’s strong fundamentals, healthy asset quality, and long-term growth prospects.

    Stock Under Pressure Despite Positive Street View

    HDFC Bank continued to drag the Nifty amid further profit-taking after the bank announced its latest quarterly results. Despite the current underperformance, various domestic and international brokerage firms have reaffirmed their confidence in the bank’s long-term potential. The stock opened at Rs. 769.15, reached a high of Rs. 772.50, and fell to a low of Rs. 765.20. High trade volumes indicate involvement from both institutions and individual investors.

    Market observers believe the current weakness is more due to profit-taking from earnings fears than any fundamental deterioration in the bank’s business.

    Chart Signals Weakness, But Key Support Holds

    Technical indicators suggest HDFC Bank continues to trade under selling pressure after failing to sustain its recovery above the Rs. 820 mark earlier this month. The stock has been making lower highs on the daily chart, indicating that bears remain in control in the short term.

    However, the Rs. 760 zone is emerging as an important support level. A decisive breach below this could trigger fresh selling, while a move back above Rs. 800–820 may improve sentiment and pave the way for a stronger recovery.

    Why Brokerages Remain Positive

    Despite the ongoing correction, analysts continue to favor HDFC Bank owing to its strong franchise, healthy balance sheet, and leadership in retail banking. The bank is expected to benefit from steady credit demand, improving deposit mobilization, and its ability to maintain stable asset quality.

    Brokerages also believe that integration-related challenges following the HDFC Ltd merger are gradually easing, allowing the lender to focus on improving profitability and business growth over the coming quarters. While earnings growth may remain moderate in the near term, most analysts see meaningful upside over the longer horizon.

    Opportunities and Risks

    While the recent correction has weighed on investor sentiment, analysts continue to highlight HDFC Bank’s structural strengths that support its long-term growth story. Key factors include strong franchise value, robust capital position, and a diversified loan portfolio.

    What Investors Should Watch Next

    The next few trading sessions are likely to determine whether HDFC Bank can stabilize near current levels or witness another leg of correction. Investors will closely monitor management commentary, loan growth, deposit mobilization, and margin trends for fresh direction.

    From a trading perspective, sustained buying above Rs. 800 could improve momentum, while a break below Rs. 760 may invite additional selling pressure. Long-term investors, however, continue to focus on the bank’s earnings potential rather than short-term market fluctuations.

    Conclusion

    The decline in HDFC Bank to Rs. 766.35 appears to reflect a more cautious mood among investors after the recent earnings season, rather than a significant change in the bank’s business outlook. Even with near-term pressures like margin compression and profit booking, many analysts believe the lender’s long-term growth narrative remains intact.

    Meanwhile, the broader banking sector shows a mixed picture. Some lenders like ICICI Bank have moved up after stronger-than-expected earnings, while stocks including HDFC Bank, Axis Bank, and Kotak Mahindra Bank face selling pressure. This has happened as traders reassess valuation levels and growth expectations. Still, the Indian banking segment continues to draw support from steady credit demand, improving asset quality, and solid capital buffers. Market experts generally view this correction as stock-specific and earnings-driven, not a sign of fragility across the entire banking space. Banks with strong fundamentals are expected to continue benefiting as India’s long-term economic growth continues.

    FAQs

    1. Why did HDFC Bank shares fall for the second consecutive session? HDFC Bank shares declined due to profit booking, earnings concerns, margin pressures, and cautious investor sentiment despite positive long-term brokerage outlooks.
    2. What is HDFC Bank’s current share price? HDFC Bank shares traded around Rs. 766.35 during Tuesday’s session, making it one of the biggest losers on the Nifty index.
    3. Are analysts still bullish on HDFC Bank stock? Yes. Most brokerages remain optimistic, citing strong fundamentals, healthy asset quality, robust capital position, and long-term earnings growth potential.
    4. What levels should investors watch in HDFC Bank shares? Analysts see support around Rs. 760, while sustained buying above Rs. 800–820 could improve near-term market sentiment and momentum.
    5. How are banking stocks performing overall? Banking stocks remain mixed, with earnings driving stock-specific moves, though strong fundamentals continue supporting the sector’s long-term growth outlook.
  • India’s AI Boom Propels Data Centres to Strategic National Infrastructure Status

    India’s AI Boom Propels Data Centres to Strategic National Infrastructure Status

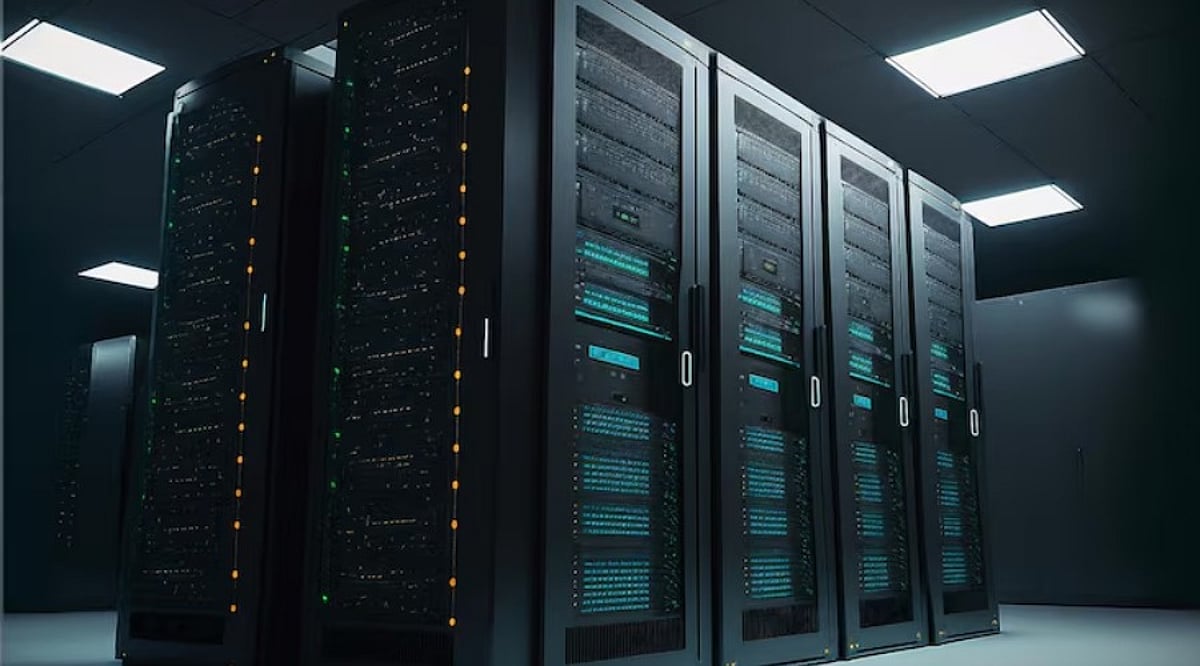
    India’s AI-driven digital transformation is rapidly elevating data centres from supporting infrastructure into a strategic national asset. With cumulative investment commitments exceeding $126 billion, strong government incentives, and surging demand from global hyperscalers, the sector is entering an unprecedented expansion phase.

    Global tech giants including Google, Microsoft, Amazon Web Services (AWS), and domestic operators like AdaniConneX and STT GDC India are aggressively building AI-ready facilities to meet soaring demand for cloud computing and AI workloads. However, long-term success will depend on overcoming significant challenges related to power supply, water usage, land availability, skilled talent, and project execution.

    Market Inflection Point

    According to a July 2026 KPMG report, India’s data centre sector stands at an inflection point where demand visibility, capital inflows, and technology shifts are aligning. The country’s total data centre capacity crossed 1,700 MW in 2025, with 440 MW added—a 160% jump from 2024. Projections indicate another 30% year-on-year growth in 2026, with approximately 500 MW of fresh supply expected. The market’s financial trajectory reflects this pace: IBEF projects the sector will reach $22 billion by 2030 at a 14-15% CAGR, while KPMG identifies a $46 billion opportunity in AI-optimised data centres alone by 2033, growing at a 35.1% CAGR.

    This growth is driven by three simultaneous forces: the explosion in AI workloads, accelerating enterprise cloud adoption, and India’s Digital Personal Data Protection Act, which restricts cross-border data transfers and effectively requires global companies to build physical infrastructure inside the country.

    Hyperscaler Commitments at Unprecedented Scale

    The scale of hyperscaler commitments to India in the past eighteen months is without precedent. Google announced a $15 billion investment in AI data centres in Andhra Pradesh in October 2025. Microsoft followed with a $17.5 billion commitment through 2030, building on an earlier $3 billion program. Amazon Web Services has pledged $35 billion by 2030. Domestically, AdaniConneX has announced $100 billion in renewable-powered hyperscale capacity through 2035, while STT GDC India was recently valued at close to $14 billion.

    India’s attractiveness rests on structural advantages: over 900 million internet users, average monthly wireless data consumption exceeding 25 GB per user, nearly 20% of global AI-related development activities, and software engineers available at roughly $20,000 per year—a fraction of costs in the US, Europe, or Singapore.

    Policy Shift: From Neutral to Active Enabler

    India’s regulatory environment has moved from passive observation to active facilitation. The Union Budget 2026-27 extended a 20-year tax holiday to eligible foreign cloud providers through 2047, along with 25-35% capital incentives for green technology adoption and a 15% safe harbor margin to reduce transfer pricing disputes. The draft National Data Center Policy, when finalized, is expected to streamline land, power, and environmental approvals—historically a primary bottleneck.

    Multiple states have introduced incentive frameworks: Telangana, Maharashtra, Andhra Pradesh, Tamil Nadu, and Uttar Pradesh are leading inflows, while tier-II cities including Ahmedabad, Visakhapatnam, Patna, and Bhopal are seeing growing developer interest driven by lower land costs and 5G rollout.

    The Execution Gap

    Despite momentum, a significant gap exists between announced and operational capacity. Less than 20% of announced capacity from roughly 30 large projects launched between March 2025 and April 2026—collectively adding around 3.5 GW—is currently live. Most large, multi-phase campuses have commissioning timelines extending to 2028 and beyond. Mumbai still accounts for over 50% of operational inventory, and with Chennai, Delhi-NCR, and Bengaluru, these four cities host nearly 90% of tier-I capacity. Hyderabad and Visakhapatnam together account for over 2 GW of planned AI-native capacity, but execution risk remains.

    Sustainability Constraints: Power and Water

    The most consequential constraints are physical. A 100 MW hyperscale facility requires approximately 2 million liters of water per day for cooling, yet 60-80% of Indian data centres face high water stress. Visakhapatnam district, where a 1 GW AI-native campus is planned, has the lowest groundwater availability for industrial use in Andhra Pradesh. On power, AI-ready facilities demand far higher density, often exceeding 50 kW per rack, straining local grid infrastructure. While India has surpassed 500 GW of total installed power capacity and renewables exceed 50% of generation in some periods, coal still supplies around 70% of actual generation. Operators like Nxtra and STT GDC India are already running at 60-63% renewable energy integration, but alignment between renewable capacity additions and data centre locations remains uneven.

    What Must Happen Next

    KPMG’s KG Purushothaman emphasized the need for integrated execution models combining engineering capability, AI readiness, regulatory understanding, and operational accountability. India needs to build delivery infrastructure: grid modernization, water-efficient and liquid-cooling technologies, specialized data centre workforce pipelines, and environmental frameworks that accommodate hyperscale facilities without depleting local resources.

    The workforce dimension is frequently underestimated. India has a world-leading IT workforce but not yet a world-class data centre operations workforce at the scale required. A modern hyperscale campus needs highly specialized mechanical and electrical engineers, HVAC and cooling plant operators, cybersecurity professionals, and power systems specialists—roles not produced in large numbers by current engineering education pipelines.

    The strategic parallel with India’s IT services industry is instructive. Data centres require a different asset base—land, power, water, fiber, and specialized operations—but the underlying logic of structural cost advantage and scale remains similar. Whether India captures 4-5% of global data centre capacity additions between 2026 and 2032, as CBRE projects, will depend less on capital availability and far more on whether physical, human, and regulatory infrastructure can be delivered fast enough to match the ambition.

    Why This Matters

    Artificial intelligence is dramatically increasing demand for computing power, cloud services, and high-performance data centres worldwide. As one of the world’s fastest-growing digital economies, India has an opportunity to become a major global AI infrastructure hub. However, investment announcements alone are not enough. Delivering hyperscale facilities requires reliable electricity, sustainable water management, high-speed connectivity, regulatory clarity, and a skilled workforce. Understanding these opportunities and constraints is essential for technology companies, cloud providers, policymakers, investors, and enterprises planning long-term digital infrastructure strategies.

  • Solar Stocks in India: Growth Drivers, US Tariff Impact, and Investment Risks in 2026

    Solar Stocks in India: Growth Drivers, US Tariff Impact, and Investment Risks in 2026

    India’s solar industry is growing faster than ever, but growth alone doesn’t tell the full story anymore. The sector added a record 44.61 GW of capacity in FY2026 and crossed 150 GW of installed capacity, cementing its place in the country’s clean energy shift. In the same year, the US imposed a 126% countervailing duty that disrupted exports and wiped billions off the market value of listed solar manufacturers.

    Solar stocks in India now sit at the intersection of opportunity and risk. Understanding how policy, trade, domestic demand, and execution fit together matters more now than just tracking capacity numbers.

    Why Solar Stocks in India are Entering a New Growth Phase

    The national target for 2030 remains the anchor for the whole sector, and hitting it requires roughly 50 GW of new solar installations every year, a pace India only just touched for the first time. Incentives such as the PLI scheme for high-efficiency modules and the newer mandate requiring locally made solar cells from June 2026 are built to sustain that pace. The harder constraint is capacity utilization. Indian module-making capacity has swelled to around 210 GW, far ahead of the 40–45 GW of annual domestic demand it needs to serve. That gap between built capacity and used capacity is quietly becoming a bigger swing factor for manufacturer earnings than the headline target itself.

    How US Tariffs are Reshaping the Future of Solar Stocks in India

    For years, the US absorbed nearly all of India’s solar exports, and PLI-backed manufacturers rode that demand. That changed in February 2026, when the US Department of Commerce imposed a preliminary 126% countervailing duty on Indian solar cells and modules, following complaints from American manufacturers over alleged subsidy benefits. Exports fell by roughly a third within weeks, and Waaree Energies, Premier Energies, and Vikram Solar all saw sharp single-day declines when the ruling landed. A final US ruling is expected later in 2026, and that date matters more to exporter stock prices than most quarterly earnings calls.

    Even so, the export slowdown is not the whole story. Utility-scale tenders, commercial rooftop adoption, and industrial clean energy procurement are expanding fast enough to absorb a growing share of that idle manufacturing capacity. Companies with diversified revenue across domestic and export markets are better placed to ride out trade disruption than pure exporters.

    Battery Storage and Hybrid Projects are Driving the Next Phase of Solar Growth

    The clearest forward-looking shift in the sector is the move from standalone solar to solar-plus-storage. In January 2026, the Solar Energy Corporation of India awarded 1.2 GW of solar paired with 3.6 GWh of battery storage under long-term power agreements. NTPC’s renewable arms followed up with hybrid solar projects in Uttar Pradesh and Rajasthan. Battery storage lets developers supply power during evening peak demand, not just when the sun is out. That improves project economics and cuts down on solar power going to waste. Meanwhile, more companies are signing long-term renewable power purchase agreements, and utilities are starting to use AI to forecast solar generation and manage the grid more precisely. Put together, these shifts are moving the industry away from just adding capacity and toward delivering power that’s reliable and efficient.

    Why Different Types of Solar Stocks in India Face Different Risks

    Generators such as Adani Green, NTPC Green, and Tata Power earn through long-term tariffs and are shielded from the export shock but exposed to discom payment delays and leveraged balance sheets. Manufacturers, including Waaree and Premier Energies, sit closest to the tariff risk and the overcapacity problem. EPC and ancillary players earn on execution margins tied to the capex cycle rather than on export markets. Treating all three as interchangeable is where most retail analysis of the sector goes wrong. Business model differences also explain why investors should not value every solar company the same way.

    Are Solar Stocks in India Still Worth Their Premium Valuations?

    Several listed solar and renewable names still trade at earnings multiples well above global peers, some in triple-digit numbers, a premium built on an uninterrupted growth story. With export markets now constrained, that multiple looks harder to justify without a matching improvement in cash flow visibility. Balance sheet strength, order book quality, execution capability, and exposure to export markets are becoming the key factors separating long-term winners from short-term momentum stocks.

    Final Thoughts

    India’s solar sector has entered a more demanding phase of growth. The companies that lead from here will not necessarily be those announcing the largest project pipelines but those that consistently convert policy support, disciplined execution, and operational efficiency into sustainable earnings and resilient cash flows.

    Disclaimer: Analytics Insight does not provide financial advice or guidance on cryptocurrencies and stocks. This article is provided for informational purposes and does not constitute investment advice. You are responsible for conducting your own research before making any investments.

  • ImVivo Review: A Deep Dive into the Technology-First Multi-Asset Trading Platform

    ImVivo Review: A Deep Dive into the Technology-First Multi-Asset Trading Platform

    Most platform reviews lead with adjectives. A more useful ImVivo review starts with a harder question: when you strip away the framing, does the technology, the security, and the structure actually stand up? ImVivo describes itself as a home for informed, structured multi-asset trading, and for an analytics-minded reader, the framing only matters if the engineering underneath earns it. What follows works through the stack, the trust signals, and the way the platform is organized.

    Reading the Technology, Not the Tagline

    The engine here is branded “The Edge,” and it is where live pricing, charting, technical indicators, and configurable dashboards converge into one workspace. The number of features isn’t the thing to fixate on. The sharper test is how efficiently a platform turns a noisy stream of market data into a picture a person can act on. On that measure, ImVivo reads as competent rather than gimmicky.

    Reporting is where that shows. Rather than leaving users to assemble their own summaries, the platform produces rolling portfolio breakdowns and performance analytics, with adaptive models tightening the output as conditions change. For a reader who cares about method, that adaptive layer is more interesting than any static indicator, because it means the analysis keeps responding to the market rather than sitting still.

    Orders clear on low-latency infrastructure, and the interface stays coherent across laptop, tablet, and phone—so nothing breaks when a session moves from desk to pocket. None of these pieces is rare in isolation. The part worth noting is the integration, with data, analysis, and reporting living together instead of being welded from separate tools. As individual participation in markets keeps climbing, that consolidation has moved from a nicety to something users simply expect.

    Where Legitimacy Is Won

    For a discerning audience, an honest ImVivo review lives or dies on the trust signals, because that is the part marketing cannot fake for long. On paper, the stack is solid: 256-bit encryption, two-factor authentication, and cold storage, with ongoing monitoring and tightened transaction controls sitting underneath. These are not exotic selling points—they are the defaults a serious operator is expected to build in. The reassuring thing is that ImVivo presents them as defaults rather than dressing them up as innovations. The tiered account model and the steady reporting cadence add a second kind of credibility: transparency. Users can see exactly where they stand rather than being asked to trust a sealed box.

    Structure That Signals Intent

    The asset menu is genuinely wide. Digital assets sit in the same environment as currencies, commodities, public companies, market benchmarks, and store-of-value holdings, which lets a user read several markets side by side rather than in scattered fragments across apps. The account ladder climbs from Bronze to VIP, with education, analyst contact, and monitoring deepening at each step. Help is reachable through several channels, and the deliberate pairing of human guidance with the technology is one of the platform’s more telling design decisions. For readers who treat structure and support as evidence of intent, that combination says as much about seriousness as any single tool on the dashboard.

    Funding sits alongside all of this, and for a legitimacy-minded reader, it is the quiet part that matters most. Deposits and withdrawals are laid out as a defined, repeatable process, and a platform that makes retrieving money as clear as depositing it earns a kind of trust no feature list can substitute for.

    The Verdict

    Weighed on its engineering rather than its language, ImVivo reads as a professional, technology-forward multi-asset platform—not a thin skin stretched over a price chart. The real-time data layer, the security posture, and the tiered structure all point to something designed for users who prize order over noise. The caveats are honest ones: the entry tiers can feel light until you build up, and the fullest conditions live higher on the ladder. Even so, this ImVivo review lands on a favorable read: an environment that holds up to scrutiny rather than one that only sounds good in a pitch deck.

  • BlockDAG’s 95x Opportunity Nears Its End as XRP Holds Strong and Aster Struggles to Recover

    BlockDAG’s 95x Opportunity Nears Its End as XRP Holds Strong and Aster Struggles to Recover

    The cryptocurrency market is caught in a tug-of-war this week, with buyers and sellers competing for control. XRP shows cautious strength near $1.107, while Aster crypto struggles to defend the $0.620 support level. Meanwhile, BlockDAG is surging ahead with a potential 95x return opportunity that is closing in just hours.

    XRP Price Prediction: Bulls Target Key Breakout

    XRP is trading around $1.107 after bouncing off the key $1.070-$1.078 support zone. Bulls are now aiming to break and hold above $1.12, which could pave the way for a move toward $1.184. On-chain data reveals whale wallets accumulated approximately 70 million XRP between July 11 and July 15, while Binance’s XRP reserves have dropped to about 2.61 billion tokens—their lowest level since February 2026. Fewer coins on exchanges may reduce near-term selling pressure. However, the RSI at 48.57 indicates only gradual momentum improvement, with mixed technical signals. The XRP price prediction hinges on whether buyers can turn $1.12 into solid support.

    Aster Price Update: Buyers Defend $0.620

    Aster crypto is trading around $0.627, down about 0.86% over the past 24 hours amid broader market pressure. Buyers continue to defend the $0.620 support level, but the token has struggled to break above the $0.630–$0.640 resistance zone. The RSI stands at 46.86, showing neither buyers nor sellers have gained full control, while the MACD points to weak momentum. Trading volume increased to $58.88 million, reflecting active market interest, but buying pressure has not been strong enough to drive prices higher. A break above $0.640 could improve sentiment, while a drop below $0.620 may trigger further short-term losses.

    BlockDAG: Final Hours to Secure 95x ROI

    BlockDAG’s ecosystem is accelerating on multiple fronts. The X1 mobile mining app, already used by over 4 million people, just received an upgrade for a smoother user experience. BDAG AI has officially launched, bringing artificial intelligence tools into the network and contributing to a $500 million jump in valuation. Additionally, the BlockDAGX exchange is set to open within days, offering spot trading, futures trading, and dedicated apps for Apple and Google Play.

    What makes this opportunity stand out is that the entry price remains at a strikingly low $0.00000033, while the buyback rate is set at $0.03, working out to a potential 95x return. This has placed BlockDAG at the forefront of the best crypto to buy conversation. The project’s casino has already attracted over 13,000 users and processed wagers exceeding $150 million in a single month, showcasing strong adoption. With the chance to sell at $0.03 ending in just hours, anyone looking to maximize returns needs to act now.

    Which Is the Best Crypto to Buy Today?

    The XRP price prediction depends on whether $1.12 can flip into solid support, potentially opening the path toward $1.184. Aster crypto needs a clean break above $0.640 to shift sentiment, while a slip below $0.620 could send it lower. Both tokens remain caught between cautious buyers and hesitant sellers. BlockDAG, however, is not waiting for confirmation. With a $500 million valuation jump, an incoming exchange, and a casino processing $150 million in monthly wagers, the project is stacking real traction. The $0.03 buyback unlocking a potential 95x ROI—with only a few hours left—makes BlockDAG the clearest pick for the best crypto to buy in 2026.

    Disclaimer: This article is for informational purposes only and does not constitute investment advice. Always conduct your own research before making any investments.