Tag: Market Trends

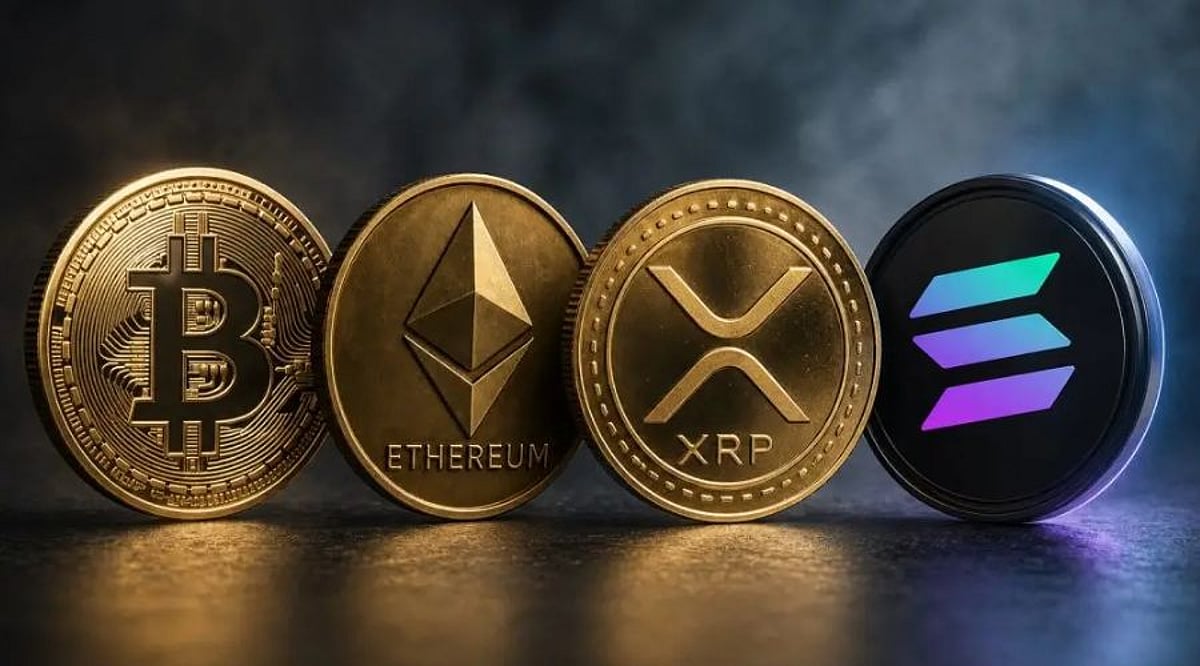
  • Bitcoin, Ethereum, Solana, and XRP Face Crucial Resistance Tests as September Ends

    Bitcoin, Ethereum, Solana, and XRP Face Crucial Resistance Tests as September Ends

    The cryptocurrency market is heading into the final days of September with several major assets facing pivotal resistance tests. Analysts have set ambitious price targets for Bitcoin (BTC), Ethereum (ETH), Solana (SOL), and XRP, with each needing to clear nearby technical hurdles to reach new highs. The upcoming U.S. inflation report on September 30 could also play a decisive role in shaping market direction.

    Overall crypto market capitalization has risen from roughly $2.62 trillion on September 1 to $2.87 trillion, reflecting a broad rally. Bitcoin recently traded near $84,900, up about 0.9% over 24 hours, while the total market gain sets the stage for a potentially strong month-end finish.

    Bitcoin Eyes $87,000 After Reclaiming $85,000

    Bitcoin has gained approximately 7.4% in September. Analyst Philakone noted that the price remains above its 50-day and 200-day simple moving averages, with resistance identified at $87,385. Martini Guy highlighted $85,000 as an earlier level that Bitcoin needed to reclaim before approaching $87,000. U.S. spot Bitcoin ETFs attracted about $2.39 billion in net inflows during the week ending September 25, signaling strong demand. In the near term, traders are watching resistance around $85,900 to $86,000. A move below $84,000 could shift focus to the $82,000–$83,500 area.

    Ethereum Must Clear $2,800 to Target $2,900

    Ethereum has risen about 9.3% this month. Analyst Alex Marzell pointed to $2,900 as a possible destination due to concentrated trading interest near that level. Daan Crypto identified $2,800 as the nearer obstacle; a move through it would open a clearer path to higher levels. Ethereum was near $2,700 in recent pricing, leaving it below both targets. Traders will look for a sustained push above $2,800 before judging whether the $2,900 target is achievable.

    Solana Analysts Watch the $125–$130 Range

    Solana traded near $122 after a daily gain of about 1.2%. Alaoui Capital suggested that breaking out of a sideways trading pattern could carry SOL toward $130, citing demand from Solana investment funds. Analyst Apex Gotu identified $125 to $130 as the next key zone, with SOL needing to pass $125 before testing the upper end of that range.

    XRP Must Pass $1.61 to Test $1.70

    XRP has gained about 7.9% over the past month. Analyst Diana said the token recovered after an earlier rejection near $1.61. In her view, a break above that level could open a move toward $1.70, though the target remains conditional on clearing resistance. ETF inflows offer another measure of interest, but price action will ultimately determine whether buyers can sustain the recovery.

    The final trading days of September also bring a scheduled U.S. economic release on September 30: the Bureau of Economic Analysis will publish August personal income and outlays data, including the personal consumption expenditures price index. This inflation report could influence market sentiment and price action across the board.
  • BlockDAG Boosts USDT Buyback to $0.05: A Better Bet Than Avalanche and Worldcoin This Week

    BlockDAG Boosts USDT Buyback to $0.05: A Better Bet Than Avalanche and Worldcoin This Week

    In a week of contrasting moves across the crypto market, BlockDAG has captured attention with a bold 72-hour promotion that raises its USDT buyback price to $0.05 while slashing the direct BDAG entry price to $0.000000005. Over $12 million has already flowed into the project in just a few days, positioning it as one of the most searched cryptocurrencies this week.

    BlockDAG’s 72-Hour Maxx Mode: Lower Entry, Higher Buyback

    For a limited 72-hour window, BlockDAG has dropped the price of direct Legacy and New BDAG from $0.00000017 to $0.000000005 — effectively giving buyers roughly 34 times more coins for the same investment made just a day earlier. Simultaneously, the USDT Buyback Price has climbed from $0.03 to $0.05, a 67% increase applied after the compression rate is calculated on BDAG sent in. No promo code is required; holders simply purchase either BDAG type and send it into the buyback to lock in the higher rate.

    Cashouts on eligible allocations begin in November and will be processed in batches, providing a clear timeline rather than an open-ended promise. The mechanics remain simple: buy low, build allocation, and let the higher buyback price do the heavy lifting once compression is applied to the final balance.

    Avalanche (AVAX) Price Today: Strong Rally but Caution Warranted

    Avalanche (AVAX) has surged more than 37% over the past seven days, trading near $10.30. Institutional flows are driving much of the momentum: Securitize’s tokenized asset market on Avalanche exploded 628% to $770 million, and Paxos has added native AVAX custody to its Crypto Brokerage platform, opening the door to more regulated institutional demand. Ava Labs leadership has also highlighted that the New York Stock Exchange ran a year-long technical evaluation of Avalanche’s infrastructure, signaling traditional finance interest. However, a 37% weekly move already reflects significant good news, and rallies built on institutional headlines can cool quickly if early profit-taking begins.

    Worldcoin Price Slide Continues

    In stark contrast, the Worldcoin price has fallen more than 10% in a single day, trading near $0.41 — roughly 96% below its all-time high near $11.90. Worldcoin, co-founded by Sam Altman and Alex Blania, uses iris-scanning Orb devices to verify unique humans and issue World ID credentials. Adoption metrics remain steady, with nearly 18 million verified humans worldwide, but the token price continues to struggle to reflect that growth. Sharp single-day drops test the patience of holders waiting for identity adoption to translate into price action.

    The Final Verdict: Time-Sensitive Opportunity

    Between an AVAX chart running hot and a Worldcoin price sliding, the market remains unpredictable. BlockDAG’s 72-hour Buyback Maxx Mode window offers a unique, time-sensitive opportunity: lower entry, higher buyback, and a clear cashout timeline starting in November. With over $12 million already moved in, this stacked upgrade is why BlockDAG is drawing attention ahead of larger-cap assets.

    Presale: https://purchase.blockdag.network
    Website: https://blockdag.network
    Telegram: https://t.me/blockDAGnetworkOfficial
    Discord: https://discord.gg/Q7BxghMVyu

    Disclaimer: Analytics Insight does not provide financial advice or guidance on cryptocurrencies and stocks. Also note that the cryptocurrencies mentioned/listed on the website could potentially be risky, i.e., designed to induce you to invest financial resources that may be lost forever and not be recoverable once investments are made. This article is provided for informational purposes and does not constitute investment advice. You are responsible for conducting your own research (DYOR) before making any investments. Read more about the financial risks involved here.

  • Bitcoin Slumps Below $84,000 as Surging Bond Yields and Oil Prices Deepen Crypto Sell-Off

    Bitcoin Slumps Below $84,000 as Surging Bond Yields and Oil Prices Deepen Crypto Sell-Off

    Bitcoin and Altcoins Tumble Amid Rising Bond Yields and Oil Prices

    The cryptocurrency market experienced a sharp decline on Thursday as global bond yields surged and oil prices climbed, pressuring risk assets across the board. Bitcoin fell to approximately $83,830 after trading near $87,000 earlier in the week. Ethereum dropped to around $2,670, while several major altcoins recorded double-digit losses.

    Treasury Yields and Oil Prices Fuel the Sell-Off

    The US 10-year Treasury yield rose above 5%, reaching levels not seen since 2007, as stronger economic data and hawkish Federal Reserve comments drove the move. The Fed’s recent 25-basis-point rate hike and commitment to returning inflation to 2% have reinforced expectations for further tightening. Meanwhile, crude oil prices added to inflation concerns, with gasoline and diesel prices rising sharply since January. Higher bond yields reduce the appeal of speculative assets like cryptocurrencies, as government debt offers more attractive returns.

    Altcoins Hit Hard as Profit-Taking Accelerates

    Tokens that had posted strong gains in recent weeks were among the hardest hit. Arbitrum fell more than 14% in 24 hours, trading about 15% below its weekly high after a 263% rally from August lows. Uniswap dropped 13.78% to around $9.25, following a 240% surge from its August low. Other tokens such as Pepe, Worldcoin, and Dogecoin also gave back gains. Technical indicators, including Relative Strength Index readings above 70, suggested many cryptocurrencies had entered overbought territory.

    Broader Market Retreat

    The selling extended beyond crypto. Gold and silver declined as rising interest rates made yield-bearing assets more competitive. US stock futures also weakened, with Dow Jones Industrial Average futures falling about 142 points and S&P 500 futures dropping around 25 points. Despite the losses, Bitcoin remained higher for September overall, supported by a more favorable US regulatory environment earlier in the month.

    Market participants now face uncertainty over whether the decline is a temporary pullback or the start of a broader bearish trend. With the Federal Reserve signaling further rate hikes and bond yields continuing to climb, the outlook for risk assets remains cautious.

  • Mastering Sensex and Nifty: A Practical Guide to Interpreting Market Movements

    Mastering Sensex and Nifty: A Practical Guide to Interpreting Market Movements

    The headline number of the Sensex or Nifty can be misleading. Real market strength reveals itself through breadth, sector leadership, and the extent to which a move spreads beyond a handful of large stocks. Volume, India VIX, and the underlying trigger add crucial context. Persistence is what separates noise from a genuine trend.

    What Sensex and Nifty Actually Measure

    The Sensex tracks 30 major companies listed on the BSE, while the Nifty 50 tracks 50 major companies on the NSE. Both use free-float market capitalization weighting, giving larger companies more influence over the index. A sharp move in a heavyweight stock like Reliance Industries or HDFC Bank can noticeably affect the index, even if many smaller stocks barely react. This is why the headline index can sometimes look stronger or weaker than the broader market.

    Start with the Size of the Move

    First, check the percentage change and point movement against the previous close. This shows the scale of the move but says nothing about its cause or quality.

    Check Whether the Move Is Broad

    Market breadth compares advancing stocks against declining ones. If Nifty rises while more stocks fall than rise, the rally is riding on a few large names. If the index gains only a little while a large number of stocks move up, the market underneath is healthier. For example, a 0.5% Nifty gain with a negative advance-decline ratio indicates a narrow, top-heavy move. The same gain with a strongly positive ratio signals genuine, broad-based buying. Narrow rallies unwind quickly; broad advances tend to hold up better.

    Find Which Sectors Are Leading

    Sector indices for banking, IT, auto, and pharma often move for different reasons. Banking stocks respond to interest-rate expectations, credit growth, and earnings. IT stocks react to global technology spending and currency shifts. Watching which sector leads or lags explains what is really driving the day’s number. The index is a mix of moving parts, not one uniform block.

    Use Volume and India VIX for Context

    Volume provides context. A sharp move on unusually heavy trading deserves more attention than a similar move on a quiet, low-volume day. India VIX measures expected volatility. A higher VIX does not predict direction—it simply means bigger swings are on the table. The real question is whether that jump in uncertainty is tied to a specific event or reflects a deeper shift in investor sentiment.

    Connect the Move to Its Trigger

    Big single-day swings almost always have a specific cause: earnings from index heavyweights, RBI policy calls, inflation data, crude oil prices, or overnight moves in US markets. Markets trade on expectations, not just the news. A strong earnings report can still lead to a stock decline if investors expected even better. Conversely, weak economic data can spark a rally if it raises hopes of rate cuts. Foreign institutional flows also matter, especially in large-cap names, but they work best as one piece of the puzzle.

    Separate Noise from a Trend

    A single day’s swing often reflects one news event. A steady move across several weeks usually points to a broader shift in sentiment or earnings expectations. Treating every daily fluctuation as meaningful leads to overreaction. Watching the trend over weeks gives a clearer picture.

    A Framework for Reading Sensex and Nifty

    Running through these six checks turns a single index number into a fuller picture of what actually happened and why.

    Final Thought

    The index shows what happened; breadth and leadership reveal how widely the move was shared. Volatility and the trigger explain the market’s immediate response, while persistence shows whether the move has turned into a real trend. That is the difference between watching the market and actually reading it.

  • Apeing’s Stage 1 Presale Heats Up While Monero Holds at $518.97 and Toncoin Rises 1.43%

    Apeing’s Stage 1 Presale Heats Up While Monero Holds at $518.97 and Toncoin Rises 1.43%

    The cryptocurrency market is offering an intriguing mix of established assets and a brand-new presale opportunity. Monero is currently trading at $518.97 with a 24‑hour volume of over $110 million, while Toncoin (TON) sits at $0.005227 after gaining 1.43% in the last day. Amid these moves, a new project called Apeing has launched its first presale stage, drawing attention from early‑stage investors.

    Apeing’s Banana Drop Enters the Spotlight

    Apeing has kicked off Stage 1—dubbed the Banana Drop—allocating 150,000,000 $APEING tokens at a price of just $0.0001. The project aims to list at $0.01, suggesting a potential ROI of 9,900% for early participants. The presale emphasizes timing: limited allocation and structured holder strategies create urgency for those seeking the best crypto coins before later stages.

    Participants can join by visiting Apeing’s official website, connecting a supported wallet or payment method, selecting the Stage 1 allocation, and completing the purchase. Early entry also unlocks referral rewards, access to tier‑based staking, and a front‑row position in the community.

    Staking Tiers Offer Flexibility

    Apeing’s staking model rewards holders during the presale with fixed annual percentage yields (APY) tied to commitment levels:

    • Chimp Tier – 10% APY (from $500)
    • Monkey Tier – 25% APY ($1,000)
    • Degen Tier – 50% APY ($3,000)
    • Giga Ape Tier – 85% APY ($15,000)

    After listing, staking will transition to an on‑chain model via Ethereum’s contract, while presale participants can unstake at any time.

    Monero and Toncoin Provide Market Context

    Monero’s $518.97 price tag and significant trading volume underscore its role as a steady anchor in the crypto market. Toncoin’s 1.43% uptick, despite a rank of #5752 on CoinMarketCap, adds a contrasting datapoint for those tracking emerging assets. The gap between Apeing’s $0.0001 presale price and these established coins highlights the varied opportunities available to investors.

    Why Apeing Stands Out

    While Monero and Toncoin represent established market activity, Apeing operates from a completely different starting line. Its Banana Drop combines limited Stage 1 supply, tiered rewards, and a clear listing target. For anyone tracking the best crypto presales in 2026, this is the moment the narrative moves from announcement to active participation.

    Disclaimer: This article is for informational purposes only and does not constitute investment advice. Cryptocurrencies and presales carry high risk; readers should conduct their own research before investing.

  • Ethereum Targets $2,000 After Best Monthly Rally in Over a Year

    Ethereum Targets $2,000 After Best Monthly Rally in Over a Year

    Ethereum closed July with a 20.3% gain, marking its strongest monthly performance in a year, as inflows into spot ETFs helped push the cryptocurrency toward the key $2,000 resistance level. The rebound erased much of June’s 21.8% decline, though technical analysis suggests the broader downtrend remains intact.

    July Rebound Restores Lost Ground

    July’s advance outpaced Ethereum’s historical average return of 10.7% for the month. The move followed a difficult first half of 2026, during which ETH fell from about $2,445 in January to $1,472 in April amid recession concerns and shifts in liquid supply.

    Buyers defended the April low, keeping ETH mainly between $1,500 and $2,000 during May and June. July’s rally then carried the asset toward $1,900. Spot Ethereum ETFs recorded net inflows on most trading days in July, with daily net inflows reaching $13.29 million by month-end. Total assets held by Ethereum spot ETFs stood at approximately $10.52 billion.

    While several sessions produced large outflows, buyers consistently returned after those declines, helping ETH preserve much of its monthly recovery.

    Resistance Keeps Broader Downtrend Active

    Ethereum traded near $1,885 when analyst Crypto Patel published a two-day chart showing the price near a support and resistance zone between $1,750 and $1,850. A descending trendline from the August 2025 record high of $4,953.73 still caps major recovery attempts, with ETH having fallen about 62% from that peak.

    The key question is whether ETH can secure a daily close above $2,000 before sellers regain control. Such a close could open a move toward $2,180 and the $2,400 to $2,500 supply zone, which also contains a fair value gap from a rapid earlier move. Ethereum tested that area during its April recovery but failed to hold above it, leading to a rejection that pushed prices back toward $1,500 in June.

    According to Crypto Patel’s chart, larger upside targets between $7,000 and $10,000 would only become viable after a confirmed breakout. A renewed failure near resistance could instead send ETH back toward $1,500 or $1,000. Holding the $1,750 to $1,850 region remains critical for the current recovery.

    Conclusion

    Ethereum’s 20.3% July gain restored much of June’s decline as spot ETF inflows supported demand. ETH now faces resistance between $1,900 and $2,000. A daily close above $2,000 could expose $2,180 and $2,500, while rejection could return price toward $1,500.

    Disclaimer: This article is for informational purposes only and does not constitute financial advice. Cryptocurrency investments carry significant risk. Always conduct your own research before making investment decisions.

  • Bitcoin Holds Above $65,886 as Bulls Set Sights on $66,000 Breakout

    Bitcoin Holds Above $65,886 as Bulls Set Sights on $66,000 Breakout

    Bitcoin traded near $65,886 on July 21, 2026, after touching an intraday high of $65,978. The session opened at $65,868, dipped to $65,843, and recovered to close near the day’s high, signaling sustained buyer confidence. The price maintained support above $65,700, keeping the short-term trend bullish.

    The Relative Strength Index (RSI) stood at 68.5, with its average at 66.0, indicating strong momentum without a confirmed reversal. The upward price movement aligns with rising RSI, supporting the bullish outlook. A breakout above $66,000 could pave the way toward $66,300 and $66,500, provided buying pressure continues.

    Support levels are established at $65,725 (immediate), $65,470 (secondary), and $65,000 (psychological floor). Resistance is at $65,980, just below the key $66,000 barrier. Trading volume increased during the breakout above $65,700, suggesting institutional interest rather than short-term speculation. Volume later stabilized, indicating holders are not eager to take profits.

    Institutional demand remains a key driver, with spot Bitcoin ETFs continuing to attract fresh inflows. Positive global market sentiment and large holder accumulation also support the recovery. Traders are monitoring upcoming economic data and central bank decisions, which could influence both traditional and crypto markets.

    The short-term outlook remains positive as long as Bitcoin stays above $65,700. A successful push above $66,000 could lead to targets of $66,300 and $66,500 within the coming week. Conversely, increased selling pressure might pull prices back to $65,725 or $65,470 before a recovery attempt.

    Frequently Asked Questions

    1. What is Bitcoin’s current price? Bitcoin trades near $65,886 after reaching an intraday high of $65,978. Strong support near $65,700 reflects continued buyer confidence and a steady short-term trend.

    2. Is Bitcoin still in an uptrend? Yes. The cryptocurrency shows higher highs and higher lows, holding above its moving average and key support levels, reinforcing active buying interest and upward momentum.

    3. What are the key support levels? Immediate support is at $65,725. Below that, secondary support sits at $65,470, while $65,000 serves as the primary psychological floor.

    4. What is the next resistance level? The nearest resistance is at $65,980, just below the critical $66,000 barrier. Clearing this zone could open the path toward $66,300 and $66,500.

    5. Why is Bitcoin rising today? The rise stems from positive global market sentiment, persistent institutional interest, and ongoing spot ETF inflows, which together reinforce underlying demand and stabilize price action.

  • Bitcoin Slips to $63,870: Can BTC Reclaim the $64,400 Resistance Level?

    Bitcoin Slips to $63,870: Can BTC Reclaim the $64,400 Resistance Level?

    Bitcoin is currently trading near $63,870 after a sharp intraday decline that pushed the price below the critical $64,000 mark. Buyers stepped in to defend the $63,800 area, but bearish momentum remains strong. The short-term outlook depends on BTC’s ability to reclaim the $64,400 resistance level.

    Key Takeaways

    • Bitcoin trades near $63,870 after a sharp intraday selloff.
    • Key support stands at $63,700, while resistance begins near $64,400.
    • Fresh Bitcoin ETF inflows offer support, but bearish momentum remains strong.

    Bitcoin Technical Analysis

    The latest TradingView chart reveals a clear bearish trend on the 5-minute time frame. Bitcoin has formed a series of lower highs and lower lows, signaling that sellers remain in control. The price now sits below the 20-period, 50-period, and 200-period moving averages, indicating weak short-term momentum. Earlier in the session, Bitcoin failed to hold above the $64,800 to $65,000 zone. Heavy selling with large red candles and elevated volume suggests institutional or large trader participation. The lack of a strong recovery after the drop reinforces the current weakness.

    RSI Shows Selling Pressure May Slow

    The Relative Strength Index (RSI) dropped close to 30, a level often associated with oversold conditions. It has since edged slightly higher to near 32. This modest uptick suggests that the most intense selling pressure may have eased for now. However, the RSI remains well below the neutral 50 mark, confirming that bearish momentum still dominates. A meaningful recovery would require much stronger buying activity.

    Important Support and Resistance Levels

    Bitcoin is hovering near a crucial support zone at $63,700. If this level fails, the next support is around $63,500. A breakdown below these levels could trigger another wave of selling. On the upside, immediate resistance lies at $64,000, followed by $64,400. The strongest resistance zone is between $64,800 and $65,000, where sellers were active earlier in the day. A clear break above this area would be needed to shift sentiment bullish.

    Market Trend Remains Weak

    The overall market structure favors bears. Bitcoin trades below all key short-term moving averages and continues to make lower highs. Trading volumes have risen during the decline, confirming the bearish conviction. While buyers managed to halt the drop near $63,800, the resulting bounce is tepid and lacks the strength to signal a sustainable recovery.

    Latest Bitcoin News

    Spot Bitcoin ETFs have recorded fresh inflows after a period of outflows, providing some support. However, the inflows remain modest compared to prior outflows. Investors are also watching Federal Reserve policy expectations and geopolitical developments. Reports indicate that automated trading systems contributed to the latest selloff, briefly pushing Bitcoin below $63,000 before a partial recovery.

    Outlook

    Bitcoin remains under short-term bearish pressure despite the recent bounce. The price is around $63,900, but chart patterns favor sellers. A bullish reversal would require a decisive break above $64,400. If support at $63,700 breaks, a retest of $63,500 is likely. The next few trading sessions will be critical as the battle around $64,000 could set the near-term direction.

    FAQs

    What is Bitcoin’s current price? Bitcoin is trading around $63,870 after a sharp drop below $64,000. The short-term momentum remains bearish.

    Why did Bitcoin fall below $64,000? Strong selling pressure from automated trading systems and large institutional traders drove the price lower, with insufficient buying volume to absorb the selling.

    What are the important support levels? Immediate support is at $63,700. A break below this could lead to a move toward $63,500.

    What resistance levels should traders watch? Watch $64,000 as immediate resistance, followed by $64,400. The strongest zone is $64,800–$65,000.

    What could move Bitcoin next? ETF flows, Federal Reserve updates, geopolitical news, and whether buyers can push past key resistance levels will be decisive.

  • BlockDAG’s AI Launch and 100% Bonus Drive Buyer Interest as Polkadot and Shiba Inu Struggle

    BlockDAG’s AI Launch and 100% Bonus Drive Buyer Interest as Polkadot and Shiba Inu Struggle

    Crypto markets are trading cautiously this week, with major coins holding steady. The Sui price remains locked between $0.50 and $0.70, waiting for a catalyst as its network tests AI-driven transactions. The Shiba Inu coin price sits near $0.00000429, pressured by a tightening triangle despite a burn spike topping 3,000%.

    BlockDAG is definitely becoming everyone’s favourite gradually. Its casino has already collected $15 million in deposits and nearly $150 million in wagers from 13,000 users in a single month, all built on DAG-based infrastructure. BDAG AI’s launch added an estimated $500 million to its valuation almost overnight. Priced at $0.00000033 against a $0.03 buyback rate, and boosted by a 100% bonus, BlockDAG (BDAG) keeps surfacing as the best crypto to buy today.

    Sui Focuses on Machine Economy Foundations

    SUI is currently trading in a tight consolidation range between $0.50 and $0.70. While some traders expect a major breakout, the immediate Sui price remains tied to broader market trends and Bitcoin’s movement. Buyers have consistently defended the support level, balancing out recent daily losses and maintaining a stable market capitalization.

    Simultaneously, the network is expanding its utility by demonstrating AI-powered autonomous transactions. During testing, the platform achieved high transaction speeds, aiming to become the foundation for a machine-driven ecosystem where AI agents exchange value independently. If network activity increases and trading volume breaks through resistance, it could support the Sui price over the long term. However, future growth depends heavily on sustained user adoption and broader market stability driving the Sui price forward.

    Shiba Inu Coin Price Faces Critical Resistance

    The Shiba Inu coin price dropped slightly to $0.00000429 on July 8 as its daily chart formed a tightening descending triangle. Analysts note that Bollinger Bands have highly compressed, indicating a potential sharp move ahead, though multiple moving averages currently suggest a bearish trend.

    On-chain data revealed a major activity spike when a Robinhood-linked address burned over 109 million tokens. This individual transaction, likely fueled by platform trading fee allocations, caused the 24-hour burn rate to jump by over 3,000%. While this massive token reduction captured community attention, the immediate Shiba Inu coin price remains bounded by psychological support near $0.0000040. Traders are watching these compressed chart levels closely to determine if the next breakout will impact the Shiba Inu coin price positively.

    BlockDAG’s 100% Bonus Draws Buyers’ Focus

    Adoption figures tell a story that marketing alone cannot, and BlockDAG’s numbers are telling a compelling one right now. The BlockDAG Casino has already logged more than 13,000 users, pulled in upward of $15 million in deposits, and processed close to $150 million in wagers, all within its first month of operation.

    Every one of those transactions runs through the project’s DAG-based architecture, a structure built to handle high-speed payments and smart contract execution on a single layer, something many older blockchain designs still struggle to combine.

    That same infrastructure is now paired with fresh technical momentum. BDAG AI went live recently, adding an estimated $500 million to the project’s valuation almost immediately, a signal that the market responds strongly to real functionality rather than announcements alone.

    Pricing has moved in favor of buyers at the same time. BDAG remains priced at $0.00000033, the buyback rate sits at $0.03, and the newly launched code EARLY delivers a 100% bonus on every purchase, doubling the previous 100% offer and setting a fresh record for the project. This bonus allocation carries a limit and will close once it is fully claimed.

    Genuine usage, working technology, and a low entry price rarely converge this precisely at the same moment. The casino figures point to users staying active rather than testing the platform once. The AI launch points to development delivering real results. And the bonus points to timing working strongly in favor of anyone considering an entry now. That alignment is exactly why BlockDAG keeps surfacing among answers to the best crypto to buy today.

    Conclusion

    The Sui price still hovers between $0.50 and $0.70, tied to AI-driven transaction tests that hint at long-term rather than quick potential. The Shiba Inu coin price stays pinned near $0.00000429, even as one burn pushed the daily rate above 3,000%.

    BlockDAG’s numbers carry more weight. Its casino counts 13,000 users, $15 million in deposits, and nearly $150 million in wagers in one month, all on DAG-based rails. BDAG AI’s launch added $500 million to its valuation overnight, while a $0.00000033 price, $0.03 buyback, and 100% EARLY bonus keep it among the best cryptos to buy today. Some projects announce themselves for a moment; others just build until the numbers convince.

    Presale: https://purchase.blockdag.network
    Website: https://blockdag.network
    Telegram: https://t.me/blockDAGnetworkOfficial
    Discord: https://discord.gg/Q7BxghMVyu

    Disclaimer: Analytics Insight does not provide financial advice or guidance on cryptocurrencies and stocks. Also note that the cryptocurrencies mentioned/listed on the website could potentially be risky, i.e. designed to induce you to invest financial resources that may be lost forever and not be recoverable once investments are made. This article is provided for informational purposes and does not constitute investment advice. You are responsible for conducting your own research (DYOR) before making any investments. Read more about the financial risks involved here.

  • Ethereum ETF Inflows Surge to $70.5M as Bitcoin Sees $84.86M in Outflows

    Ethereum ETF Inflows Surge to $70.5M as Bitcoin Sees $84.86M in Outflows

    Ethereum attracted $70.5 million in institutional ETF inflows, marking five consecutive days of gains, while Bitcoin ETFs recorded $84.86 million in outflows, highlighting a short-term shift in investor preference.

    Key Takeaways

    • Ethereum ETFs recorded $70.5 million in net inflows, extending a five-day positive streak.
    • Fidelity’s FETH contributed nearly $69 million of the total Ethereum inflows.
    • Bitcoin ETFs saw $84.86 million in net outflows as some institutions shifted allocations.

    Ethereum Records Strong ETF Inflows

    Spot Ethereum ETFs received approximately $70.5 million in net inflows during the latest trading session. This result also marked the fifth straight trading day with positive inflows for Ethereum funds. Such a streak shows that institutional investors continue to place fresh capital into Ethereum despite market uncertainty.

    Among all Ethereum ETFs, Fidelity’s FETH stood out as the biggest contributor. The fund attracted close to $69 million in fresh investments. This means that Fidelity accounted for almost all of the day’s net inflows. The strong performance of FETH reflects growing confidence among large investors who want exposure to Ethereum through regulated investment products instead of direct cryptocurrency purchases.

    Bitcoin Faces Investor Withdrawals

    While Ethereum enjoyed another day of positive inflows, Bitcoin moved in the opposite direction. Spot Bitcoin ETFs recorded net outflows of nearly $84.86 million during the same period.

    Several well-known Bitcoin funds reported investor withdrawals. These included products from Grayscale, BlackRock, and Fidelity. The outflows do not necessarily mean that institutions have lost confidence in Bitcoin. Instead, they may show that some investors decided to reduce exposure or shift part of their money into other digital assets, especially Ethereum.

    Why Institutions Show More Interest in Ethereum

    According to many experts in finance, Ethereum offers utility beyond serving as a cryptocurrency. The Ethereum platform is useful when it comes to decentralized finance, tokenization, smart contracts, and numerous other blockchain applications. These capabilities make Ethereum attractive as they support decentralized finance, tokenization, and other emerging blockchain applications.

    Another reason for the current inflow of capital might be the strategy of portfolio diversification. It means that instead of investing all their funds into Bitcoin, institutional investors may prefer to use various virtual currencies. Ethereum is chosen for investment as the second most popular currency after Bitcoin for its established ecosystem and possible applications.

    Market Prices Stay Stable

    Despite the positive ETF inflows, Ethereum’s price has not experienced an explosive rally. The cryptocurrency traded above $1,740, which reflects a partial recovery after earlier weakness. The steady price movement suggests that institutional buying has helped support market confidence, even though broader economic concerns still affect investor sentiment.

    Bitcoin traded around $62,000 to $63,000 during the same period. Global economic uncertainty and geopolitical developments continue to influence the cryptocurrency market. These external factors often affect investor decisions, regardless of how much money enters or leaves ETF products.

    What the Latest Data Means

    The difference between Ethereum and Bitcoin ETF flows does not automatically signal a permanent market shift. Daily ETF numbers often change since institutional investors regularly adjust their portfolios based on market conditions, economic news, and investment strategies.

    However, five consecutive days of positive inflows into Ethereum ETFs present a meaningful trend. Continuous investment from institutions usually reflects confidence in the asset’s long-term potential. Large investors often make careful decisions after detailed research, so steady inflows can become an important signal for the broader market.

    Why This Matters

    This divergence signals a tactical institutional rotation, with investors favoring Ethereum’s utility-driven smart contract ecosystem over Bitcoin’s store-of-value narrative. Five straight days of ETH inflows validate growing corporate interest, even as spot Bitcoin ETFs face short-term profit-taking.

    Outlook for Ethereum and Bitcoin

    Recent ETF statistics show that institutional interest in Ethereum is growing. The figure of $70.5 million in net flows and Fidelity FETH’s almost $69 million contribution indicate that there is a strong demand for regulated products in Ethereum investment. The opposite situation is observed in Bitcoin, where there is a recorded net outflow of $84.86 million. This seems to imply that some institutions have shifted their interest for a while.

    Both Ethereum and Bitcoin are important cryptocurrency players. Bitcoin retains the status of the biggest cryptocurrency and the number one choice of many long-term investors. Ethereum, in turn, is strengthening its position given the increasing number of real-world applications and increased institutional interest.

    The following weeks will show whether the trend continues or whether investors return to Bitcoin in larger volumes. For now, the latest ETF statistics clearly show that Ethereum gained some momentum as a cryptocurrency for institutional investors while Bitcoin experienced a small period of weaker fund flow.