Tag: Market Trends

  • Dogecoin Price Analysis July 2026: Historical Trends Signal Key Support at $0.072

    Dogecoin Price Analysis July 2026: Historical Trends Signal Key Support at $0.072

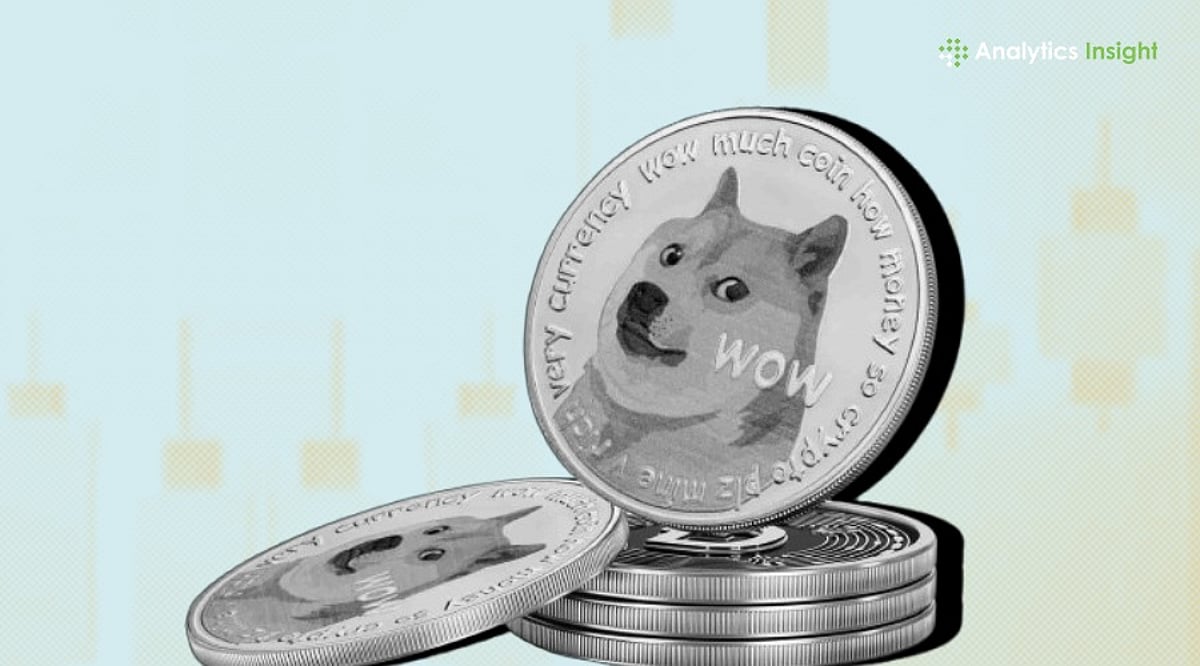
    Dogecoin (DOGE) is trading near $0.074 as July 2026 begins, following a sharp correction earlier this year. The meme coin now sits at a critical juncture, with traders closely watching the $0.072 support level to determine its next move. Historical trends suggest DOGE’s performance in July will largely depend on the broader cryptocurrency market, particularly Bitcoin’s trajectory.

    Historical July Trends for Dogecoin

    July has historically been an unpredictable month for Dogecoin. Unlike cryptocurrencies driven by project-specific updates, DOGE tends to follow the overall market sentiment. During the 2021 rally, the coin soared after Elon Musk’s public support, but subsequent years have shown a different pattern.

    Over the past five Julys, Dogecoin has closely tracked Bitcoin. When Bitcoin performed well in the third quarter, DOGE often delivered gains of 10% to 35%. Conversely, during weak market conditions, Dogecoin remained flat or declined further. This pattern indicates that July 2026’s outcome hinges on the wider crypto market.

    Technical Indicators Show Weakness

    Current technical data reveals Dogecoin under pressure. The coin has dropped below several key moving averages, signaling seller control. The most critical support level is $0.0720. A break below this floor could trigger further selling toward $0.06 to $0.065. On the upside, resistance sits near $0.09, with a potential target of $0.117 if buying pressure returns.

    Market Sentiment and Key Factors

    Investor confidence remains low, with sentiment trackers showing ‘Extreme Fear’ across the crypto market. Dogecoin, heavily reliant on retail investors, is particularly sensitive to this mood. Several factors could shift the outlook:

    • Broader market recovery: A Bitcoin rebound could lift DOGE.
    • Developer updates: Ongoing improvements to payment systems and wallet upgrades may strengthen Dogecoin’s utility.
    • Elon Musk’s influence: Any public comment from Musk could quickly move the price.

    Price Scenarios for July 2026

    Based on historical trends and current conditions, three scenarios are possible:

    • Bearish: If $0.072 support breaks, DOGE could fall to $0.06–$0.065.
    • Neutral: Sideways trading between $0.07 and $0.085 if market conditions remain quiet.
    • Bullish: A market upturn could push DOGE above $0.09 toward $0.11–$0.12.

    Final Outlook

    Technical signals remain weak, and sentiment is poor. However, if Dogecoin holds above $0.07, recovery potential exists. July will be a decisive month for investors. A stronger crypto market could enable DOGE to recover, while continued weakness may bring further downside in the second half of 2026.

    Frequently Asked Questions

    What is Dogecoin’s current price in July 2026?

    Dogecoin trades near $0.074, fluctuating between $0.071 and $0.075 after steep drops earlier this year.

    Why is Dogecoin under pressure?

    DOGE faces ‘Extreme Fear’ in the market, low retail confidence, and selling pressure that dragged it below key moving averages.

    What is the most important support level for DOGE?

    The critical support zone is $0.072. Breaking below could lead to a drop toward $0.06–$0.065.

    Can Dogecoin rise this month?

    Yes, if Bitcoin rebounds. A bullish reversal could help DOGE clear $0.09 resistance and reach $0.11–$0.12.

    What price target do analysts expect for 2026?

    If market conditions improve, analysts forecast Dogecoin could recover toward $0.10.

  • BlockDAG Leads $500M AI-Driven Crypto Rally as Render and Cardano Show Signs of Strategic Recovery

    BlockDAG Leads $500M AI-Driven Crypto Rally as Render and Cardano Show Signs of Strategic Recovery

    The crypto market is undergoing a significant capital rotation, with investors shifting from traditional layer-1 networks and niche tokens toward platforms offering immediate value and scalability. This trend has brought BlockDAG (BDAG) into the spotlight as one of the top crypto gainers today, following a $500 million valuation jump tied to its new BlockDAG AI technology.

    Alongside this artificial intelligence milestone, the project revealed plans for a Fully Regulated Crypto Exchange & App, changing how users perceive utility and ecosystem access. These developments are reshaping investor sentiment and driving up daily transaction volumes.

    Render Price Shows Signs of a Potential Turnaround

    The Render price is quietly positioning for a notable comeback, with technical patterns that have analysts optimistic. Currently trading around $1.52 after a minor 24-hour dip, the token has corrected nearly 92% from its all-time high of $13.83. This correction has pushed Render into a long-term accumulation zone between $1.20 and $0.80, historically a prime entry point for investors.

    Despite Bitcoin’s sideways movement capping immediate growth, short-term forecasts point to a potential 34% rally that could push Render to $2.20. If the token breaks out of its multi-year downward channel and surpasses $2.71, experts see targets at $5.50, $13, and beyond. For this decentralized GPU platform, the quiet period appears less like a decline and more like a launchpad.

    Cardano Crypto Aims for Real-World Utility Beyond Market Rankings

    Cardano crypto is navigating a tough market, with ADA slipping to approximately $0.1441 and ranking 18th by market capitalization. The token would need a surge of over 2,000% to reclaim its previous all-time high. Despite skepticism, founder Charles Hoskinson remains confident, emphasizing that real success goes beyond recovering past price milestones.

    The project’s roadmap focuses on global blockchain adoption through tangible applications, relying on its EUTXO accounting model, decentralized governance, proof-of-stake security, and the Midnight privacy initiative. For loyal Cardano supporters, the current price drop is seen as a foundation for a secure, global infrastructure.

    BlockDAG Builds Massive Momentum as Top Crypto Gainer

    BlockDAG is capturing market attention by locking in its position among top crypto gainers through a series of major milestones. The ecosystem saw a $500 million valuation jump from its BDAG AI launch, alongside plans for a regulated trading platform and mobile app. To celebrate, the network doubled its World Cup promotion from a 50% to a 100% bonus for new participants.

    Under this structure, buyers can purchase BDAG at $0.00000066 and receive an immediate 100% extra allocation, with coins sent directly to their wallets. The project also features a built-in $0.03 buyback mechanism, creating a clear exit strategy. Combined with an upcoming mainnet upgrade capable of 7,000 transactions per second, this has driven massive transaction volume.

    While older networks face resistance, BlockDAG’s combination of AI tools and fixed-value systems keeps it among the top crypto gainers today.

    Summary

    The crypto market is moving in different directions. While Render price appears technically ready for a cyclical bounce and Cardano builds long-term decentralized governance, BlockDAG has captured immediate attention by slashing entry barriers. By launching AI tools, growing valuation by $500M, and prepping a regulated exchange, the platform boosted its community with a World Cup Bonus raised from 50% to 100% extra BDAG. Anyone buying at $0.00000066 gets that bonus, a $0.03 buyback path, and instant coin delivery, keeping the project aligned with top crypto gainers.

    Disclaimer: This article is for informational purposes only and does not constitute investment advice. Cryptocurrencies are high-risk assets; you are responsible for your own research (DYOR) before investing.

  • Dogecoin Price Dips to $0.07 as Analysts Warn of Potential Further Decline

    Dogecoin Price Dips to $0.07 as Analysts Warn of Potential Further Decline

    Dogecoin (DOGE) fell to approximately $0.072 on June 26, hitting a three-year low before recovering slightly to $0.074, according to CoinGecko. The decline has kept attention on the $0.070 support level as analysts weigh the possibility of an oversold rebound against further losses toward the $0.05 region. Weak trading volume and reduced whale holdings continue to pressure DOGE’s near-term market structure.

    DOGE Holds Near Critical Short-Term Support

    Market analyst Ali Martinez reported that Dogecoin’s TD Sequential indicator produced a buy signal after the meme coin extended its multi-month decline. Martinez identified $0.073 as the decisive level for the current setup. Holding that price could support a recovery toward $0.081.

    A move below $0.073 would invalidate the signal and leave DOGE exposed to renewed selling pressure near its recent low. Meanwhile, large holders reduced their combined positions by 420 million DOGE within seven days, according to Martinez. Their total holdings declined to nearly 35 billion tokens, representing less than 23% of Dogecoin’s circulating supply. The reduction added another source of supply as DOGE struggled to establish a stable recovery above its immediate support range.

    DOGE’s Relative Strength Index (RSI) also dropped to about 18.6 during the sell-off, placing the asset within extreme oversold territory. Such readings have previously appeared before price recoveries, although the indicator alone does not confirm that a durable bottom has formed.

    Analysts Track Deeper Support and Long-Term Pattern

    A chart shared by Cantonese Cat placed DOGE near the lower section of its long-term trading profile and close to support between $0.06 and $0.07. Low trading volume could allow the price to fall further before buyers establish a stronger market floor.

    DOGE must first hold $0.070 and then reclaim the $0.073 to $0.075 range with stronger volume to improve its immediate structure. Daan Crypto Trades identified another long-term support region near $0.05, where extended sideways movement could precede a later structural recovery. Celal Kucuker also placed a possible buying range between $0.05 and $0.06 while maintaining a long-term Dogecoin target of $1. By contrast, Part-Time Trader warned of a possible 95% decline, which would place DOGE near $0.004.

    Trader Tardigrade’s three-month chart showed Dogecoin testing the lower boundary of a multi-year pennant that still supports a longer-term bullish formation. The pattern could remain active while DOGE holds that boundary, although the analyst’s potential $10 target requires several price confirmations.

    DOGE must reclaim $0.081 before challenging $0.090 and $0.10. Further resistance sits at $0.12, while $0.16 remains the first major higher-timeframe barrier. On the downside, a break below $0.06 would direct attention toward $0.055 and $0.050, where longer-term buyers previously entered the market.

    What’s Next?

    Dogecoin remains under pressure near $0.07 as weak volume, whale selling, and fragile support increase downside risks. A recovery above $0.081 could improve momentum, while failure to hold $0.06 may expose the $0.05 region. Traders should watch volume and support levels closely before expecting a stronger rebound.

  • Ethereum on Track for Historic Three-Quarter Losing Streak as Institutional Strategies Diverge

    Ethereum on Track for Historic Three-Quarter Losing Streak as Institutional Strategies Diverge

    Ethereum is approaching its first three-quarter losing streak as prices continue to weaken, institutional strategies diverge, and staking absorbs supply amid persistent negative sentiment. The world’s second-largest cryptocurrency by market capitalization fell below $1,800 after failing to break through the key $2,400 resistance level.

    Ethereum Approaches a Historic Quarterly Decline

    CoinGlass quarterly return data shows that Ethereum closed the fourth quarter of 2025 in negative territory and has continued falling through the first and second quarters of 2026. Another negative quarterly close would mark three consecutive losing quarters for the first time, extending a downturn that has lasted longer than previous corrections. While Ethereum has faced major price declines before, recoveries typically followed within one or two quarters. This time, sustained selling has kept pressure on bullish traders for an extended period.

    BlackRock and BitMine Follow Opposite Paths

    Large institutions have not moved in unison during Ethereum’s decline. According to market updates, BlackRock sent additional Bitcoin and Ether to Coinbase Prime while reducing its Ether exposure. The asset manager sold Ether for seven consecutive trading days, with its most recent purchase occurring about two weeks before the latest report.

    In contrast, Tom Lee’s BitMine continued buying the asset despite broader market weakness. The firm added 27,084 ETH—worth approximately $42.5 million—to its corporate holdings, raising its total position to 5.7 million ETH. That holding represents about 4.72% of Ethereum’s total supply.

    Staking Absorption Complicates Market Positioning

    Analytics firm CryptoQuant notes that Ethereum now faces a collision between negative sentiment and supply absorption through staking. The firm describes this combination as a precarious environment, particularly for short-sellers. Staking reduces the amount of organic supply available for active trading, while weak sentiment can increase volatility as buyers and sellers react to changing support levels.

    The question remains: Can staking absorption contain further selling while major institutions continue taking opposite positions? Traders are watching whether Ethereum can hold key support areas after its move below $1,800. Trading volume has remained subdued during the latest phase, showing cautious participation across the market. This reduced activity adds another layer of uncertainty around Ethereum’s near-term price direction.

    What’s Next?

    Ethereum faces a possible third consecutive negative quarter as weak sentiment and selling pressure continue. BlackRock has reduced exposure while BitMine expands its holdings, and staking absorbs available supply. Market participants are advised to monitor support levels, institutional activity, and trading volume before making trading decisions.

  • Can Bitcoin Whales Offset Record $4.06 Billion ETF Outflows to Prevent Further Price Drops?

    Can Bitcoin Whales Offset Record $4.06 Billion ETF Outflows to Prevent Further Price Drops?

    Bitcoin is at a critical juncture as large holders, known as whales, try to fill the gap left by weakening institutional demand. After U.S. spot Bitcoin exchange-traded funds recorded heavy redemptions totaling $4.06 billion, the market is watching whether whale activity near the $60,000 level can stabilize prices.

    ETF Outflows Weigh on Bitcoin Demand

    U.S. spot Bitcoin and Ethereum ETFs have experienced seven consecutive days of net outflows. Bitcoin funds alone lost approximately $445 million in a single session, while Ethereum products saw about $12.85 million in withdrawals. Last week marked the largest weekly outflow on record for Bitcoin ETFs, with losses exceeding $1.79 billion. This selling pressure has spread across several major funds as investors reduce crypto exposure.

    Previously, ETF demand absorbed Bitcoin supply during market corrections. With that support fading, the market now depends more on whales, long-term holders, and retail buyers. However, renewed institutional inflows could provide stronger price support, but current flows indicate that demand has not recovered yet.

    Bitcoin’s Coinbase Premium remains weak, and apparent demand has stayed negative for 208 consecutive days, recently falling to about negative 273,000 BTC. This suggests that new buying has struggled to absorb available supply.

    Whale Transactions Surge Around $60,000

    Large Bitcoin holders became more active as the price tested levels below $60,000. The network recorded 6,920 transactions worth more than $100,000 and 1,438 transfers above $1 million. This was the second-largest spike in whale activity in two months.

    The increase indicates that some large holders viewed the decline as a possible accumulation window. However, transaction volume does not confirm that every whale transfer involved buying; some movements may include sales, exchange deposits, or wallet transfers.

    Bitcoin later rebounded toward $60,000, but momentum remained weak. The relative strength index (RSI) stayed near oversold levels, while the MACD showed that buyers had not regained control. Therefore, the rebound remains “unconfirmed” without stronger spot demand and better ETF flows.

    Traders are now watching $57,000 as a potential liquidation zone. A break below that level could expose Bitcoin to $54,000, near a key realized price level, testing whether whales will absorb more selling.

    Long-Term Holders Begin Realizing Losses

    Long-term holders are also reacting to the decline. The monthly average for the Long-Term Holder SOPR (Spent Output Profit Ratio) fell from 1.03 to 0.8, showing that some older investors sold Bitcoin at a loss—indicating losses of about 13% over the past month.

    The yearly average also declined from 2.06 to 1.46, meaning realized profits among long-term holders have narrowed as Bitcoin trades well below its recent high near $82,803.

    Selling by older holders can add pressure in the short term. However, the data suggest that weaker sellers are reducing exposure near current levels, which may reduce future selling but does not confirm an immediate price reversal.

    Outlook: Two Competing Forces

    Bitcoin now faces two competing forces. On one side, ETF redemptions and weak spot demand weigh on the market. On the other, whale activity offers support near $60,000. A sustained recovery still requires stronger buying across ETFs, exchanges, and the wider spot market.

  • Solana Surges Past $70 as ETF Inflows Hit $1.45 Billion – Is Institutional Demand Fueling the Next Rally?

    Solana Surges Past $70 as ETF Inflows Hit $1.45 Billion – Is Institutional Demand Fueling the Next Rally?

    Solana has reclaimed the crucial $70 price level, sparking renewed optimism across the cryptocurrency market. The move above this key resistance comes on the back of massive exchange-traded fund (ETF) inflows totaling $1.45 billion, alongside rising institutional participation and robust network activity. Analysts now eye targets at $75, $85, and even $97 if bullish momentum persists.

    Key Takeaways

    • Solana climbed from recent lows near $61.50 to trade between $71 and $72.
    • Spot Solana ETFs have attracted nearly $1.45 billion in cumulative inflows since launch.
    • Major financial institutions, including Goldman Sachs, now hold Solana ETF exposure worth $108 million.
    • Technical indicators show recovery, with the 14-day RSI bouncing from oversold levels.
    • Strong on-chain activity from projects like Jupiter and Pump.fun supports network fundamentals.

    ETF Demand Ignites Market Sentiment

    The primary driver behind Solana’s resurgence is surging demand for spot Solana ETFs. Throughout 2026, institutional investors have steadily increased allocations to Solana products, even during broader crypto market weakness. Data shows total inflows into Solana ETFs have reached $1.45 billion, signaling a structural shift in capital flow. This pattern mirrors earlier rallies seen in Bitcoin and Ethereum after their own ETF launches, where institutional buying provided a robust price floor.

    Institutional Giants Enter the Arena

    Another major catalyst stems from participation by traditional finance titans. Earlier this year, reports confirmed that Goldman Sachs holds approximately $108 million in Solana ETF exposure. Such institutional involvement boosts market confidence, as large investors typically commit for the long term, reducing volatility and supporting sustained upward movement.

    Network Activity Remains Strong

    Beyond ETF demand, Solana’s blockchain continues to thrive. High-traffic platforms such as the decentralized exchange aggregator Jupiter and meme token platform Pump.fun dominate network usage. Elevated transaction volume leads to higher fee generation and increased demand for SOL tokens, underpinning the asset’s fundamental value.

    Technical Indicators Turn Bullish

    From a technical standpoint, Solana’s 14-day Relative Strength Index (RSI) fell to 28 earlier this month, indicating oversold conditions historically preceding short-term recoveries. Price has since bounced from the $61.50 low, and the $65 support zone has held firm. The break above $70 has shifted market sentiment from bearish to cautiously optimistic.

    Risks and Caution

    Despite the positive momentum, risks remain. Broader market weakness persists; Bitcoin ETFs saw nearly $2.97 billion in outflows over a ten-session stretch earlier in June. If global financial uncertainty returns, risk assets like Solana could face renewed selling pressure. However, strong structural inflows provide a buffer that many other cryptocurrencies lack.

    What Lies Ahead for Solana?

    The immediate resistance stands at $75. A decisive breakout above that level could open the door to $85, where previous selling pressure emerged. Beyond that, the $97 mark represents a critical milestone for confirming a broader uptrend in the second half of 2026. The combination of institutional ETF demand, vibrant network activity, and improving technicals gives Solana a solid foundation for further gains.

    Disclaimer: This article is for informational purposes only and does not constitute financial advice. Cryptocurrency investments carry risk. Always conduct your own research before investing.

  • Solana’s Price Slump: Key Factors Behind the Drop to $67 and What’s Next

    Solana’s Price Slump: Key Factors Behind the Drop to $67 and What’s Next

    Solana, once a high-flying blockchain known for its lightning-fast transactions and low fees, is facing a significant momentum test. As of late June 2026, SOL trades near $67 to $70, far below its previous highs, leaving many investors questioning the network’s short-term prospects.

    Why Solana’s Price Is Falling

    The decline stems from a combination of broader market weakness, reduced trading activity, and increased competition—especially from Ethereum. Here are the main drivers:

    • Market-wide slowdown: Risk appetite has dried up across crypto, with traders favoring Bitcoin and stablecoins over altcoins.
    • Technical resistance: SOL is stuck between support at $64–$68 and resistance at $70–$75, signaling indecision.
    • Drop in speculative demand: Meme coins and NFT mania on Solana have cooled, reducing network activity and trading volumes.
    • Ethereum’s Layer-2 upgrades: Faster, cheaper transactions on Ethereum have eroded Solana’s speed advantage.
    • Institutional caution: Large investors have not poured capital into SOL as they have into Bitcoin.
    • Global economic pressure: High interest rates and tight financial conditions suppress demand for risky assets.

    But Fundamentals Remain Strong

    Despite the price pain, Solana’s network health is solid. Developer activity continues, DeFi platforms are active, and the upcoming Firedancer validator upgrade promises to boost speed and efficiency. Many analysts believe these factors support a long-term recovery.

    Outlook: Could SOL Rebound in 2026?

    Some forecasts suggest a recovery toward $80–$100 later this year if the broader market improves. However, short-term sentiment remains bearish, with a possible dip to $60 before any sustained rally. For now, traders should watch the $64–$68 support zone closely.

    Frequently Asked Questions

    1. Why is Solana’s price dropping right now?

    SOL is caught in a wider crypto market slowdown. A drop in high-risk retail trading, lower trading volumes, and broader global economic caution are putting heavy pressure on the price.

    2. What key price levels should traders watch?

    Keep a close eye on the $64 to $68 support zone. If SOL breaks below that, it could sink toward $60. To recover, it needs to clear resistance between $70 and $75.

    3. How is Ethereum hurting Solana’s growth?

    Ethereum’s new Layer-2 scaling upgrades have made its transactions much faster and cheaper. This directly challenges Solana’s main selling points—speed and ultra-low costs—shrinking the competitive gap between them.

    4. Can Solana realistically bounce back in 2026?

    Yes, if the broader crypto market recovers, analysts see a path back to the $80–$100 range. However, short-term prediction sentiment remains bearish, with a possible drop to $60 first.

    5. Does Solana still have strong long-term potential?

    Absolutely. Network health remains robust with high developer activity and major infrastructure upgrades rolling out, including the Firedancer validator client, which keeps long-term investor optimism intact.

    Disclaimer: This article is for informational purposes only and does not constitute financial advice. Cryptocurrency investments carry risk. Always do your own research before investing.

  • Big Data Insights: Key Trends, Tools, and Industry Impact in 2025-2026

    Analytics Insight’s Big Data section curates essential articles exploring the transformative power of data analytics across industries. From open-source tools to predictive market analysis, these pieces uncover how organizations leverage big data for strategic advantage.

    Top Headlines

    • Best Open-Source Big Data Tools in 2026: A comprehensive guide to the most effective open-source platforms for handling massive datasets.
    • What is Big Data Analytics? (2026 Guide): Explains the meaning, types, tools, and real-world applications of big data analytics.
    • The Growing Role of Big Data in Predictive Market Analysis: How data-driven models forecast market trends with increasing accuracy.
    • Big Data in Telehealth and Remote Diagnostics: Transforming patient care through real-time data processing and remote monitoring.
    • Gartner’s Essential Features for BI Platforms (2025): Key capabilities business intelligence tools must offer in the modern data landscape.
    • Top Free Scala Courses for Big Data (2025): Learning resources for mastering Scala, a language critical for big data frameworks.
    • Drinksworld Uses Big Data for Business Growth: A case study on how data analytics drives strategy in the beverage industry.
    • Big Data Reshaping the Automotive Industry: From autonomous driving to supply chain optimization, data is revolutionizing mobility.
    • Big Data Revolution in Healthcare: Predictive analytics and precision medicine are becoming standard through big data.
    • Top 10 Data Lakes for Big Data Analytics: A detailed overview of leading data lake solutions for scalable analytics.
    • Big Data Analytics Trends to Watch in 2025: Emerging patterns that will define the next wave of data analytics.
    • Why the World Would End Without Data: A thought piece on the catastrophic consequences of a data-less society.

    These articles provide a rich resource for professionals, researchers, and enthusiasts looking to stay ahead in the rapidly evolving world of big data.