Tag: Technical Analysis

  • MCX Gold Slips 0.27% to Rs 1,48,800 Amid US-Iran Tensions and Rising Oil Prices

    MCX Gold Slips 0.27% to Rs 1,48,800 Amid US-Iran Tensions and Rising Oil Prices

    Gold prices on the Multi Commodity Exchange (MCX) declined on September 29 as geopolitical tensions between the United States and Iran over the Strait of Hormuz continued to push energy costs higher, increasing pressure on the Federal Reserve to maintain elevated interest rates.

    October gold futures fell 0.27% to Rs 1,48,500 per 10 grams, while September silver futures dropped 0.46% to Rs 2,46,130. In the international market, Brent crude futures rose 1.80% to USD 107.2 per barrel, and US West Texas Intermediate (WTI) gained 1.75% to USD 94.22 per barrel.

    Domestic Gold Prices

    In India, 24K gold fell by Rs 137 to Rs 1,48,800 per 10 grams, and 22K gold declined by Rs 125 to Rs 1,36,400. City-wise, Mumbai and Kolkata reported prices of Rs 1,48,800, Delhi at Rs 1,48,950, and Chennai at Rs 1,49,080.

    US Gold Prices

    In the United States, gold prices edged higher on Tuesday but remained near their lowest level in over seven weeks amid concerns that the Fed could keep rates higher for longer. Spot gold rose 0.4% to USD 4,130.58 per ounce, while US gold futures fell 0.2% to USD 4,162.20. Spot silver declined 0.9% to USD 60.42, platinum slipped 1.3% to USD 1,697.71, and palladium lost 0.8% to USD 1,205.27.

    Key Levels to Watch

    Christopher Tahir, senior market strategist at Exness, noted: “Geopolitical developments will remain crucial for gold, as continued tensions could keep energy prices and yields elevated, while meaningful progress toward de-escalation could ease pressure. Persistent price pressures combined with resilient activity would reinforce expectations that central banks need to remain restrictive, keeping yields elevated and leaving gold vulnerable to further losses.”

    On the daily chart, XAU/USD trades at USD 4,130, holding below the 20-day, 50-day, and 100-day simple moving averages clustered between roughly USD 4,290 and USD 4,330, which keeps the near-term bias bearish. The Relative Strength Index (14) near 36 suggests weak momentum but not outright oversold conditions, hinting that bears retain control.

    Immediate support is seen at the rising trend-line base near USD 3,990, where dip-buying interest could emerge if the current pullback extends. On the upside, the first resistance band is defined by the 100-day SMA at USD 4,292, followed closely by the 50-day SMA at USD 4,321 and the 20-day SMA at USD 4,325, forming a dense supply zone that gold would need to reclaim to ease bearish pressure.

  • IMX Token Surges 9.25% as Bulls Eye Key Resistance at $0.1855

    IMX Token Surges 9.25% as Bulls Eye Key Resistance at $0.1855

    Immutable X’s IMX token surged 9.25% as strong buying pressure drove the latest rally. The token now trades above major moving averages while approaching key resistance near USD 0.1855.

    Technical indicators also support the short-term advance. Still, several momentum readings show overbought conditions, which could increase the risk of a near-term pullback.

    Meanwhile, stronger NFT activity and continued development across Immutable’s gaming ecosystem have added broader context to the price recovery.

    IMX Price Momentum Builds Near Key Resistance

    IMX/USD trades above its 20-day, 50-day, and 200-day moving averages. Those levels currently stand at USD 0.1372, USD 0.1267, and USD 0.1427, respectively.

    The positioning confirms bullish momentum across several time horizons. However, the broader structure still carries bearish signals because the 50-day average remains below the 200-day benchmark.

    Immediate resistance sits at USD 0.1855, while near-term support stands around USD 0.1562. Therefore, the next price reaction around those levels could shape the token’s short-term direction.

    The latest advance has already pushed IMX toward the USD 0.20 psychological zone. During Monday’s session, the token reached an intraday high of USD 0.1945 following rapid upward expansion.

    That question has become more important because the rally follows a strong move from lower September levels. At the same time, the token remains far below its November 2021 all-time high of USD 9.50.

    Technical Indicators Signal Strength and Overbought Risk

    The MACD and ADX indicators remain supportive of further upside momentum. Both measures point to strong trend conditions during the current advance. Meanwhile, the Relative Strength Index stands at 75.694. That reading places IMX firmly inside overbought territory and signals that recent gains have developed rapidly.

    The Stochastic RSI and Commodity Channel Index also show overbought conditions. As a result, the technical picture combines strong momentum with increasing risk of short-term corrective pressure.

    Positive Bull Bear Power readings continue to show buyer control. The Awesome Oscillator also remains bullish, confirming stronger intraday demand.

    Still, some corrective pressure emerged after the strong opening move. That behavior remains consistent with elevated momentum indicators following a rapid price increase.

    Daily volatility stands at 5.44%, showing that price swings remain elevated. Earlier technical assessments had already identified constructive momentum and strong buyer participation during intraday trading.

    The latest session strengthens that pattern. Even so, USD 0.1855 remains the key resistance level for any sustained upside breakout.

    NFT Growth Adds Context to Immutable’s Recovery

    IMX’s rally also developed alongside stronger activity across the broader NFT market. Global NFT sales increased 57.17% during the latest seven-day reporting period.

    Total sales reached approximately USD 55.51 million. At the same time, buyer addresses increased 39.65% to 160,565. NFT transactions also rose 5.93% to 825,513. Ethereum remained the largest blockchain by sales after producing USD 30.33 million in weekly volume.

    Ethereum NFT sales increased 113.52% during the period. Meanwhile, Immutable also appeared among networks benefiting from stronger market activity.

    Guild of Guardians Heroes, which operates on Immutable-Zk, recorded about USD 986,168 in weekly NFT sales during the previous reporting period.

    The collection completed 689 transactions involving 390 buyers and 399 sellers. Its sales increased 3.5% during the seven days measured through September 19.

    These figures provide ecosystem context for IMX’s recovery. However, they do not prove that NFT sales directly caused the token’s price increase. Crypto prices can also respond to liquidity, speculative demand, technical positioning, and broader market conditions.

    Immutable’s gaming ecosystem remains another important part of the token’s market backdrop. The network supports blockchain-enabled games and infrastructure for digital asset ownership. Might & Magic: Fates represents one notable title within that ecosystem. Immutable’s gaming portal lists the Ubisoft-linked tactical card game as launching on February 4, 2026.

    The game operates on mobile and Steam. It combines card collection, tactical structures, and competitive battles while expanding Immutable’s exposure to established gaming franchises.

    As a result, traders continue to watch whether IMX can hold its breakout after approaching USD 0.20. The USD 0.1945 intraday high provides the nearest reference above current resistance. Meanwhile, the sharp rise in trading activity shows that the latest move attracted stronger market participation than the previous session.

  • Bitcoin Technical Analysis Explained: How Traders Read Price, Momentum and Leverage

    Bitcoin Technical Analysis Explained: How Traders Read Price, Momentum and Leverage

    What Bitcoin technical analysis actually does

    Bitcoin technical analysis is a framework for reading market direction through price action, trading volume, momentum and historical patterns instead of corporate earnings or balance-sheet fundamentals. Because BTC has no cash flows to value, chart-based tools carry more weight than they do in equity markets.

    Traders use these tools to map trends, locate probable support and resistance zones, and gauge whether a move is backed by broad participation. The key caveat: indicators describe the market as it is right now. They do not forecast Bitcoin’s next price with certainty. Their value comes from stacking several signals together, reading them against the wider market backdrop, and applying strict risk control.

    Support and resistance: mapping where buyers and sellers showed up

    Support is a price band where buying has repeatedly absorbed selling. Resistance is the mirror image — a zone where sellers previously stepped in. These bands tend to form around prior swing highs and lows, heavy-volume trading areas, and the average cost basis of holders.

    Recent on-chain data offers a working example. Glassnode reported on September 23 that BTC had climbed above a large long-term-holder supply cluster near $84,000–$85,000. The next meaningful on-chain hurdle sat around the mean MVRV price, close to $96,700. Glassnode also flagged the $95,000–$97,000 band as significant, where options positioning and on-chain valuation metrics overlap.

    Treat these as zones, not precise reversal points. Price frequently overshoots or stalls just short of a level before reacting.

    Moving averages for trend direction

    Moving averages flatten out short-term noise so the underlying trend is easier to see. The 50-day MA is the standard gauge for medium-term momentum; the 200-day MA frames the longer-term picture.

    • Sustained trading above these lines suggests strengthening momentum.
    • Extended periods below them point to deteriorating conditions.
    • Crossovers between the short and long averages draw attention, but they generate plenty of false signals in choppy markets.

    Momentum: the Relative Strength Index

    The RSI scores the speed and size of recent price changes on a 0–100 scale. Readings above 70 are traditionally labeled overbought; readings below 30 are labeled oversold.

    Bitcoin is prone to staying overbought or oversold far longer than conventional thresholds imply, especially during powerful trends. That makes RSI far more useful as a confirmation tool — read alongside price structure and volume — than as a standalone buy or sell trigger.

    Volume as a participation check

    Volume reveals how much conviction sits behind a price move. During September’s recovery, BTC spot volume more than doubled from its August low. The pickup appeared across multiple exchanges, which points to broad market involvement rather than activity concentrated on a single venue.

    Derivatives: the leverage layer

    Futures and options now sit at the center of crypto technical analysis.

    • Open interest tracks outstanding derivative positions.
    • Funding rates hint at whether leveraged traders are leaning long or short.
    • Liquidations show where forced exits could amplify price swings.

    Glassnode reported in September that Bitcoin futures open interest stayed elevated, while options open interest stood near $41 billion. Together, these figures help traders judge how much leverage is embedded in the market and where volatility could spike.

    Why a multi-signal approach matters

    No single indicator tells the whole story. Combining support zones, moving averages, momentum, volume and derivatives gives a fuller read on market structure — enough to identify trend shifts, assess risk and sketch out plausible scenarios without pretending to predict the future.

    Risk management remains the non-negotiable piece. Position sizing and stop placement matter more than any signal, because technical analysis can be wrong for extended stretches.

    Frequently asked questions

    What is Bitcoin technical analysis?

    It is the study of historical price action, volume and market behavior to identify trends and potential trading levels. Unlike fundamental analysis, it focuses on market data rather than estimating Bitcoin’s intrinsic value.

    How do support and resistance work in BTC trading?

    Support is a zone where buying pressure has historically increased; resistance is where selling pressure has appeared. Traders derive them from prior highs and lows, high-volume areas and holder cost bases.

    Why are moving averages used?

    They smooth short-term volatility so broader trends are easier to read. The 50-day average reflects medium-term momentum, while the 200-day average captures longer-term direction.

    What does RSI tell Bitcoin traders?

    RSI measures the speed and magnitude of recent price moves. Above 70 is traditionally viewed as overbought and below 30 as oversold, though neither reading guarantees a reversal.

    Why do volume and derivatives matter?

    Volume shows how much participation supports a move. Futures and options data — open interest, funding rates and liquidations — reveal whether price action is driven by spot demand or leveraged positioning.

    Disclaimer: This article is for informational purposes only and does not constitute financial or investment advice. Cryptocurrency assets carry significant risk, including the potential loss of all invested capital. Always conduct your own research before investing.

  • August 2026 Crypto Review: Bitcoin Shatters $80K, Ethereum Tests $2.5K as Altcoins Rebound

    August 2026 Crypto Review: Bitcoin Shatters $80K, Ethereum Tests $2.5K as Altcoins Rebound

    August 2026 marked a decisive shift in cryptocurrency market structure. After a subdued July, Bitcoin finally broke free from its multi-month consolidation and surged above USD 80,000, while Ethereum accelerated toward the psychologically important USD 2,500 level. The rally extended well beyond the two largest cryptocurrencies, with XRP, Hyperliquid (HYPE), Solana, and several other altcoins posting strong gains.

    Market-wide data confirms the breadth of the move. Bitcoin gained roughly 25% during August, while Ethereum advanced approximately 32.5%, according to CoinMarketCap. Around 70 of 84 non-stablecoin assets in the top 100 finished the month higher. Institutional flows also strengthened, with US spot Bitcoin ETFs recording approximately USD 3.52 billion in August net inflows and spot Ethereum ETFs attracting roughly USD 1.85 billion, according to SoSoValue.

    The key question entering September is no longer whether the market can recover from its yearly lows, but whether August’s breakout can develop into a sustainable trend without surrendering newly reclaimed support levels.

    Bitcoin (BTC): A Breakout With Strong Technical Confirmation

    Bitcoin delivered the most important technical breakout of the summer. The daily chart shows BTC near USD 79,815, substantially above the USD 66,500 resistance that had capped previous recovery attempts. Price briefly moved above USD 80,000 before entering a tight consolidation just below the major USD 85,000 resistance level.

    This is a major improvement from July, when Bitcoin was trapped between USD 61,300 and USD 67,500. The breakout above USD 67,516 provided the bullish confirmation identified in the previous report. Bitcoin now trades above its 50-day EMA (USD 72,088), 100-day EMA (USD 70,274), and 200-day EMA (USD 72,749). Reclaiming the 200-day EMA is particularly significant because it had acted as long-term dynamic resistance throughout the decline.

    The breakout occurred on a large expansion in trading volume, adding strength to the move. Bitcoin started August near USD 62,800 and climbed above USD 80,000 late in the month, with the August 28 high around USD 81,300.

    Momentum Indicators

    RSI stands near 65.56, comfortably above the neutral 50 level but not deeply overbought. It briefly pushed above 70 during the breakout before cooling as BTC consolidated near USD 80,000. MACD remains above the zero line, confirming a positive momentum structure, though the MACD line (3,124) sits slightly below the signal line (3,340), indicating that the speed of the rally is moderating.

    Technical Outlook

    Bitcoin enters September with its strongest structure in months. Immediate resistance is USD 85,000, with key support at USD 72,000-70,000, followed by USD 66,500 and USD 62,300. A sustained daily close above USD 85,000 would confirm continuation of the breakout. The USD 70,000-73,000 region is especially critical because all three major moving averages converge there. Holding above the moving-average cluster keeps the August breakout intact.

    Ethereum (ETH): Stronger Recovery, Testing USD 2,500

    Ethereum produced an even stronger percentage recovery than Bitcoin during August. The daily chart shows ETH around USD 2,494, immediately below the major USD 2,500 horizontal resistance. After struggling near USD 1,900 in July and remaining below its 100-day and 200-day EMAs, ETH broke through the key resistance zones of USD 1,930-1,950 and USD 2,170 during August.

    The chart now shows the 50-day EMA around USD 2,215, the 100-day EMA around USD 2,110, and the 200-day EMA around USD 2,182, with price trading substantially above all three. The breakout was accompanied by a sharp increase in volume, particularly through the USD 2,000-2,200 region. ETH advanced from roughly USD 1,845 at the start of August to approximately USD 2,480 by month-end.

    Momentum Indicators

    Ethereum’s RSI stands near 63.41, indicating bullish momentum without being overbought. MACD remains comfortably above zero, but the MACD line has moved slightly below its signal line, and the histogram has turned negative. This signals declining short-term momentum after the rapid rally, though price remains close to its highs.

    Technical Outlook

    Immediate resistance is USD 2,500, followed by USD 3,000. Key support is at USD 2,215-2,100, followed by USD 2,000. A confirmed breakout above USD 2,500 would establish another higher high and potentially open the path toward USD 3,000. Holding above the USD 2,100-2,200 moving-average cluster is essential to preserve the broader recovery structure.

    XRP: Major Reversal, but Momentum Cooling

    XRP experienced one of the most dramatic structural improvements of August. After spending much of July near the USD 1 psychological support, XRP surged during the second half of the month and briefly approached USD 1.60-1.70 before consolidating. The chart places XRP around USD 1.39, above its 50-day EMA (USD 1.27), 100-day EMA (USD 1.24), and 200-day EMA (USD 1.35).

    This represents a major reversal from July, when XRP remained below all three moving averages. The breakout from USD 1 was accompanied by particularly strong volume, and during the broad market surge around August 21, XRP gained nearly 40% over the week.

    Momentum Indicators

    XRP’s RSI stands near 57.13, above neutral but well below the overbought levels seen during the initial surge. MACD remains above zero, but the MACD line has moved below the signal line, with a modestly negative histogram. This suggests XRP is consolidating rather than continuing its earlier acceleration.

    Technical Outlook

    Immediate resistance is USD 1.50-1.60, followed by USD 1.90. Key support is at USD 1.35-1.30, followed by USD 1.00. Holding above the 200-day EMA near USD 1.35 is critical. A renewed move through USD 1.50-1.60 would place XRP back toward the major USD 1.90 resistance. A sustained decline below USD 1.30 would weaken the bullish structure.

    Cardano (ADA): Improved, but Still Behind

    Cardano improved during August but remained noticeably weaker than Bitcoin, Ethereum, and XRP. ADA trades around USD 0.2063, slightly above its 50-day EMA (USD 0.1989) and 100-day EMA (USD 0.2004), but remains below its 200-day EMA near USD 0.2414. The longer-term structure has not yet completed a bullish reversal.

    ADA rebounded strongly from the USD 0.138-0.150 region and briefly approached USD 0.24 before retracing. The Fibonacci structure shows price below the 0.50 retracement at USD 0.2135 and the 0.618 level near USD 0.2312. Above these, USD 0.2455-0.2564 is a larger resistance zone.

    Momentum Indicators

    Cardano’s RSI stands around 50.40, essentially neutral. MACD is slightly positive overall, but the MACD line has slipped beneath the signal line, and the histogram is negative. This points to consolidation following August’s recovery rather than immediate trend acceleration.

    Technical Outlook

    Immediate resistance is USD 0.213-0.231, followed by USD 0.241-0.256. Key support is at USD 0.196-0.200, followed by USD 0.174 and USD 0.150. A sustained move above USD 0.213 would allow ADA to challenge the USD 0.231-0.241 region. Reclaiming the 200-day EMA near USD 0.241 would provide stronger evidence of a trend reversal.

    Hyperliquid (HYPE): One of the Strongest Performers

    Hyperliquid delivered one of the best technical performances in August. The daily chart shows HYPE around USD 86.42, following a substantial rally from approximately USD 51.20 in early August. The move created a sequence of higher highs and higher lows before entering an ascending consolidation.

    HYPE now trades well above its 50-day EMA (USD 71.55), 100-day EMA (USD 65.05), and 200-day EMA (USD 56.65). The token has already cleared the 0.786 Fibonacci level (USD 70.51) and the 1.0 extension (USD 76.94), and is currently testing the 1.272 extension near USD 85.95. The next major extension sits at approximately USD 98.95, placing the USD 100 level within reach.

    Momentum Indicators

    HYPE’s RSI stands at 64.46, showing strong positive momentum without being overbought. RSI previously moved above 70 during the rally but has since cooled while price remained near highs. MACD remains firmly above zero, though the MACD line (5.90) is slightly below the signal line (6.03), indicating that the rally is slowing as HYPE consolidates.

    Technical Outlook

    Immediate resistance is USD 86-90, followed by USD 98.95-100. Key support is at USD 76.94, followed by USD 70.51-71.55 and USD 65.05. A sustained breakout above the current rising structure could allow HYPE to challenge USD 98.95. Holding above USD 76-77 preserves the broader bullish structure.

    Solana (SOL): Reclaims Key Averages

    Solana delivered a significant technical breakout during August, reversing months of weakness. The daily chart shows SOL around USD 103.62, after surging from the mid-USD 70 region during the second half of the month.

    Solana had spent much of July and early August consolidating between USD 75.63 and USD 83.50. The eventual breakout produced a rapid advance through USD 90 and the major USD 98.02 horizontal resistance. SOL briefly moved above USD 108 before settling into a consolidation around USD 100-105.

    Price now trades above all three major moving averages: the 50-day EMA (USD 90.03), the 100-day EMA (USD 85.80), and the 200-day EMA (USD 90.94). Reclaiming the 200-day EMA is particularly significant since Solana had remained below this long-term trend indicator for much of the previous decline. The breakout was accompanied by increased volume, strengthening its technical validity.

    Momentum Indicators

    Solana’s RSI stands at 62.40, indicating positive momentum without being overbought. RSI moved above 70 during the initial breakout before cooling as SOL consolidated above USD 100. MACD remains substantially above zero, reflecting the strength of August’s advance, although short-term momentum has moderated.

    Technical Outlook

    Immediate resistance is USD 108, followed by USD 120. Key support is at USD 100, followed by USD 98 and USD 90. Holding above USD 100 would keep the breakout structure intact, while a sustained move above USD 108 could open the path toward the next major resistance zone.

    Final Thoughts

    August 2026 saw a broad and technically significant rally across the cryptocurrency market. Bitcoin reclaimed all major moving averages and broke above USD 80,000, Ethereum tested USD 2,500, XRP staged a dramatic recovery, and HYPE and SOL posted strong gains. While momentum indicators suggest some short-term consolidation is likely, the broader structure has clearly improved. The critical test for September is whether these newly reclaimed support levels hold, particularly Bitcoin’s USD 70,000-73,000 moving-average cluster and Ethereum’s USD 2,100-2,200 region.


  • Uniswap (UNI) Surges Past $10 as Whale Accumulation and CME Futures Launch Fuel Rally

    Uniswap (UNI) Surges Past $10 as Whale Accumulation and CME Futures Launch Fuel Rally

    Uniswap (UNI) has broken above a year-long consolidation base, surging more than 15% past the $10 mark. The rally is driven by significant whale buying and CME Group’s announcement of regulated Uniswap futures, set to launch on October 19.

    Tracked whale wallets have accumulated nearly $4 million worth of UNI through on-chain transactions, coinciding with the breakout. Meanwhile, CME Group confirmed plans to introduce standard and Micro Uniswap futures, pending regulatory review. The standard contract will represent 10,000 UNI, while the Micro contract will cover 1,000 UNI.

    The technical breakout broke through a rounding-bottom formation that had contained price action for months. The next key resistance level sits at $12.0532, while $9.2734 remains crucial support that buyers must defend if the rally retraces.

    Whale buying occurred through identifiable wallet activity rather than exchange order flow, reinforcing the strength of the move. The breakout followed a period of consolidation, not a single-session spike, adding technical credibility to the rally.

    CME Group’s expansion into Uniswap futures is part of a broader push into altcoin derivatives. The exchange reported average daily crypto futures and options volume of 279,800 contracts in the first half of 2026, representing $8.3 billion in notional value. Altcoin futures for Cardano, Chainlink, Stellar, Avalanche, and Sui have collectively generated over $1 billion in year-to-date notional volume.

    Giovanni Vicioso, CME Group’s Global Head of Cryptocurrency Products, noted that market participants increasingly need regulated tools for managing digital-asset price risk. The new contracts will trade on Globex, with around-the-clock cryptocurrency trading available since May 29.

    Bitcoin Cash (BCH) also reacted sharply to the announcement, climbing from $270 to $328 on Binance within 90 minutes. UNI traders are now watching the $12.0532 resistance and $9.2734 support levels closely.

  • Rolls-Royce Share Price Analysis: Stock Nears 1,500 Pence on Strong Momentum and Upgraded Profit Forecasts

    Rolls-Royce Share Price Analysis: Stock Nears 1,500 Pence on Strong Momentum and Upgraded Profit Forecasts

    Key Takeaways

    • Rolls-Royce shares reached 1,502.2 pence, with 1,510.0 pence as the next key resistance level.
    • The company raised its 2026 core profit target to EUR 4.7–4.9 billion, up from EUR 4.0–4.2 billion.
    • RSI at 68.70 indicates strong short-term momentum, with 1,494.2 pence as a nearby support level.

    Price Movement Reaches a Key Zone

    Rolls-Royce Holdings shares are trading near the 1,500 pence mark after a sharp rebound. A 15-minute TradingView chart taken at 11:45 a.m. India time on September 22 shows the stock at 1,502.2 pence, with an open of 1,499.0, a high of 1,502.8, a low of 1,498.4, and a gain of 3.4 pence (0.23%). The recovery from a low of 1,439.8 pence has pushed the stock through several levels: 1,472.0, 1,481.4, 1,484.0, and 1,494.2. The next notable resistance level lies at 1,510.0 pence.

    RSI Reflects Strong Momentum

    The lower chart panel shows a Relative Strength Index (RSI) of 68.70, well above its moving average of 59.33. The RSI has climbed from the low 30s to the upper 60s during the recent rally, confirming strong short-term upward force. A move above 70 would signal even stronger momentum, while a drop below 59.33 would indicate waning strength.

    Volume Adds Context

    Part-session volume stands at 411,940 shares at the time of the snapshot. Recent full-session figures include 36.28 million shares on September 18, 35.25 million on September 16, and 24.16 million on September 21, when the stock closed at 1,504.80 pence after a 3.78% gain. Final daily volume will be important to confirm the strength of the move.

    Higher 2026 Targets Support the Bull Case

    Rolls-Royce reported a 46% rise in first-half underlying operating profit to GBP 2.5 billion and free cash flow of GBP 2.0 billion. The company raised its 2026 core profit target to GBP 4.7–4.9 billion from GBP 4.0–4.2 billion, and its free cash flow range to GBP 3.8–4.0 billion from GBP 3.6–3.8 billion. The company completed GBP 1.4 billion of its planned GBP 2.5 billion 2026 share buyback by mid-year. Stronger long-term service agreement margins, contract catch-ups in Civil Aerospace, better power-generation profit, and stronger Defense aftermarket profit were cited as key drivers.

    New Aerospace and Defense Projects

    On September 18, the EU’s Clean Aviation program selected Rolls-Royce’s German unit to lead the ELEVATED project, which targets a hybrid-electric gas-turbine propulsion system for future short- to medium-range aircraft. The project aims for at least a 20% reduction in aircraft-level CO2 emissions. The company also completed a USD 1 billion investment in its Indiana facility, received U.S. Navy certification for MTU engines in autonomous naval vessels, and announced a strategic intent with Reliance Industries to develop an indigenous combat engine for India’s Advanced Medium Combat Aircraft program. The nuclear small modular reactor business continues to win competitive tenders, and the company paid an interim dividend of 6.0 pence, up from 4.5 pence a year earlier.

    Key Levels to Watch

    The immediate chart range is between 1,494.2 and 1,510.0 pence. A hold above 1,494.2 would keep the recent structure intact, while a break above 1,510.0 would bring the stock closer to its 52-week high of 1,585.20 pence. On the downside, a fall through 1,484.0 and 1,481.4 would shift focus to 1,472.0 and 1,460.2. Traders should monitor daily volume and the RSI trend for the clearest short-term signals.

    FAQs

    What is the latest Rolls-Royce share price? The TradingView snapshot shows 1,502.2 pence at 11:45 a.m. India time on September 22, 2026.

    What is the next key resistance level? The chart shows 1,510.0 pence as the next major level above the current price.

    What is Rolls-Royce’s 2026 profit target? Rolls-Royce raised its 2026 core profit target to EUR 4.7–4.9 billion.

    What does the RSI indicate? The RSI stands at 68.70, reflecting strong recent price momentum.

    What key levels should traders watch? The chart highlights 1,510.0, 1,494.2, 1,484.0, 1,481.4, and 1,472.0 pence as important reference levels.

  • Solana Memecoins BONK and WIF Surge After Upbit Delisting, but Resistance Looms

    Solana Memecoins BONK and WIF Surge After Upbit Delisting, but Resistance Looms

    On September 22, Solana-based memecoins BONK and WIF rallied sharply, supported by robust trading volume, even as the market digested BONK’s removal from Upbit’s KRW and USDT markets earlier in the month. BONK climbed 17.92% to $0.0000036, while WIF gained 21.7% to $0.2483, outperforming broader meme tokens like DOGE, PEPE, and SHIB.

    Technical indicators show BONK breaking above its 20-day ($0.00000337) and 50-day ($0.00000316) moving averages, as well as the Ichimoku Kijun level at $0.00000331. Momentum signals such as MACD, ADX, and the Awesome Oscillator turned bullish, and RSI reached 66.6. However, Stoch RSI and CCI entered overbought territory, suggesting a potential short-term pullback. Crucially, BONK remains below its 200-day moving average at $0.00000462, a key resistance level.

    The rally came despite BONK being delisted from Upbit’s KRW and USDT markets on September 7 due to an unresolved review. Upbit continues to support withdrawals until October 7, giving holders time to transfer assets. This delisting still poses liquidity challenges for BONK.

    Data from CoinGecko and BSCNews showed strong volume: BONK at $106.7 million and WIF at $152.8 million (nearly 61% of its market cap). The price action varied slightly across snapshots, highlighting the volatile nature of memecoins during high-volume sessions.

    Indian crypto traders can monitor BONK and WIF on major global exchanges as both tokens maintain outperformance relative to the broader market. The next price moves will likely depend on volume sustainability and BONK’s ability to overcome the MA-200 resistance.

  • Peter Brandt Highlights $5.40 XRP Price Target as 2026 Correction Reshapes Long-Term Outlook

    Peter Brandt Highlights $5.40 XRP Price Target as 2026 Correction Reshapes Long-Term Outlook

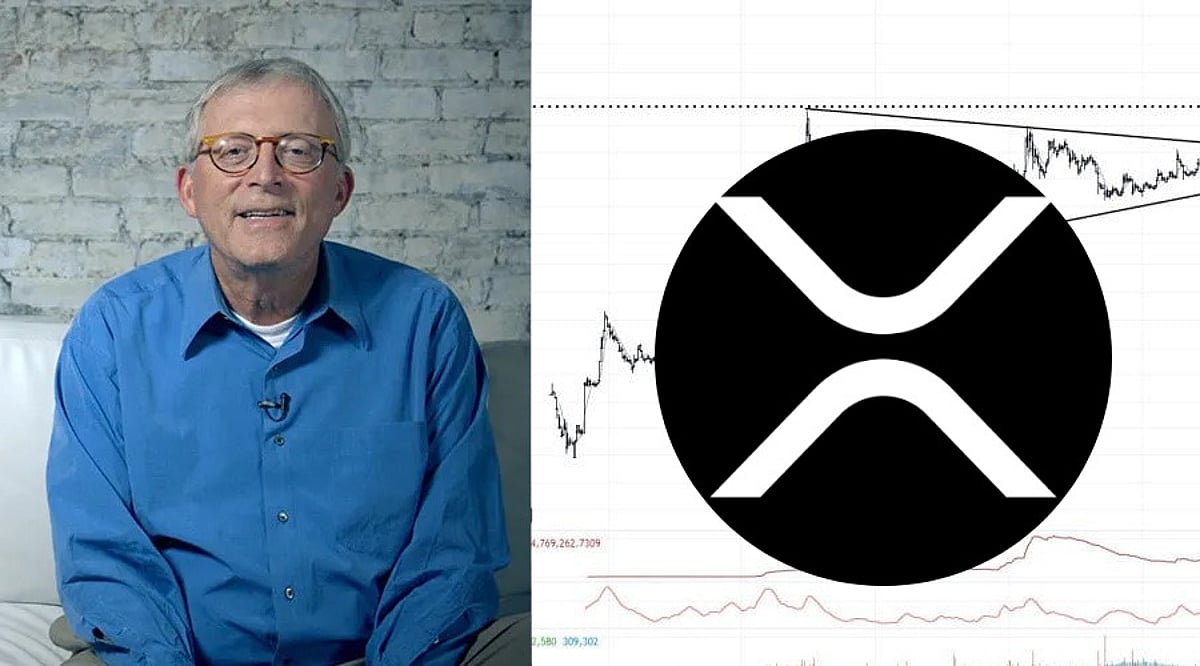
    Veteran trader Peter Brandt has pointed to $5.40 as a potential long-term target for XRP in a monthly chart shared on September 21. The projection is based on a technical structure that has formed over nearly a decade, although Brandt did not specify a timeline for the move.

    What the Monthly Chart Shows

    Brandt’s XRP/USD chart tracks roughly ten years of price action and highlights both a rising support line and a descending resistance line. The resistance line begins at the 2018 cycle peak, while support has been drawn from lows recorded in 2020 and subsequent pullbacks.

    Between those two boundaries, XRP spent several years compressing in a broad range. The 2021 rally produced a high below the 2018 peak, keeping the downward-sloping resistance intact. That pattern eventually led to a breakout in 2024–2025, with monthly candles climbing toward the $3.00–$3.50 zone — the highest sustained area since 2018.

    Current Price Position

    After the sharp advance, XRP entered a correction in 2026. The latest part of the chart shows a pullback unfolding in a smaller descending channel or wedge. In September 2026, XRP was trading near $1.4901, roughly 20.6% below its 18-month moving average of about $1.877. A faster moving average sits closer to price, but the longer-term trend measure remains above the token.

    Interpreting the $5.40 Objective

    Brandt described $5.40 as an eventual technical objective rather than an active trade. The figure is not drawn as a horizontal line directly on the chart, and the trader did not provide a completion date.

    From the chart’s displayed price near $1.49, XRP would need to gain approximately 262% to reach $5.40. Based on the slightly higher market price near $1.54, the required advance would be about 251%, placing the target at roughly 3.5 times the reference price.

    XRP was reported near $1.54 after gaining around 8.7% in 24 hours as Brandt’s chart drew attention. Even so, the token remains far below the projected level. The key tension in the setup is that XRP is still under its 18-month moving average and trading inside a declining structure from the 2025 highs, even as the broader multi-year formation supports a much higher long-term target.

    Brandt’s use of the word “eventual” leaves the timing open. For traders watching the trend, the main question is whether the current descending structure resolves before the next major monthly advance begins.

  • Raydium (RAY) Price Rally Gains Steam on Buyback Program and Rising Trading Volumes

    Raydium (RAY) Price Rally Gains Steam on Buyback Program and Rising Trading Volumes

    Raydium’s native token, RAY, is extending its recent rally, driven by a protocol buyback, higher trading volumes, and renewed investor interest in the Solana-based decentralized exchange. The token’s price action remains constructive as it holds above key technical levels, while traders watch whether LaunchLab activity can fuel further upside.

    Buyback Mechanism Adds Direct Market Demand

    On September 9, Raydium implemented a buyback program that directs 12% of protocol commissions toward RAY purchases. This mechanism ties the platform’s operating activity directly to token demand, channeling a portion of trading revenue back into the market. The buyback also reduces the available token float, which can support Raydium’s incentive structure over time.

    As trading activity increases, the protocol generates more fees, and a share of those fees returns to the market as buyback demand. This self-reinforcing cycle has been particularly visible in recent days, with daily RAY trading volume running about 43% above its 30-day average.

    LaunchLab Activity Adds Momentum

    Beyond the buyback, Raydium’s LaunchLab platform is contributing to renewed interest. Earlier this month, StonkFun migrated new token deployments to Raydium’s LaunchLab, a shift that directs more trading activity and liquidity through Raydium’s infrastructure. According to information cited by BeInCrypto, the migration reduced deployment costs from 0.29 SOL to 0.03 SOL.

    In addition, more than 15 tokenized US equities entered the broader Raydium-linked trading ecosystem. These developments expanded on-chain activity as RAY moved higher, eventually reaching an 11-month high near USD 1.75 on September 11.

    Technical Signals Keep Buyers in Control

    RAY/USD is currently holding above immediate support near the Ichimoku Kijun level at USD 1.3616. Maintaining this area preserves the short-term recovery structure. A decisive break below it could expose lower levels within the current forecast range.

    Momentum indicators remain broadly positive. MACD and ADX are in buy territory, RSI sits in a neutral-to-bullish zone, and CCI points to sustained buying pressure. Intraday Bull/Bear Power also shows buyers are in control. However, Stochastic RSI is neutral, and the Awesome Oscillator has not provided additional confirmation of the uptrend. Price is currently trading near the day’s low, creating a short-term divergence between technical readings and intraday performance.

    The first major upside hurdle stands near USD 1.50. A decisive break above that level could bring the September highs around USD 1.75 to USD 1.79 back into focus.

    Price Forecast Depends on Sustained Activity

    Over the next two to three trading days, RAY/USD is expected to trade between USD 1.2674 and USD 1.7125. The forecast assigns a 70% probability to a higher move, while the baseline case favors consolidation within that band.

    If buyers clear resistance, price could accelerate toward the upper boundary of the forecast range. Conversely, a break below immediate support could trigger retests of lower levels within the same zone.

    The key question is whether higher LaunchLab activity can keep feeding the buyback cycle long enough to sustain the rally. Continued trading volume would generate more fees and support further RAY purchases. If activity weakens, that automatic source of demand could diminish, leaving RAY more exposed to profit-taking following its sharp September advance.

    Broader Solana performance and overall crypto market risk appetite will also shape RAY’s next move. For now, trading activity, buyback demand, and support near USD 1.3616 remain the main factors influencing short-term price action.

  • Ethereum Breaks Above $2,600 as ETF Inflows and Short Liquidations Fuel Rally

    Ethereum Breaks Above $2,600 as ETF Inflows and Short Liquidations Fuel Rally

    Ethereum surged past the $2,600 mark on Friday, reaching $2,660—its highest level since January—driven by a combination of sustained ETF inflows and a wave of short liquidations. The move outpaced other major cryptocurrencies, with Ethereum gaining over 8% in 24 hours on Coinbase, while Bitcoin rose only 2.7%, Solana 5.3%, and XRP 4.2%. The broader crypto market ticked up 1.1% to around $2.75 trillion.

    ETHA Inflows Continue Unabated

    BlackRock’s Ethereum ETF, ETHA, recorded $251.4 million in net inflows over 20 consecutive trading days, with no outflows during the period. On September 11 alone, Ethereum ETFs saw $216 million in net inflows, according to Cryptobriefing, as institutional investors rotated capital away from Bitcoin ETFs. This steady demand has been a key pillar supporting Ethereum’s recent price strength.

    Short Liquidations Amplify the Move

    The rally was further fueled by a significant short squeeze. Crypto liquidations totaled roughly $665 million over 24 hours, with about $400 million in short positions being wiped out. Ethereum accounted for around $250 million of that total, compared to Bitcoin’s $170 million. The forced buying from liquidated shorts added momentum to the upward price action.

    Technical Signals Remain Mixed

    Despite the sharp rebound, technical indicators present a nuanced picture. On the hourly chart, Ethereum traded above the MA-50 but below the MA-20, while the daily chart showed the price above the MA-200. The Ichimoku Kijun stood at $2,549, with support near $2,453. MACD indicated strong bullish momentum, but ADX remained neutral, suggesting limited trend strength. RSI was at 50.03 with a Buy reading, while Stoch RSI showed oversold conditions. Before the breakout, ETH was contained in a $2,453–$2,569 range, with a 62% probability of an upward move above $2,549—a level it decisively cleared.

    Macro Context

    The rally followed a hotter-than-expected August core CPI reading, which rose 0.3% monthly and 2.4% annually. This boosted market pricing for a Federal Reserve rate hike, with CME FedWatch showing an 88% probability. Despite this, Ethereum’s price showed resilience, supported by strong ETF demand and the short squeeze. Analysts like Tom Lee had earlier predicted a softer inflation setup to fuel a market rally, but the actual data did not dampen crypto spirits.

    Outlook

    Ethereum’s ability to sustain above $2,600 will depend on continued ETF inflows and macro factors. The $2,453 support level remains key if momentum fades, while near-term resistance may appear as the market digests the recent gains. Institutional demand and Federal Reserve policy decisions remain central to the near-term trajectory.