Tag: Technical Analysis

  • Dogecoin Price Analysis: Can DOGE Bounce Back After Dogechain’s Closure?

    Dogecoin Price Analysis: Can DOGE Bounce Back After Dogechain’s Closure?

    Dogecoin recently faced fresh uncertainty after the shutdown of Dogechain, a blockchain project that expanded DOGE’s utility through NFTs, decentralized finance, staking, and smart contracts. Since the original Dogecoin network does not support these advanced features, Dogechain played a critical role in providing additional use cases. Its sudden closure has raised concerns about Dogecoin’s ability to recover and sustain long-term growth.

    Why Dogechain Was Important for Dogecoin

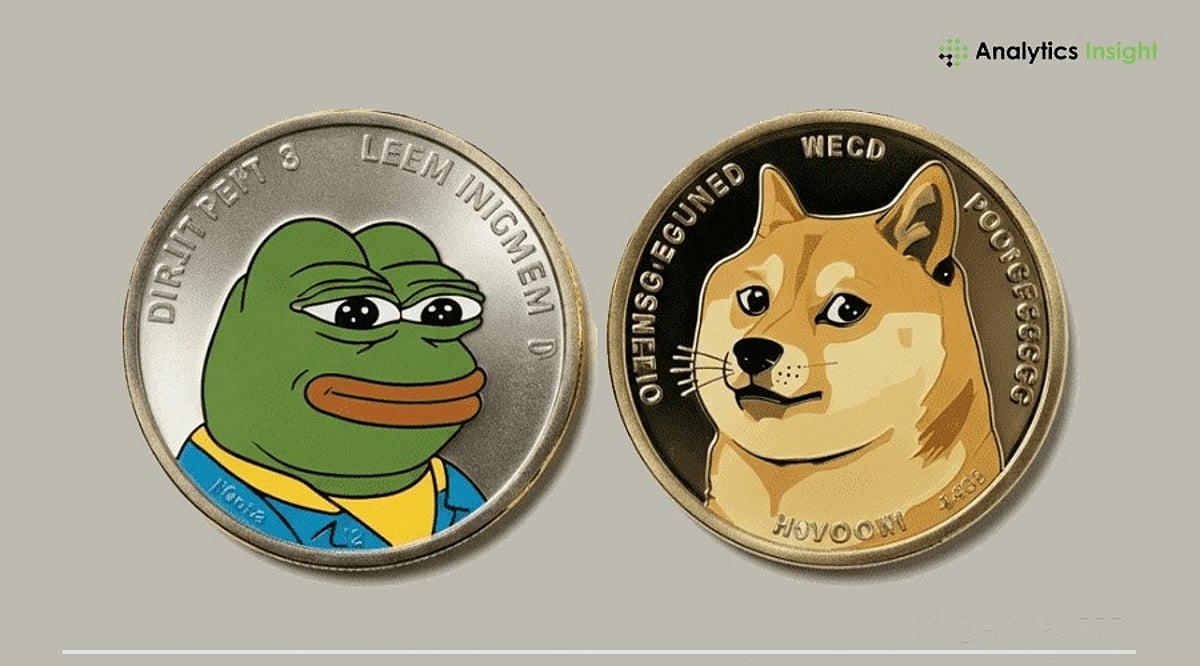
    Dogecoin started as a meme coin and later became one of the most popular cryptocurrencies. Despite its popularity, the network has always lacked the advanced blockchain features that projects like Ethereum and Solana offer. Dogechain addressed this by allowing DOGE holders to use their coins in decentralized applications, NFT marketplaces, and staking platforms, giving Dogecoin access to Web3 services that were previously unavailable. With its shutdown, that extra utility has disappeared, pushing Dogecoin back toward its original identity as a payment-focused meme coin without strong ecosystem development.

    Current DOGE Price Performance

    As of late June 2026, Dogecoin price remains under pressure, trading between $0.074 and $0.076 with weak market momentum. The coin has seen a correction over recent weeks as the broader crypto market struggled to build a recovery. Current data shows DOGE near $0.07 to $0.08, with a market capitalization of about $11.2 billion and daily trading volume around $460 million. The circulating supply has reached nearly 154.8 billion DOGE.

    Why Recovery Still Looks Possible

    While the Dogechain shutdown has damaged short-term confidence, several factors could support a price recovery. Dogecoin’s large and dedicated community remains one of its biggest strengths, having supported the project through various market cycles. Whale activity also shows positive signs — recent blockchain data reveals whale transactions hit a six-month high, with large holders controlling more than 108 billion DOGE, indicating steady accumulation by major investors.

    The overall crypto market trend could also help. Historically, Dogecoin follows Bitcoin’s price movements closely; if Bitcoin enters a bullish phase, DOGE often sees renewed demand from retail traders. Additionally, Elon Musk’s ongoing public connection with Dogecoin continues to keep the coin visible and popular among traders worldwide.

    Technical Price Levels to Watch

    From a technical perspective, Dogecoin now sits near a critical support zone. The first major support level is at $0.070. If selling pressure increases, the next support sits near $0.067, followed by a lower zone at $0.060. On the upside, the first resistance level is around $0.085. Breaking $0.090 would be needed before any move toward $0.100 becomes plausible. Analysts highlight the 200-day moving average near $0.085 as the most important level for any short-term bullish recovery — a move above this could reignite buying interest.

    Long-Term Future of Dogecoin

    Dogecoin still faces a major structural challenge: unlike Bitcoin, it has no maximum supply limit. Approximately 5 billion new DOGE enter circulation each year, creating constant inflationary pressure. With the circulating supply already close to 154 billion, this makes long-term price growth more difficult compared to cryptocurrencies with finite supplies.

    Predictions remain mixed. Some analysts expect DOGE to recover toward $0.15–$0.20 if the crypto market enters a strong bull run in the next cycle. More aggressive forecasts suggest higher targets, but meme-based assets remain highly unpredictable.

    Why This Matters

    The removal of Dogechain’s infrastructure strips Dogecoin of vital decentralized utilities like staking and NFTs. While strong community backing prevents an immediate crash, returning solely to a payment-based asset increases its reliance on unpredictable retail sentiment and speculative social trends.

    Final Outlook

    The Dogechain shutdown has created a setback for Dogecoin, weakening short-term confidence and raising fresh concerns about utility and future development. At the same time, Dogecoin continues to benefit from strong community support, rising whale accumulation, and overall crypto market trends. For now, $0.067 remains the key support level, while a move above $0.090 could confirm a stronger recovery. Dogecoin faces pressure at present, but the possibility of recovery remains alive in the coming months.

  • Microsoft Stock on Track for Worst Monthly Drop Since 2000 as AI Spending Surge Eclipses Strong Earnings

    Microsoft Stock on Track for Worst Monthly Drop Since 2000 as AI Spending Surge Eclipses Strong Earnings

    Microsoft Corp. is heading toward its weakest monthly stock performance in more than two decades, even as the company continues to report steady revenue growth and earnings that exceed Wall Street expectations. Investors have shifted their attention from quarterly results to the rising cost of expanding artificial intelligence infrastructure.

    AI Investment Costs Overshadow Earnings Beat

    Microsoft has delivered year-over-year revenue growth of 16% to 18% for eight consecutive quarters and consistently beaten analyst earnings estimates. Yet these strong results have done little to support the share price. The market is now laser-focused on spending rather than revenue.

    Capital expenditure has become the primary metric investors watch. Microsoft spent approximately $38 billion on capital projects in the latest quarter, much of it directed toward expanding AI data centers. Bank of America estimates the company’s capital spending could approach $190 billion in 2026. This surge is not unique to Microsoft—Amazon, Alphabet, Meta Platforms, and Oracle are also pouring billions into AI infrastructure, with combined spending by the five largest hyperscale cloud providers projected to exceed $700 billion in 2026.

    As more companies build data centers, demand for advanced chips and memory continues to rise, driving up equipment costs and extending investment cycles. Investors are now questioning how quickly these projects can generate meaningful financial returns.

    Cash Flow and Shareholder Returns Under Pressure

    Microsoft’s capital spending increased 63% from a year earlier, while free cash flow declined 10%. With more operating cash funneled into infrastructure, less remains available for share repurchases and dividend growth. Bank of America notes that hyperscaler capital spending has risen from roughly 70% of operating cash flow in 2025 to nearly 100% in 2026, raising concerns that large technology companies may have fewer resources for direct shareholder returns while AI investment remains elevated.

    Stifel lowered its Microsoft price target to $400, forecasting that Azure’s expansion will reduce gross margins by 100 to 150 basis points each quarter through fiscal 2027. Analysts estimate Microsoft’s fiscal 2027 gross margin could fall to about 63%, and earnings per share may trail actual results if spending continues at the current pace.

    Meanwhile, semiconductor companies have benefited from the AI investment cycle. Since January, the semiconductor sector has outperformed many large technology stocks as demand for AI hardware continues to increase.

    Technical Levels Under Scrutiny

    Technical analysts are also watching Microsoft’s stock price action closely. John Roque, a technical strategist at 22V Research, noted that the stock has struggled to stay above its 200-day moving average after repeated failures near resistance levels. He warned that a break below long-term support around $350 could trigger further weakness. “A break below $350 would, on his math, open the path to $250 — measured down from the stock’s failure near $450 in early June,” Roque said. That projection represents roughly 30% below recent trading levels, though it remains a technical scenario rather than a forecast.

    Outlook: AI Returns Remain the Key Question

    Current market conditions draw comparisons to earlier technology investment cycles, including the period following the dot-com boom. Many investors continue to monitor whether Microsoft’s expanding AI business, cloud platform, and related services will eventually generate returns that justify the record level of infrastructure spending. Until then, AI investment costs remain one of the biggest drivers of sentiment surrounding the company’s stock.

  • XRP Defends $1 Support as Holder Losses Reach 2022 Bear Market Levels – Price Analysis

    XRP Defends $1 Support as Holder Losses Reach 2022 Bear Market Levels – Price Analysis

    XRP is holding the critical $0.93–$1.00 support zone after another steep weekly decline, while on-chain data shows holder losses matching levels last seen during the 2022 crypto bear market. Despite the bearish sentiment, analysts see a potential recovery toward $5–$8 if buyers reclaim major resistance levels.

    XRP’s $0.93 Support Becomes the Main Price Test

    Buyers reacted near $1.0079 this week, preventing an immediate break below the psychological $1 level. That response preserved the existing recovery setup, although the market has not confirmed a reversal. The wider support zone runs from $0.93 to $1.00, aligning with earlier breakout levels, a long-term rising trend line, and a Fibonacci extension followed by technical traders.

    Can XRP hold this zone long enough to rebuild momentum? A decisive close below $0.93 could weaken the bottoming structure and expose the next support area near $0.80. On the upside, XRP first faces resistance near $1.15. Bulls would then need to reclaim $1.40 before testing the stronger barrier between $1.70 and $1.90.

    Realized Losses Return to 2022 Bear-Market Levels

    Glassnode data shows XRP’s 90-day Realized Profit/Loss Ratio near 0.33. The reading matches 2022 bear-market levels and indicates that holders are selling more coins at a loss. The ratio compares the value of coins sold at a profit with those sold at a loss. Readings above one favor realized gains, while readings below one indicate greater losses. XRP’s ratio first fell below one in April 2026, when the token traded between $1.30 and $1.40. It later reached 0.38 in early June before declining again.

    Still, the indicator does not confirm a market bottom. During the 2022 downturn, the ratio fell below 0.20 before XRP continued lower toward $0.31.

    Analysts Map a Possible Fifth-Wave Recovery

    Analyst Dark Defender says XRP may be nearing the end of a wave-four correction around $0.93. That level closely matches the support zone that buyers currently defend. His weekly chart also places the Relative Strength Index near 29, which reflects oversold conditions. Under his Elliott Wave count, a fifth-wave advance could target $5.86 and then $8.78. The analyst also maps a longer-term target near $18.23—though that scenario requires a multi-year expansion and remains highly speculative.

    Mikybull Crypto also tracks a possible capitulation phase near XRP’s rising trend line from the 2020 market bottom. His chart places XRP near a major Fibonacci retracement and below the Ichimoku Cloud. His longer-term projection points to the $5–$8 range if XRP holds the trend line. Before then, the token must defend support, reclaim $1.40, and clear resistance between $1.80 and $1.90. A break above those levels could return attention to the previous cycle high near $3.60. A support failure could instead send XRP toward $0.80 before another recovery attempt.

    What’s Next?

    XRP remains at a decisive point as buyers defend the $0.93–$1.00 support zone while holder losses reach 2022 bear-market levels. A recovery above $1.40 could strengthen the bullish outlook, but losing $0.93 may expose $0.80. Traders should closely monitor these levels before expecting a sustained rebound.

  • XRP Active Addresses Jump 72% as Bulls Defend $1 Support Level

    XRP Active Addresses Jump 72% as Bulls Defend $1 Support Level

    XRP is attracting fresh market attention after a sharp rise in network activity, even as the cryptocurrency continues to trade close to an important support level. Data from Santiment showed daily active addresses increased from about 23,000 on June 14 to nearly 39,500 by June 27.

    Technical signals remain mixed. XRP still trades below key moving averages although some chart patterns suggest selling pressure may be starting to ease. Market participants are now watching whether buyers can defend support around the $1.04 to $1.06 range.

    Active addresses rise as XRP holds key support

    Daily active addresses climbed by roughly 72% over two weeks, according to data shared by crypto analyst Ali Martinez, based on Santiment metrics. The increase reflects more wallets interacting with the XRP Ledger during a period when the token continued trading near $1.05. Higher blockchain activity suggests that more users are active on the network.

    In addition, market analysts point to accumulation by large holders during the recent market decline. However, weak sentiment across the broader cryptocurrency market has continued to weigh on XRP. Furthermore, the token remains well below the price levels it traded at earlier this year.

    Some analysts stated that XRP price may be forming a base instead of extending its decline. They noted that holding above the psychological $1 support remains important for the current market structure.

    Technical signals point to possible recovery

    Several technical indicators now suggest that selling pressure may be slowing. Analysts identified a Tom DeMark Sequential buy signal together with a Morning Star Doji pattern on the daily chart. These formations often appear after extended declines although they do not guarantee a reversal.

    Analysts also noted that XRP needs to establish support between $1.07 and $1.10 before buyers can target higher resistance levels. A sustained move above that range could shift attention toward $1.15, followed by $1.21 and possibly $1.30 if buying volume strengthens.

    The Relative Strength Index has also moved closer to oversold territory. Crypto analyst CryptoLlica said the indicator reached its lowest reading in more than 13 years. According to the analyst, “the RSI has reached its most oversold level since XRP launched.” Market participants continue monitoring whether this condition leads to renewed buying interest.

    Despite these signals, XRP remains below its 50-day and 200-day simple moving averages. These levels indicate that the broader trend has not yet turned bullish.

    Analysts focus on resistance levels and market catalysts

    Open interest in XRP derivatives has declined from about $1.18 billion to nearly $1.04 billion. Funding rates have also turned negative after recent long liquidations reduced leveraged positions. Analysts said the reset could reduce downside pressure if spot demand improves.

    Technical indicators still show limited momentum. The MACD remains close to neutral, while the Stochastic Oscillator and Ultimate Oscillator suggest the market has not yet established a clear direction. As a result, traders continue watching the $1.04 to $1.06 support zone for confirmation of the next move.

    Market forecasts also remain conditional. According to an analysis, “if XRP holds above the $1 support while network activity continues rising, the price could move toward the $1.20 to $1.35 range.” The same outlook noted that a break below $1 would weaken the recovery scenario.

    Beyond price action, analysts are also monitoring developments surrounding tokenized real-world assets. Reports estimate that the XRP Ledger hosts about $330 million in tokenized RWAs, while Stellar manages a much larger share of that market. Traders are also watching the proposed CLARITY Act in the United States which could become another factor influencing institutional sentiment if lawmakers advance the legislation in July.

  • Bitcoin Drops to $60,000: Heavy Selling Pressure Grips Crypto Market

    Bitcoin Drops to $60,000: Heavy Selling Pressure Grips Crypto Market

    Bitcoin has entered a difficult phase after a strong rally in 2025. At the end of last year, Bitcoin touched a record high of $126,000, which created huge excitement across the crypto market. However, the current situation has sharply changed.

    As of 29 June 2026, Bitcoin trades near $59,500 to $60,500. This shows a major fall compared to previous highs. Since the start of 2026, Bitcoin has already lost more than 30% of its value. The market now faces fear and uncertainty as investors closely watch the next possible move.

    The sharp fall has created an important question in the market. Many traders now wonder whether Bitcoin has reached its lowest point for now or whether prices may fall even further in the coming weeks.

    Recent Performance Shows Weak Market Sentiment

    The first half of 2026 has been difficult for Bitcoin. During June, sellers gained strong control and pushed prices lower. Bitcoin recently fell under the important $60,000 price level, even touching nearly $59,501 during recent trading sessions.

    This price level has become important because investors usually see round numbers like $60,000 as major support zones. Once price falls below such levels, market confidence often becomes weak.

    Only one month ago, Bitcoin traded close to $81,500. The move from $81,500 to below $60,000 means Bitcoin has lost more than 22% in just one month. Compared with mid-2025, Bitcoin now trades almost 40% lower, which clearly shows how much market sentiment has changed.

    Technical Charts Show Important Warning Signs

    Technical analysis currently shows mixed signals. Bitcoin is now near an important support area between $58,000 and $60,000. This zone will likely decide the next short-term direction.

    The Relative Strength Index (RSI) is in neutral territory. This usually means neither buyers nor sellers fully control the market. At the same time, the MACD indicator recently showed bearish divergence, which often signals weaker price strength.

    The 200-day moving average, however, still points upward. This suggests that although short-term pressure is strong, the long-term market structure has not fully broken yet.

    If Bitcoin fails to move back above $60,000 soon, analysts expect another fall toward $55,000. Some experts even believe price may test $46,000 if selling pressure increases further.

    Institutional Investors Pull Money Out

    One major reason behind Bitcoin’s weakness comes from large investors pulling money out of the market. Reports show around $4.5 billion left spot Bitcoin ETFs in recent months.

    Spot Bitcoin ETFs had earlier helped bring major institutional money into crypto markets. But recent outflows show that large investors have become cautious.

    Higher global interest rates have also hurt Bitcoin demand. Many investors now prefer safer assets such as gold and traditional investments instead of risky digital assets.

    Another concern comes from Bitcoin mining companies. Current mining costs have increased sharply, and several miners now spend more money producing Bitcoin than current market prices allow. This creates extra selling pressure because miners often sell holdings to cover losses.

    Regulation Problems Continue to Create Uncertainty

    Government regulation is another major issue for the crypto market. In the United States, delays around the proposed US Clarity Act have created fresh uncertainty.

    This law aims to create clear rules for cryptocurrency markets. Without proper regulations, many institutions are hesitant about increasing crypto investments.

    Large financial firms such as Morgan Stanley and Charles Schwab have expanded crypto services during 2026. Even with this progress, unclear regulations continue to slow overall market confidence.

    Future Outlook

    Despite short-term weakness, many analysts still believe Bitcoin has strong long-term potential. Forecasts from Binance suggest Bitcoin could recover toward $68,000 to $105,000 during the second half of 2026 if market conditions improve.

    Research from Bitcoin Suisse presents an even stronger forecast. According to this report, Bitcoin may reach nearly $180,000 during the next major bull cycle, with increasing institutional adoption and stronger market liquidity.

    At the same time, bearish analysts are cautious. They believe weak economic conditions and poor investor confidence may delay any major recovery until late 2026.

    Final Thoughts

    Bitcoin currently stands at one of its most important price zones this year. After a steep fall from $126,000 to nearly $60,000, market confidence has weakened sharply.

    A move above $65,000 could help restore bullish momentum and bring fresh buying interest. On the other hand, failure to defend current levels may push Bitcoin toward $55,000 or even lower.

    Even though short-term pressure is strong, Bitcoin still holds its position as one of the most closely watched financial assets in the world. The second half of 2026 will likely decide whether the market begins recovery or faces another major correction.

    FAQs

    1. Why has Bitcoin price fallen in 2026?
    Large investor outflows, weak market sentiment, and global economic pressure have pushed prices lower.

    2. What is Bitcoin’s current price level?
    As of 29 June 2026, Bitcoin trades near $59,500 to $60,500.

    3. Why is $60,000 an important level for Bitcoin?
    This price zone acts as major support, and a breakdown could trigger further decline.

    4. Can Bitcoin recover this year?
    Some analysts expect recovery toward $68,000 to $105,000 if market conditions improve.

    5. What is the long-term Bitcoin forecast?
    Certain market reports suggest Bitcoin may reach $180,000 during the next major bull cycle.

    Disclaimer: This article is provided for informational purposes and does not constitute investment advice. You are responsible for conducting your own research before making any investments.

  • XRP Shows Early Recovery Signs After June Drop as Bullish Patterns and ETF Inflows Emerge

    XRP Shows Early Recovery Signs After June Drop as Bullish Patterns and ETF Inflows Emerge

    XRP is flashing early recovery signals after plummeting more than 20% in June. The token briefly dipped near $1.01 amid a broader crypto sell-off that pushed traders into safer positions. Despite marking its weakest monthly performance since February 2025, several technical indicators, consistent exchange-traded fund (ETF) inflows, and a historically strong July performance are giving traders reason to watch closely. However, analysts caution that the setup ”does not confirm a full reversal” as XRP trades near key support levels.

    Technical Indicators Suggest Selling Pressure Is Easing

    Crypto analyst Ali Martinez reported that the Tom DeMark Sequential indicator has flashed a buy signal on XRP’s daily chart. This tool is used to identify when a trend may be nearing exhaustion after a sustained move in one direction. According to Martinez, similar signals on XRP have occasionally preceded rebounds lasting between one and four daily candles. However, the indicator only points to a possible short-term recovery—it does not confirm a lasting bottom.

    XRP has also formed a Morning Star Doji pattern across three daily candles, a classic reversal pattern that appears after a steep decline when selling pressure weakens and buyers begin to step in. Martinez noted that the combination of these two signals suggests sellers ”may be losing control,” but further confirmation is still required.

    For a recovery to gain traction, XRP needs stronger trading volume and a move above nearby resistance. The first barrier sits near $1.10. A confirmed break above that level could open the door to $1.15 and then $1.20.

    XRP ETF Inflows Top $15 Million as Total Assets Reach $934 Million

    US-listed spot XRP ETFs recorded $15.63 million in daily net inflows on June 26, according to SoSoValue data. Total net assets across the funds reached $934.26 million while XRP traded near $1.05. Bitwise led with $11.66 million in inflows, followed by Franklin’s XRPZ fund at $3.97 million. Products from Canary, 21Shares, and Grayscale reported no daily net inflows.

    Bitwise also held the largest share of XRP ETF assets, with $293.49 million, while Franklin’s XRPZ held $235.20 million and Canary’s fund held $234.97 million. The inflows indicate that some investment demand remained active despite the June decline, though ETF activity alone cannot determine XRP’s next price move. Traders are also watching broader market conditions, Bitcoin’s direction, and liquidity.

    Bulls Defend $1.05 as July History Offers Cautious Optimism

    XRP traded near $1.06 on the four-hour chart, with buyers defending the $1.05 area. The broader $1.00 level also held as a key support during the latest decline. A move above $1.10 could support a recovery toward $1.15, and additional buying might then target $1.20. Martinez identified $1.30 as a larger goal, though XRP previously faced strong selling near that price.

    Downside risks persist. XRP must hold support near $1.06 to avoid another test of $1.00. Martinez warned that a clear breakdown could expose lower realized-price zones near $0.80, $0.62, and $0.51.

    Meanwhile, XRP has recorded positive returns in July for each of the past six years, most with double-digit gains, including strong advances in 2020 and 2023. Still, analysts caution that ”past July gains do not guarantee another rally,” especially while market sentiment remains weak.

  • Dogecoin and HYPE Suffer Steep Weekly Losses as Bitcoin Clings to $60K Support

    Dogecoin and HYPE Suffer Steep Weekly Losses as Bitcoin Clings to $60K Support

    Dogecoin and Hyperliquid’s HYPE token posted the steepest weekly losses among major cryptocurrencies, falling 9.6% and 9.9% respectively, as investors rotated capital toward equities and away from digital assets. Bitcoin showed relative resilience, recovering above $60,000 after briefly testing the $58,800 region, but broader market pressure from ETF outflows, a hawkish Federal Reserve, and a strong dollar kept sentiment subdued.

    Bitcoin Rebounds Amid Persistent Selling Pressure

    Bitcoin fell 5.3% over the week to around $60,345, but buyers stepped in each time the price approached $58,000, pushing it back above $60,000. FxPro chief market analyst Alex Kuptsikevich attributed the sharp declines to margin position liquidations, noting that pending buy orders then supported the recoveries. He warned that institutional investors could continue reducing crypto exposure to protect balance sheets, potentially triggering further liquidation-driven swings.

    US spot Bitcoin ETFs recorded outflows during the week, while the Federal Reserve’s hawkish stance and a strengthening dollar added headwinds. Bitcoin also remained near its 200-week moving average, a level historically associated with extended periods of weak market performance.

    Dogecoin Breakdown Signals Further Downside Risk

    Dogecoin extended its broader decline with a 4% loss in the latest 24-hour period, now trading about 90% below its all-time high. The memecoin broke below a sideways trading range that had held since February, with a retest near $0.08926 confirming the breakdown. It also remained below its 200-day moving average, keeping sellers in control and maintaining a bearish structure.

    Shorter timeframes showed Dogecoin repeatedly failing below a descending trendline, while the Chaikin Money Flow reading stood at negative 0.17, signaling continued capital outflows. However, net trading volume surged 98.85%, suggesting some buyer interest, and momentum readings began turning higher despite bearish control.

    Analyst Ali Martinez noted that the TD Sequential indicator produced a daily buy signal, suggesting the decline could pause if Dogecoin maintains support above $0.073. A move toward $0.081 is possible if that level holds, but a drop below $0.073 would invalidate the signal and reinforce the bearish outlook.

    Equity Rotation Leaves Crypto Without Fresh Capital

    The S&P 500 finished nearly flat, but the equal-weighted index hit a record high as investors rotated out of large-cap tech and semiconductors into other sectors. Falling oil prices supported broader market sentiment, yet cryptocurrencies failed to attract any of that rotating capital. Concerns over elevated AI stock valuations and weakening digital asset conditions kept investors selective.

    Conclusion

    Dogecoin and HYPE led the week’s crypto losses as Bitcoin held near $60,000 despite ETF outflows, institutional selling, and a strong dollar. Dogecoin’s bearish structure points to continued risk unless $0.073 support holds. Traders should monitor support levels, fund flows, and broader market sentiment before taking new positions.

  • Dogecoin Faces Make-or-Break Moment as Key Support Nears $0.075 in 2026

    Dogecoin Faces Make-or-Break Moment as Key Support Nears $0.075 in 2026

    Dogecoin is trading near $0.076 after an 11% weekly decline, with the critical support zone between $0.075 and $0.085 under intense pressure. Market sentiment remains uncertain as analysts debate whether the meme coin can stage a recovery or sink further in the second half of 2026.

    Current Dogecoin Price in June 2026

    As of June 25, 2026, Dogecoin is trading around $0.076 (roughly ₹7.15 to ₹7.50). The coin has lost nearly 11% over the past seven days, signaling strong short-term weakness. Despite the drop, daily trading volume remains elevated—between $900 million and $950 million—indicating sustained market activity. Dogecoin’s total market capitalization stands at approximately $11.7 billion, keeping it among the largest cryptocurrencies.

    Major Support Level Faces Pressure

    The most important price zone for Dogecoin currently sits between $0.075 and $0.085. This range has become the coin’s primary support area. The 200-day moving average, a key technical indicator, is near $0.0859 and is viewed by analysts as the dividing line between bullish and bearish conditions.

    If Dogecoin fails to hold above this support, further downside could follow. Some analysts predict a drop toward $0.070 first, and if selling pressure intensifies, the next possible level is near $0.065. Recent price action shows buyers struggling to push the coin above resistance, suggesting sellers remain in control of short-term momentum.

    Technical Signals Show Weakness

    Several indicators point to weakness in Dogecoin’s price structure. The Relative Strength Index (RSI) is near 59, meaning the coin has not yet entered oversold territory—suggesting room for further declines. Meanwhile, the MACD indicator is showing bearish divergence, often a precursor to additional correction.

    Market Sentiment Looks Uncertain

    The overall mood around Dogecoin remains mixed. Some experts believe the coin can recover if Bitcoin stays strong above its own key supports. Others think meme coins may continue to underperform in 2026 as investors shift toward projects with stronger real-world utility.

    Dogecoin has underperformed the broader crypto market this week: while DOGE dropped 11.8%, the overall cryptocurrency market fell by about 3.5%. This reflects a growing caution toward speculative digital assets, especially meme coins.

    Still, Dogecoin benefits from one of the most loyal communities in crypto, which often helps sustain long-term interest and support.

    New Developments Keep Dogecoin Relevant

    Despite the price weakness, several developments have kept Dogecoin in the spotlight. A free-mint NFT collection built on the Dogecoin blockchain reached a record floor price of nearly 44,900 DOGE (about $4,100), showing the ecosystem may offer more than just payments.

    Speculation around future payment adoption has also grown, and whale activity has picked up—large holders are accumulating DOGE during the dip, signaling confidence in long-term value.

    Dogecoin Price Forecast for 2026

    Analysts offer a range of forecasts. If support holds, Dogecoin could trade between $0.083 and $0.10 by year-end, assuming the broader crypto market remains stable. A more bullish scenario—driven by a Bitcoin rally and renewed meme-coin interest—could push prices to $0.12–$0.20. Aggressive targets of $1 appear highly unlikely given current conditions.

    Immediate resistance sits at $0.085, followed by $0.095, with $0.10 as the major psychological barrier. A surge in buying volume could push DOGE above $0.12 by late 2026.

    Why This Matters

    Dogecoin is testing the limits of its meme-driven power. With retail investors pulling back and institutional ETF interest nearly nonexistent, the defense of the $0.075–$0.085 support zone will determine whether DOGE stabilizes or enters a prolonged slide.

    Final Outlook

    The next few weeks are critical. If Dogecoin holds above $0.075–$0.085, a gradual recovery toward $0.10–$0.12 is possible. Failure to do so could hand full control to sellers.

    FAQs

    1. What is Dogecoin’s current price in June 2026? Dogecoin trades near $0.076, following an 11% weekly drop.
    2. What is the main support level for Dogecoin? The key support zone is $0.075–$0.085, with the 200-day moving average at $0.0859.
    3. Can Dogecoin reach $0.10 in 2026? Yes, if support holds and market conditions improve.
    4. Why has the price dropped recently? Due to broader market weakness and reduced appetite for speculative assets.
    5. Could Dogecoin hit $1 in 2026? Highly unlikely given current bearish sentiment.
  • XRP at $1.10: What the 2-Year Technical Signal Reveals About the Next Big Move

    XRP at $1.10: What the 2-Year Technical Signal Reveals About the Next Big Move

    XRP continues to hover near the critical $1.10 level, drawing renewed attention from traders after a sharp decline from its May highs above $1.50. The token currently trades around $1.11, down nearly 2% in the past 24 hours, as the broader crypto market remains under pressure. Bitcoin and other altcoins have also faced selling, compounding the stress on XRP.

    The 2-Year Signal That Has Traders Watching Closely

    A rarely seen technical pattern on XRP’s long-term charts has caught the eye of analysts. XRP has slipped below its 200-day moving average—currently near $1.13—a key level that often acts as long-term support. More notably, the token’s 2-year trend line has flattened for the first time since late 2024. Historically, such formations have preceded significant price swings in either direction, making this a pivotal moment for traders.

    XRP Stuck Between Key Support and Resistance

    Price action remains rangebound, with XRP contained between $1.05 support and $1.20 resistance. Buyers have failed to generate enough momentum to break higher, while sellers have not pushed the price below critical support. This indecision leaves the market waiting for a catalyst.

    Ripple Escrow Releases Add Pressure

    Ripple’s monthly 1 billion XRP escrow unlock continues to inject fresh supply into the market. While the program is part of Ripple’s long-standing strategy, the additional tokens often weigh on sentiment during periods of weak demand. The latest release has done little to inspire confidence amid the current downtrend.

    Positive News Fails to Boost Price

    Ripple recently announced it secured MiCA regulatory approval in Luxembourg, enabling expanded payment services and stablecoin operations across Europe. Despite this positive development, XRP’s price barely reacted, underscoring that traders are more focused on short-term fear than long-term fundamentals.

    Futures Market Signals Big Trader Activity

    Derivatives data tells a different story. XRP futures open interest has surged to $2.89 billion, including $1.4 billion on CME futures—a clear sign that institutional players are positioning for a major move. Additionally, spot ETF-related inflows tied to XRP products have exceeded $1.43 billion, indicating that large investors remain bullish on the asset’s long-term potential.

    What Traders Should Watch Next

    The coming weeks could define XRP’s next trend. A breakdown below the psychological $1.00 support could trigger stop-losses and push the price toward the $0.90–$0.85 zone. Conversely, a move above $1.20 resistance would likely restore confidence and open the path toward $1.35 and eventually $1.50. The 2-year flattening pattern suggests that the market is entering a critical accumulation phase, historically followed by a strong breakout. Until a clear direction emerges, caution will likely prevail.

    Key Takeaways

    • XRP price is trapped between $1.05 support and $1.20 resistance.
    • XRP futures open interest reached $2.89 billion, signaling high market activity.
    • A break below $1.00 or above $1.20 may determine XRP’s next major trend.