Tag: trading volume

  • Bitcoin Technical Analysis Explained: How Traders Read Price, Momentum and Leverage

    Bitcoin Technical Analysis Explained: How Traders Read Price, Momentum and Leverage

    What Bitcoin technical analysis actually does

    Bitcoin technical analysis is a framework for reading market direction through price action, trading volume, momentum and historical patterns instead of corporate earnings or balance-sheet fundamentals. Because BTC has no cash flows to value, chart-based tools carry more weight than they do in equity markets.

    Traders use these tools to map trends, locate probable support and resistance zones, and gauge whether a move is backed by broad participation. The key caveat: indicators describe the market as it is right now. They do not forecast Bitcoin’s next price with certainty. Their value comes from stacking several signals together, reading them against the wider market backdrop, and applying strict risk control.

    Support and resistance: mapping where buyers and sellers showed up

    Support is a price band where buying has repeatedly absorbed selling. Resistance is the mirror image — a zone where sellers previously stepped in. These bands tend to form around prior swing highs and lows, heavy-volume trading areas, and the average cost basis of holders.

    Recent on-chain data offers a working example. Glassnode reported on September 23 that BTC had climbed above a large long-term-holder supply cluster near $84,000–$85,000. The next meaningful on-chain hurdle sat around the mean MVRV price, close to $96,700. Glassnode also flagged the $95,000–$97,000 band as significant, where options positioning and on-chain valuation metrics overlap.

    Treat these as zones, not precise reversal points. Price frequently overshoots or stalls just short of a level before reacting.

    Moving averages for trend direction

    Moving averages flatten out short-term noise so the underlying trend is easier to see. The 50-day MA is the standard gauge for medium-term momentum; the 200-day MA frames the longer-term picture.

    • Sustained trading above these lines suggests strengthening momentum.
    • Extended periods below them point to deteriorating conditions.
    • Crossovers between the short and long averages draw attention, but they generate plenty of false signals in choppy markets.

    Momentum: the Relative Strength Index

    The RSI scores the speed and size of recent price changes on a 0–100 scale. Readings above 70 are traditionally labeled overbought; readings below 30 are labeled oversold.

    Bitcoin is prone to staying overbought or oversold far longer than conventional thresholds imply, especially during powerful trends. That makes RSI far more useful as a confirmation tool — read alongside price structure and volume — than as a standalone buy or sell trigger.

    Volume as a participation check

    Volume reveals how much conviction sits behind a price move. During September’s recovery, BTC spot volume more than doubled from its August low. The pickup appeared across multiple exchanges, which points to broad market involvement rather than activity concentrated on a single venue.

    Derivatives: the leverage layer

    Futures and options now sit at the center of crypto technical analysis.

    • Open interest tracks outstanding derivative positions.
    • Funding rates hint at whether leveraged traders are leaning long or short.
    • Liquidations show where forced exits could amplify price swings.

    Glassnode reported in September that Bitcoin futures open interest stayed elevated, while options open interest stood near $41 billion. Together, these figures help traders judge how much leverage is embedded in the market and where volatility could spike.

    Why a multi-signal approach matters

    No single indicator tells the whole story. Combining support zones, moving averages, momentum, volume and derivatives gives a fuller read on market structure — enough to identify trend shifts, assess risk and sketch out plausible scenarios without pretending to predict the future.

    Risk management remains the non-negotiable piece. Position sizing and stop placement matter more than any signal, because technical analysis can be wrong for extended stretches.

    Frequently asked questions

    What is Bitcoin technical analysis?

    It is the study of historical price action, volume and market behavior to identify trends and potential trading levels. Unlike fundamental analysis, it focuses on market data rather than estimating Bitcoin’s intrinsic value.

    How do support and resistance work in BTC trading?

    Support is a zone where buying pressure has historically increased; resistance is where selling pressure has appeared. Traders derive them from prior highs and lows, high-volume areas and holder cost bases.

    Why are moving averages used?

    They smooth short-term volatility so broader trends are easier to read. The 50-day average reflects medium-term momentum, while the 200-day average captures longer-term direction.

    What does RSI tell Bitcoin traders?

    RSI measures the speed and magnitude of recent price moves. Above 70 is traditionally viewed as overbought and below 30 as oversold, though neither reading guarantees a reversal.

    Why do volume and derivatives matter?

    Volume shows how much participation supports a move. Futures and options data — open interest, funding rates and liquidations — reveal whether price action is driven by spot demand or leveraged positioning.

    Disclaimer: This article is for informational purposes only and does not constitute financial or investment advice. Cryptocurrency assets carry significant risk, including the potential loss of all invested capital. Always conduct your own research before investing.

  • Ethereum Classic Surges 7.49% as Broader Crypto Rally Boosts ETC Trading Volume

    Ethereum Classic Surges 7.49% as Broader Crypto Rally Boosts ETC Trading Volume

    Ethereum Classic (ETC) jumped 7.49% to USD 9.18 as a widespread cryptocurrency market rally drove demand and trading activity across digital assets. The token traded between USD 8.56 and USD 9.29 after opening near USD 8.52. Meanwhile, Bitcoin gained 6.39% to USD 86,334, and the market saw approximately USD 800 million in short liquidations.

    The latest advance extended ETC’s seven-day gain to 26.93%. The cryptocurrency has also risen 18.48% this month and 30.19% over the past 90 days. Despite the rebound, ETC remains 50.73% lower over one year and trades 94.44% below its record high of USD 165.15 from May 7, 2021.

    Broad Crypto Rally Drives ETC Higher

    The wider cryptocurrency market provided the clearest catalyst behind ETC’s latest move. Bitcoin advanced 6.39% during the session, while XRP rose 9.79%. At the same time, the market recorded approximately USD 800 million in short liquidations. Such liquidations occur when traders betting on lower prices must close positions by buying assets back, which can accelerate an existing rally.

    As major cryptocurrencies gained, speculative activity also spread into smaller assets such as Ethereum Classic. ETC currently has a market capitalization of about USD 1.45 billion. Its smaller size means larger percentage moves can occur when market-wide trading activity rises sharply. Still, the available information contains no ETC-specific announcement that explains the price increase. There were no cited network upgrades, exchange listings, ETF developments, or other project events behind the move.

    ETC Trading Volume Surges as Momentum Builds

    Trading activity strengthened alongside the price increase. Daily ETC volume climbed to USD 0.0967 million, representing a 116.16% increase over its 30-day average. Its volume-to-market-cap ratio also reached 6.66%, compared to the average of 3.08%. Therefore, the latest price increase came with stronger market participation rather than minimal trading activity. Rising volume accompanied ETC’s push toward the session high of USD 9.29.

    The token also trades above its tracked moving averages and above the peaks of its recent 90-day range. This places USD 9.29 at the center of the next short-term price test. Even so, the rally follows a sharp rebound from depressed levels. ETC remains deeply below its historical peak and still records a substantial year-over-year decline.

    The available data does not include ETC-specific funding rates, open interest, or perpetual futures liquidations. As a result, the role of ETC derivatives cannot be measured from the supplied figures. Instead, the reported USD 800 million liquidation figure applies to the wider crypto market. The current evidence therefore links part of ETC’s momentum to sector-wide short covering rather than ETC-specific futures activity.

    USD 9.29 Becomes ETC’s Immediate Price Test

    The session high at USD 9.29 now forms the nearest reference point for ETC traders. The asset reached the level after beginning the period near USD 8.52. Under a short-term strategy, a daily close above USD 9.29 would mark a breakout signal, with a stop level near USD 8.84 and a possible profit-taking area at USD 10.50. A trailing stop could adjust exposure as the price changes.

    For a medium-term approach, the USD 8.03 to USD 8.52 area is identified as a potential pullback zone. A daily close below USD 7.75 would invalidate this setup. Meanwhile, the same framework keeps USD 9.29 as the initial target before any possible extension toward USD 10.50. The setup therefore depends heavily on whether ETC can preserve its recent momentum.

    The long-term strategy remains tied to Ethereum Classic’s proof-of-work structure and fixed-supply thesis. It proposes staggered purchases below USD 8.00 while recognizing the asset’s steep annual decline. A conservative approach calls for staying out of the market because ETC carries annualized volatility of 61.6%. This volatility remains relevant as the asset trades after a rapid multi-day advance. USD 9.29 now marks the immediate price level to watch as traders assess whether momentum can continue.

  • XRP Ledger Transaction Value Surges: Are Institutions Driving Network Activity?

    XRP Ledger Transaction Value Surges: Are Institutions Driving Network Activity?

    Market Structure Shifts as Trading Volume Grows

    The XRP Ledger is processing larger transactions through a shrinking number of accounts, a pattern that aligns with professional participation but also raises concerns about market concentration. Distinguishing genuine institutional adoption from automated activity requires more than a rising transaction count.

    Order Book Volume Climbs While Active Accounts Decline

    Evernorth’s second-quarter 2026 liquidity update reported an average daily order book volume of 3.57 million XRP, a 79% year-over-year increase. Meanwhile, the number of accounts executing those trades fell from 1,864 to 1,111. Average daily volume per trading account nearly tripled, rising from 1,072 XRP to 3,217 XRP. Order books also increased their share of on-chain trading from 54% to 81%.

    These figures describe a meaningful change in market structure: fewer participants are supporting considerably higher order book turnover.

    Stablecoin Liquidity Expands

    Evernorth also reported that RLUSD balances on the ledger averaged USD 539 million during the quarter, compared with USD 73 million a year earlier. Growing dollar liquidity can facilitate settlement and trading without requiring participants to hold equivalent exposure to XRP’s price.

    Separately, 21shares reported that the XRP Ledger settled USD 159.9 billion during the first half of 2026. By June 30, the network held 52% of RLUSD’s USD 1.56 billion supply. The two RLUSD measures are not directly comparable—one is a quarterly average, the other a point-in-time snapshot—but together they indicate an expanding stablecoin presence on the ledger.

    Automated Activity Clouds the Picture

    A September 8 analysis from Bitquery attributed 93.2% of August transaction traffic to 793 accounts and described substantial automated order activity. This finding concerns transaction traffic, not executed order book volume, but it shows why raw transaction counts can exaggerate the breadth of adoption.

    Institutions commonly automate trading, so automation alone does not invalidate economic activity. However, repeated orders or transfers cannot establish meaningful customer demand without examining execution, counterparties, and purpose.

    Network Usage vs. Token Returns

    Network usage and token returns are separate questions. According to 21shares, reported first-half revenue declined 81.6% year-over-year to USD 1.18 million despite substantial settlement value. Low fees can make a network attractive for payments while limiting revenue per transfer. Consequently, higher settlement totals should not automatically be interpreted as forecasts for XRP appreciation.

    A stronger institutional thesis would combine sustained liquidity, identifiable participants, repeat commercial settlement, and diversified activity. Researchers should also separate XRP transfers from stablecoin movements and tokenized asset transactions.

    Current evidence supports a narrower conclusion: the XRP Ledger is processing concentrated financial activity with growing stablecoin liquidity. Whether that becomes broad institutional adoption depends on durable usage, transparent measurement, and demonstrable economic purpose.

    Why This Matters

    Growing transaction value and stablecoin liquidity could strengthen the XRP Ledger’s role in institutional finance. However, concentrated activity means investors must distinguish genuine commercial adoption from automated trading before treating network growth as evidence of broader institutional demand.

    Final Thoughts

    The XRP Ledger is handling greater financial value with expanding stablecoin liquidity, but institutional adoption remains difficult to quantify. Sustained commercial settlement, broader participation, and identifiable institutional activity will provide stronger evidence of long-term adoption.

    Frequently Asked Questions

    Is institutional activity increasing on the XRP Ledger?

    XRPL data shows higher order book volumes, growing stablecoin liquidity, and substantial settlement value. However, available figures do not conclusively identify whether the activity comes from banks, funds, trading firms, or other participants.

    How much XRP trading volume did XRPL record in Q2 2026?

    Evernorth reported an average daily order book volume of 3.57 million XRP, representing a 79% year-over-year increase. At the same time, the number of accounts placing those trades declined from 1,864 to 1,111.

    How important is RLUSD to XRP Ledger activity?

    RLUSD is becoming an increasingly important source of dollar-denominated liquidity on XRPL. Evernorth reported average balances of USD 539 million during Q2, compared with USD 73 million during the corresponding period a year earlier.

    Does higher XRPL transaction value mean XRP’s price will rise?

    Not necessarily. Network settlement value and XRP investment returns are separate measures. Higher activity can demonstrate blockchain usage without automatically generating equivalent network revenue or demand for the XRP token.

    What should investors watch for evidence of XRPL institutional adoption?

    Investors should monitor identifiable institutional participants, sustained liquidity, commercial settlement, and diversified activity involving XRP, stablecoins, and tokenized assets. Broader participation would provide stronger evidence than transaction counts alone.

  • How to Read Market Footprints: Using Price Action, Volume, and Liquidity for Smarter Trades

    How to Read Market Footprints: Using Price Action, Volume, and Liquidity for Smarter Trades

    Financial markets rarely operate without leaving behind evidence. All breakouts, reversals, and trends start long before they become visible in the price action. Professional traders spend time studying the signs that precede a strong rally or sudden crash, while many retail traders only react to the results. These signals—known as market footprints—reveal the positions of other traders (buyers or sellers) and offer clues about where the price is likely to head next.

    Rather than trying to predict the future, market footprints help traders interpret probability by observing market activity.

    What Is a Market Footprint?

    Market footprints refer to the traces left by institutional and retail trading activity. They are not a single indicator but a broad set of factors that influence price action, trading volume, liquidity, market structure, volatility, and order flow. Individually weak, when combined they provide valuable insight into shifting market sentiment.

    For example, if a stock repeatedly tests a resistance level while volume increases, it may signal growing buying interest or accumulation. Conversely, a sudden liquidity sweep—where the price falls below support and then quickly rises—can indicate entry by larger market participants.

    Studies have found a relationship between trading volume and price volatility. According to a study published in the Journal of Financial and Quantitative Analysis, trading volume is one of the first indicators of changing market conditions, as unusual jumps in trades are typically followed by heightened price volatility.

    Why Professional Traders Watch Market Structure

    Experienced traders don’t chase the price after a breakout. Instead, they watch the market’s action just before the move. They ask questions such as:

    • Is trading volume confirming the price move?
    • Have prices moved from low highs to higher highs?
    • Are there any key support or resistance levels forming liquidity?
    • Is volatility picking up after consolidation?

    These questions help traders determine if a move is driven by genuine buying and selling interest or by short-term noise.

    Liquidity is also crucial. According to market structure research, liquidity isn’t only about trade volume—it also includes price impact, bid-ask spreads, and execution quality. In times of high volatility, understanding how liquidity dynamics shift is essential for accurate price interpretation.

    Why This Matters

    Understanding how the market leaves footprints helps traders avoid emotional decisions and adopt a more data-driven, evidence-based approach. By studying price action, volume, liquidity, and market structure together, traders can spot higher-probability trades, manage risk more effectively, and avoid chasing moves that have already played out.

    Final Thoughts

    There is no sure way to predict the next market move. However, by using multiple pieces of evidence, traders can make more informed decisions rather than relying on speculation. Markets rarely announce their intentions—they reveal them through participation, momentum, and liquidity changes. Learning to read these footprints allows traders to adopt a structured, data-driven approach to trading.

    Frequently Asked Questions

    1. What are market footprints in trading?

    Market footprints are subtle signals left by buying and selling activity before a major price move occurs. They include changes in price action, volume, liquidity, volatility, and market structure that help assess market sentiment.

    2. Why is trading volume important when analyzing markets?

    Trading volume shows the level of participation behind a price move. Rising volume often confirms the strength of a trend or breakout, while weak volume may indicate a move lacks conviction and could reverse.

    3. What is market structure, and why does it matter?

    Market structure refers to the sequence of higher highs, higher lows, lower highs, and lower lows on a price chart. It helps traders identify whether the market is in an uptrend, downtrend, or consolidation phase before making decisions.

    4. How does liquidity influence price movements?

    Liquidity determines how easily assets can be bought or sold without significantly affecting price. Areas with high liquidity often become important support or resistance zones where institutional traders may enter or exit positions.

    5. Can market footprints accurately predict future price movements?

    No. Market footprints do not predict the future with certainty. Instead, they help traders evaluate probabilities by combining multiple technical signals, enabling more informed and disciplined trading decisions while managing risk effectively.

  • Shiba Inu Price Recovery Stalls as Volume Declines and Sellers Take Control

    Shiba Inu Price Recovery Stalls as Volume Declines and Sellers Take Control

    Shiba Inu’s (SHIB) recent price recovery has lost momentum after a 40% surge failed near the 100-day exponential moving average (EMA) at $0.00000503. Trading volume temporarily spiked twelvefold, but sellers quickly erased much of the advance. The pullback has also delayed a potential mini-golden cross between the 20-day and 50-day EMAs, weakening the short-term bullish outlook.

    Rally Meets Strong Resistance

    SHIB initially climbed through its short-term moving averages as daily volume reached one of its strongest levels this year. The rise briefly revived attention on the token, which had remained under sustained pressure. The volume expansion suggested that fresh market activity, not just short-covering, supported the move. However, buyers could not maintain control once SHIB approached the 100-day EMA. Sellers stepped in near $0.00000503 and pushed the token back below that barrier. The rejection stopped what could have become SHIB’s third-largest recovery rally of 2026.

    Mini-Golden Cross Loses Momentum

    The 20-day and 50-day EMAs had moved close to a bullish crossover before the reversal. Market participants often track that pattern as an early sign of stronger short-term momentum. Instead, the price decline widened the gap between both averages. That shift postponed technical confirmation of a lasting trend reversal and weakened the recent breakout structure.

    Can SHIB preserve its recovery structure while demand continues to fade? Immediate support sits near $0.00000448, where the shorter moving averages remain close together. Holding that area would preserve part of the breakout. A clear loss could return SHIB to the consolidation range that controlled most of July.

    Volume Falls as Exchange Outflows Rise

    Trading activity declined sharply after the initial twelvefold expansion. At the same time, SHIB surrendered a large share of its gains as buyers lost momentum. The relative strength index (RSI) also retreated from overbought territory toward neutral levels, matching the rapid decline in buying pressure after the brief surge.

    Bulls still need to reclaim $0.00000503 before challenging the 200-day EMA near $0.00000602. That longer moving average continues to define the broader bearish structure. Meanwhile, blockchain trackers reported large transfers from Coinbase-related addresses. The transfers did not appear on open order books, so observers linked them to wallet rebalancing or cold-storage management.

    Blockchain venues also recorded net withdrawals of 74 billion SHIB from centralized exchanges. Such movements can reduce near-term exchange supply when holders move tokens into self-custody. However, the available data cannot determine whether the withdrawals reflected accumulation or routine wallet reshuffling. The transfer activity has nonetheless returned SHIB to traders’ watchlists, who now watch whether exchange withdrawals translate into lasting demand.

  • SpaceX Leads MEXC RealStocks’ Debut Month with Nearly 30% of Trading Volume

    SpaceX Leads MEXC RealStocks’ Debut Month with Nearly 30% of Trading Volume

    MEXC, a leading zero-fee digital asset trading platform, has released the first-month trading insights for its newly launched RealStocks product. The feature allows eligible users to purchase real US stocks and ETFs through a licensed securities broker partner. Launched on June 1, 2026, RealStocks quickly showed distinct trading patterns, with one event-driven name—SpaceX (ticker: SPCX)—capturing massive consensus and AI-related interest spreading beyond the most obvious tickers.

    According to the data, SPCX accounted for 29.70% of June’s total trading volume and 29.06% of trading users, finishing far ahead of every other asset. The simultaneous rise in both metrics indicates that SpaceX attracted not just heavy volume from a narrow group of aggressive traders, but also broad participation from a wide user base placing modest orders—making it the firmest consensus holding of RealStocks’ opening month.

    Seven AI-related assets—AAOI, MU, NVDA, MRVL, DRAM, AVGO, and SNDK—together accounted for 23.67% of total trading volume. These names span GPU compute, memory and storage, data center networking, and optical communications, reflecting how investor interest traveled well beyond the single best-known compute name and followed data center demand into its supply chain—a pattern that echoes the wider AI capital rotation seen across markets in June.

    Three distinct trading structures emerged over the month:

    • Well-known large caps: AAPL, MSFT, INTC, and GOOGL drew broad participation and widened overall user coverage.
    • Core hot assets: SPCX, NVDA, MU, TSLA, SNDK, and MRVL combined wide participation with heavy activity.
    • Narrower industry-chain names: AAOI, DRAM, STRC, and AVGO reached the top 10 by volume without reaching the top 10 by users, meaning fewer traders each contributed more. MRVL exemplifies this split, drawing 2.12% of trading users but 3.15% of volume.

    Similar themes surfaced on both RealStocks and MEXC’s futures products: SPCX, MU, NVDA, SNDK, and MRVL ranked in the top 10 by volume for both. However, concentration diverged sharply. RealStocks’ top 10 assets made up 57.71% of volume versus roughly 84.94% for futures, leaving 42.29% of RealStocks volume spread across everything outside the leaderboard. AAOI, DRAM, TSLA, and AVGO placed high on RealStocks but ranked lower on futures, and STRC has no corresponding futures product.

    “Futures follow the news cycle. RealStocks showed conviction as a portfolio product,” said Vugar Usi, CEO of MEXC. “More than 40% of first-month volume sat outside the top ten names. That is portfolio building, not headline trading. Our users finally got real access to this market and they used it like investors.”

    RealStocks supports USDT funding, charges 0 trading fees, and delivers the ownership rights attached to real shares—including eligible dividend distributions. The product is supported by Atomic Vaults Securities (AVS), a FINRA-registered broker-dealer, providing access to real U.S. equities through regulated securities infrastructure. Over 120,000 users signed up during the first month; more than half of those new accounts went on to make a first deposit. As of July 27, 2026, RealStocks had settled dividends for 154 stocks and ETFs.

    Alongside RealStocks, MEXC offers more than 260 stock and index futures products, tokenized US equities, and a Pre-IPO Launchpad—covering derivatives, on-chain exposure, and early-stage opportunities within a single account.

  • Dogecoin Trading Volume Spikes as Rare Buy Signals Appear on Weekly and Monthly Charts

    Dogecoin Trading Volume Spikes as Rare Buy Signals Appear on Weekly and Monthly Charts

    Dogecoin traded near $0.0734 on Tuesday as the broader cryptocurrency market staged a modest rebound. Rising volume, increased futures activity, and repeated buy signals from technical indicators suggested stronger participation despite still-bearish price conditions.

    Volume and Futures Open Interest Climb

    Daily trading volume surged above $1.02 billion on Tuesday, up sharply from $438 million on Monday and $336 million on Sunday. The jump indicates that more market participants entered Dogecoin positions during the latest bounce. Greater volume can provide stronger support for substantial price movements.

    Dogecoin futures open interest also rose to 15.45 billion DOGE, compared with 14.64 billion a day earlier and 12.01 billion on June 11. While open interest reflects increased activity in the derivatives market, it does not signal whether traders are betting on higher or lower prices.

    Despite the uptick in activity, overall sentiment remained weak. The Fear and Greed Index fell to 25 on Tuesday from 29 on Monday, firmly in the Extreme Fear zone. Investors continue to exercise caution even as trading volume climbs.

    Technical Indicators Suggest Stabilization

    Dogecoin’s Relative Strength Index (RSI) stands near 43, indicating weak momentum but staying above levels typically associated with deeply oversold conditions. The Moving Average Convergence Divergence (MACD) indicator shows slightly positive readings. Together, these metrics point to possible stabilization rather than a confirmed bullish reversal.

    Key support remains near $0.0709, where DOGE previously broke through a trendline. A daily close below that level could expose the token to further downside. Resistance sits near the 50-day exponential moving average (EMA) at $0.0798, with stronger barriers at the 100-day EMA ($0.0877) and 200-day EMA ($0.1047).

    A firm move above $0.075 could signal improving bullish momentum, but DOGE must overcome several technical hurdles before a broader trend reversal is confirmed.

    Rare Buy Signals on Weekly and Monthly Charts

    Crypto analyst Ali Charts reported that Dogecoin continues to generate buy signals on its weekly chart via the TD Sequential indicator. Multiple consecutive signals have appeared, forming an uncommon technical pattern that has preceded major upward moves in the past.

    On the monthly chart, trader Tardigrade noted that the Stochastic RSI entered oversold territory for the first time since the 2022 bear market. Dogecoin later recorded a substantial rally after a similar reading in 2022. The Stochastic RSI helps measure momentum and can indicate potential directional changes when combined with price action and volume.

    Dogecoin’s performance is still closely tied to Bitcoin and the broader crypto market. Exchange liquidity, retail interest, and community activity remain key drivers.

    Outlook

    Dogecoin holds near $0.0734 as rising trading volume and futures open interest suggest growing participation, while technical indicators hint at stabilization. However, the token remains below key moving averages and faces resistance around $0.075. Traders should watch the $0.0709 support level closely and monitor upcoming buy-signal confirmations.

  • Tesla (TSLA) Technical Analysis: Bearish Pressure Mounts as Stock Tests Critical $368 Support

    Tesla (TSLA) Technical Analysis: Bearish Pressure Mounts as Stock Tests Critical $368 Support

    Tesla (TSLA) continues to face significant selling pressure, with the stock trading near $369.56 and exhibiting a clear bearish trend on its 30-minute chart. A combination of weak moving averages, low Relative Strength Index (RSI), strong selling volume, and repeated lower highs suggests that downside momentum remains intact. The $368–370 zone now serves as a critical support area that bulls must defend to prevent further declines.

    Key Technical Takeaways

    • Tesla is forming consistent lower highs and lower lows, confirming a bearish trend.
    • The RSI is near 24.67, indicating weak momentum and an oversold condition.
    • Immediate support lies at $368–370, while resistance levels are at $376 and $386.

    Price Action Remains Weak

    On the 30-minute chart, Tesla’s price action shows a steady series of lower highs and lower lows. Every attempted recovery fails to surpass the previous high, allowing sellers to regain control quickly. This pattern keeps the stock under persistent downward pressure as the latest trading session concludes.

    Moving Averages Signal Continued Weakness

    The moving averages reinforce the bearish outlook. The stock consistently trades below both the short-term and long-term moving averages, with the shorter average positioned below the longer one—a classic bearish signal. Each minor rally stalls at these moving averages, which now act as resistance rather than support. Until TSLA closes decisively above these levels, the trend remains negative.

    Bollinger Bands Highlight Downside Volatility

    Bollinger Bands reveal heightened volatility during sharp price moves. Earlier sessions featured wide bands after large declines, followed by a period of contraction before another selling wave. The latest candles are hugging the lower Bollinger Band, confirming that sellers retain control. While price near the lower band can occasionally trigger a short-term bounce, strong bearish trends often keep the stock pinned near this zone for extended periods.

    Volume Confirms Bearish Dominance

    Volume analysis supports the bearish narrative. Large red candles appear with elevated trading volume during sharp declines, indicating strong seller participation. Although green candles appear intermittently, their associated volume is significantly lower than selling volume. As a result, each recovery attempt loses momentum quickly, and the stock fails to build any lasting rebound.

    RSI Signals Oversold but Not Reversal

    The RSI stands near 24.67, well below the neutral 50 level and close to the oversold threshold of 30. While an oversold reading can sometimes precede a short-term bounce, it does not confirm a trend reversal. A sustained recovery would require stronger price action, higher buying volume, and a move above key resistance levels.

    Price Structure Favors Sellers

    The chart shows multiple failed recovery attempts. After an initial drop, Tesla attempted to climb back toward $415–420 before sellers returned. Another rally near the middle of the chart also stalled below the prior high. This series of lower peaks confirms that bullish momentum continues to fade, with sellers defending each resistance zone effectively.

    Key Support and Resistance Levels

    • Support: $368–370 – The stock has found temporary stability here, but repeated tests weaken this level. A breakdown below this zone could trigger further downside.
    • Resistance 1: $376 – Near the short-term moving average.
    • Resistance 2: $386 – Where the longer-term moving average and previous price congestion converge.

    A strong close above both resistance levels would improve the technical outlook and could signal that buyers are regaining control.

    Overall Outlook

    The overall technical picture remains bearish. Lower highs, lower lows, weak moving averages, strong selling volume, and a low RSI all point to continued downside pressure. Tesla remains one of the most volatile large-cap technology stocks, and factors such as earnings reports, EV demand, market sentiment, economic data, and regulatory updates can rapidly shift price direction.

    For now, the chart continues to favor sellers. A more constructive outlook would require a sustained move above the key resistance levels, supported by higher buying volume and improving momentum. Until then, downside risk remains the dominant theme.

    Frequently Asked Questions

    1. What is the current trend for Tesla stock? Tesla remains in a bearish trend with consistent lower highs and lower lows.
    2. What does the RSI indicate? The RSI near 24.67 reflects weak momentum and an oversold condition.
    3. What is the nearest support level? The closest support zone is around $368–370.
    4. Which resistance levels are important? Immediate resistance is near $376, followed by stronger resistance around $386.
    5. What could improve Tesla’s technical outlook? A sustained move above key resistance levels with stronger buying volume could signal a positive trend change.
  • XRP Aims for Top 5 Crypto Spot as Breakout Potential Builds

    XRP Aims for Top 5 Crypto Spot as Breakout Potential Builds

    XRP is gaining momentum through higher trading volume, institutional interest, whale accumulation, and Ripple ecosystem growth. Analysts watch the $1.45 resistance while stronger adoption could support higher long-term valuations.

    Key Takeaways

    • Trading volume and institutional demand are strengthening XRP’s bullish momentum.
    • The $1.45 resistance level remains the key trigger for a potential breakout.
    • Long-term growth depends on wider adoption, favorable regulations, and overall market sentiment.

    Valued among the top five largest cryptocurrencies, XRP trades at approximately $1.11 following a 4.1% daily gain. This recent upward movement pushes its 24-hour trading volume near $1.5 billion, while its total market capitalization scales to roughly $87 billion.

    Higher Trading Activity Builds Confidence

    One of the biggest reasons behind the recent optimism is the sharp rise in trading activity. A trading volume of nearly $1.5 billion in one day shows that buyers and sellers remain highly active. Large trading volume often reflects stronger market interest and can support price movement when demand continues to rise.

    Market experts believe that healthy trading activity usually creates better price stability and attracts even more investors. As fresh money enters the market, confidence often grows across the crypto sector. XRP has benefited from this trend over the past few weeks.

    Institutional Interest Supports the Market

    Another major factor behind XRP’s recent strength is growing institutional interest. Large investment firms have shown greater interest in digital assets after new developments around crypto investment products.

    Several reports point to fresh inflows linked to XRP exchange-traded funds in some markets. These products allow investors to gain exposure to XRP through traditional investment channels. This type of access often attracts large financial institutions that prefer regulated investment products.

    Apart from ETF activity, trading data also shows stronger participation from major Asian crypto exchanges. This wider market support has helped XRP maintain positive momentum even during periods of market volatility.

    Whale Activity Adds More Optimism

    Blockchain data also shows continued accumulation by large XRP holders, often called whales. These investors control significant amounts of XRP and usually make decisions after detailed market research.

    When whales continue to buy instead of sell, many traders view this as a positive signal. Historical market data has shown that similar accumulation phases have often appeared before large price movements.

    Ripple also continues its scheduled escrow releases. Despite these regular token releases, the market has remained stable, and the additional supply has not created major selling pressure. This balance has helped maintain positive market sentiment.

    Technical Picture Points to a Possible Breakout

    Technical analysts continue to watch XRP very closely. At present, the important resistance level remains near $1.45. A successful move above this level could open the door for another strong rally.

    On the downside, analysts identify the $1.05 to $1.10 area as an important support zone. As long as XRP remains above this range, many experts believe the overall trend stays positive.

    The price chart also shows a narrow consolidation pattern. Such patterns often appear before larger price moves. Combined with rising trading volume, this setup has increased expectations of a possible breakout if buying pressure continues.

    Can XRP Climb Even Higher?

    XRP already ranks among the largest cryptocurrencies in the world. However, stronger demand could help the coin increase its market value even further.

    Based on its current circulating supply, a market capitalization of $100 billion would place the XRP price near $1.62. If the market cap reaches $200 billion, the price could rise to around $3.24. A $400 billion market value would place XRP close to $6.47, while a $500 billion market cap would result in a price of roughly $8.09.

    Ripple’s Growth Adds More Support

    Ripple continues to expand its business across the global payment industry. The company focuses on cross-border payment solutions that help financial institutions move money faster and at lower cost.

    Positive regulatory developments have also improved investor confidence. Greater legal clarity has reduced uncertainty that affected XRP for several years. Many analysts believe this change has created a healthier environment for long-term growth.

    At the same time, development across the XRP Ledger ecosystem continues. New projects, business partnerships, and network improvements have added more value to the overall ecosystem. These developments have strengthened confidence among both retail and institutional investors.

    Risks Still Remain

    Although the recent outlook appears positive, some risks still deserve attention. The cryptocurrency market remains highly volatile, and prices can change quickly.

    A weaker crypto market could slow XRP’s momentum. Large investors may also decide to book profits after recent gains, which could create temporary selling pressure. Failure to move above the important $1.45 resistance level may also delay the next major rally.

    Slower institutional adoption or weaker investor sentiment could reduce demand in the coming months. These factors remain important for future price performance.

    Outlook Remains Positive

    A price of around $1.11, a market capitalization of roughly $87 billion, and a daily trading volume of nearly $1.5 billion.

    Increased institutional buying, whale accumulation, positive regulatory developments, and the continued growth of the Ripple ecosystem have provided much-needed support for the cryptocurrency.

    Getting to significantly higher prices requires a major expansion in market cap and broader adoption in global finance. For example, XRP would need to trade at around $20 per coin to reach a market capitalization of approximately $1.2 trillion, which remains far above its current valuation.

    FAQs

    1. Why is XRP attracting attention again? Rising prices, increased trading volume, institutional interest, and positive Ripple developments have renewed investor confidence.
    2. What is XRP’s key resistance level? Analysts are closely watching the $1.45 level, which could signal a stronger rally if broken.
    3. Why is whale accumulation important? Large investors buying XRP often indicates confidence and has historically preceded significant price movements.
    4. Can XRP reach higher price targets? Higher prices are possible if market capitalization grows through increased demand, broader adoption, and favorable market conditions.
    5. What are the biggest risks for XRP? Crypto market volatility, profit-taking, weak investor sentiment, slower institutional adoption, and failure to break key resistance levels could limit gains.

    Disclaimer: This article is provided for informational purposes and does not constitute investment advice. You are responsible for conducting your own research (DYOR) before making any investments.

  • MEXC Secures Second Place in TradFi Perpetual Futures with $323.9 Billion Volume, CoinGecko Report Reveals

    MEXC Secures Second Place in TradFi Perpetual Futures with $323.9 Billion Volume, CoinGecko Report Reveals

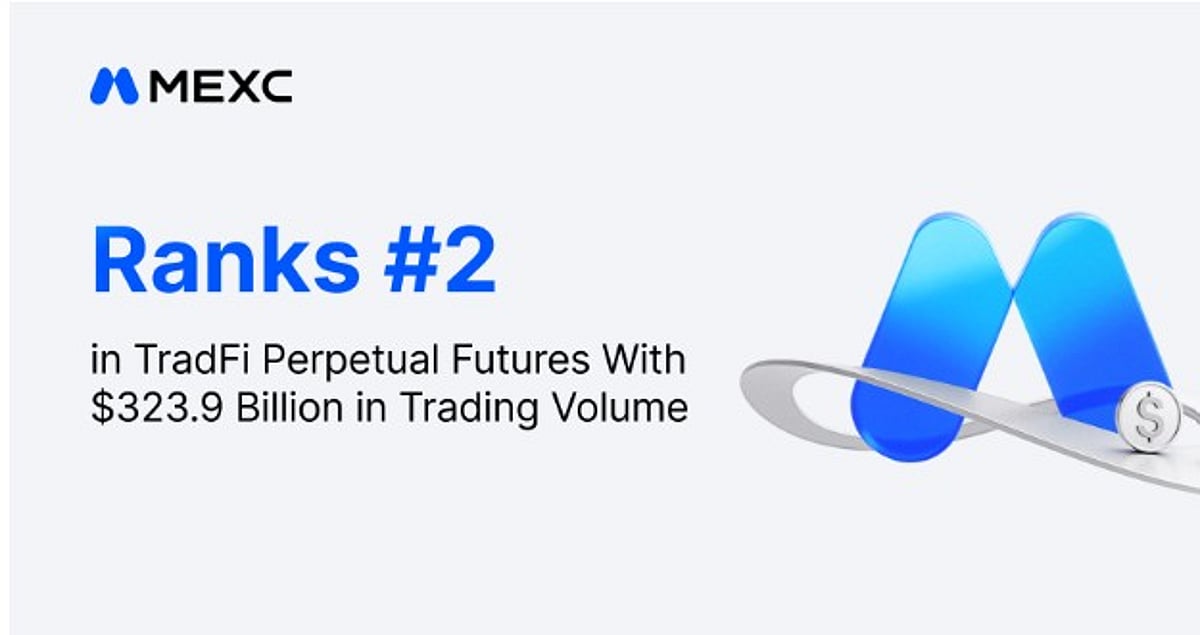
    MEXC, a leading 0-fee digital asset trading platform, has emerged as a top performer in CoinGecko’s newly released TradFi on Crypto Exchanges Report 2026. The exchange ranked second in TradFi Perpetual Futures trading volume, recording an impressive $323.86 billion between January 2025 and May 2026, while also leading all exchanges in the total number of RWA and TradFi product listings.

    According to the report, MEXC listed 358 RWA Spot and TradFi Perpetual Futures products during the review period, the highest among all centralized and decentralized exchanges tracked. This includes 199 RWA Spot and 159 TradFi Perpetual Futures, providing users with extensive access to stocks, commodities, and other traditional financial assets.

    In terms of trading volume, MEXC’s cumulative TradFi Perpetual Futures volume reached $323.86 billion, second only to Binance. The exchange’s average monthly market share in this segment rose from 21.7% in 2025 to 22.8% in the first five months of 2026. Notably, this growth occurred during a period of rapid expansion in the overall TradFi Perpetual Futures market, indicating that MEXC’s trading volume grew faster than the market average.

    “From product listings and cumulative trading volume to monthly market share, the CoinGecko report reflects MEXC’s progress in RWA and TradFi trading,” the exchange stated. “Looking ahead, MEXC will continue to expand its RWA and TradFi offerings under its ‘Infinite Opportunities’ vision, refining the trading experience and making it easier for global users to access a broader range of assets.”

    MEXC, trusted by more than 40 million users across 170+ markets, offers industry-leading 0-fee trading and access to over 3,000 digital assets. The platform serves as a gateway for trading cryptocurrencies alongside tokenized assets, including stocks, ETFs, commodities, and precious metals.