Tag: trading volume

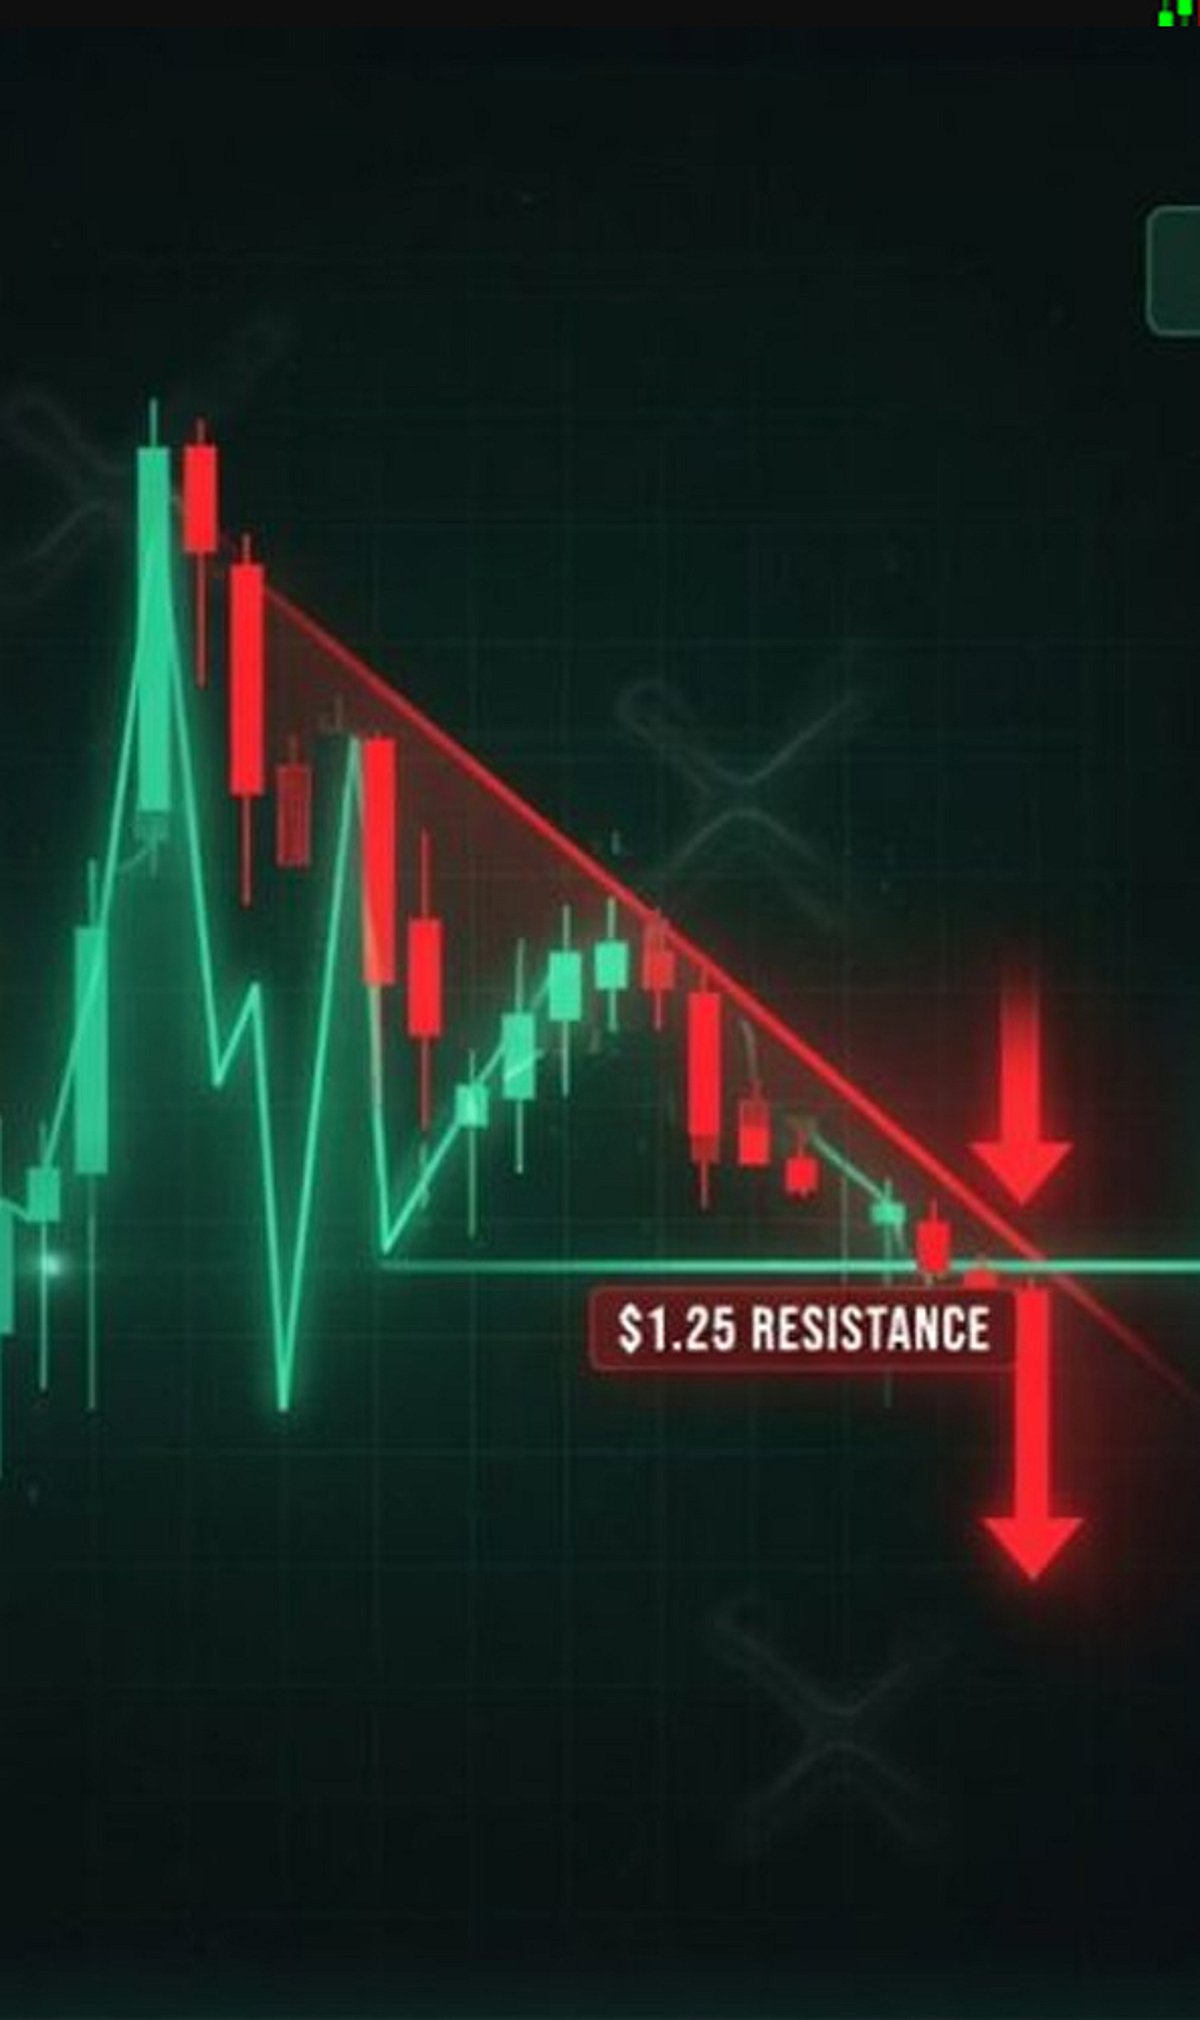
  • XRP Price Analysis: Crucial Support and Resistance Levels Traders Must Monitor

    XRP Price Analysis: Crucial Support and Resistance Levels Traders Must Monitor

    XRP’s price action is approaching a critical juncture, with several technical and on-chain indicators offering clues about its next major move. Traders should keep a close watch on these key levels and signals to navigate potential volatility.

    Major Support Zone

    Strong buying interest has been observed near recent support levels, which may help prevent deeper declines. However, losing this zone could trigger increased selling pressure and heightened volatility.

    Key Resistance Level

    A decisive close above resistance, accompanied by rising trading volume, could confirm renewed bullish momentum and attract additional institutional and retail participation.

    Trading Volume

    Higher trading volumes during price moves typically validate breakouts, while weak volume often indicates false moves and short-lived momentum. Always confirm breakouts with volume.

    Moving Averages

    Watch the 50-day and 200-day moving averages closely. Crossovers often signal trend changes and provide important dynamic support or resistance levels.

    Relative Strength Index (RSI)

    The RSI helps identify overbought and oversold conditions, enabling traders to anticipate possible trend reversals or continuation before major price movements.

    Market Sentiment

    Regulatory developments, ETF expectations, and broader cryptocurrency sentiment significantly influence XRP’s price direction and short-term trading opportunities.

    Whale Activity

    Large wallet transactions and exchange inflows often precede significant price swings, making on-chain monitoring essential for active XRP traders.

    Bitcoin Correlation

    XRP frequently follows Bitcoin’s broader market trend. Strong Bitcoin rallies or corrections can quickly impact XRP’s momentum and investor confidence.

    Breakout Confirmation

    Traders should wait for sustained price action above resistance or below support, supported by strong volume, before confirming a new trend.

  • Solana at a Crossroads: FUD and Key Resistance Challenge SOL’s Next Move

    Solana at a Crossroads: FUD and Key Resistance Challenge SOL’s Next Move

    Solana (SOL) is trading at $77.97 as the broader cryptocurrency market grapples with rising fear, uncertainty, and doubt (FUD). This cautious sentiment has kept buyers on the sidelines, making it difficult for SOL to build upward momentum. The next significant price move hinges on whether bulls can overcome a critical resistance level or if bears will drive prices lower.

    Fear Dampens Buyer Confidence

    Recent market-wide FUD has weighed heavily on buyer confidence. When uncertainty prevails—often fueled by regulatory concerns, macroeconomic factors, or fear of further declines—many traders choose to wait rather than open new positions. This reduced buying activity gives sellers more control, making it challenging for even fundamentally strong projects like Solana to rally in the short term.

    Key Resistance Remains a Major Hurdle

    SOL faces a significant resistance zone near its current price. Resistance is a price level where selling pressure typically intensifies as traders expect the asset to struggle. For SOL to break higher, buyers must demonstrate enough strength to push through this barrier. A successful breakout, especially on high trading volume, could restore confidence and attract fresh demand, signaling a potential shift toward bullish momentum.

    Support Levels Provide a Safety Net

    While resistance gets much attention, support levels are equally critical. Support refers to a price area where buying interest typically emerges to prevent further declines. If SOL holds above these support zones, it may build a stronger foundation for a recovery attempt. However, a break below support could accelerate selling pressure and push the price toward lower levels.

    Volume and Momentum Indicators Offer Clues

    Price action alone is not enough to confirm a trend. Trading volume provides insight into the strength behind a move. A breakout above resistance accompanied by high volume is more likely to be sustainable. Conversely, a price rise on low volume may lack conviction. Traders also monitor momentum indicators like the Relative Strength Index (RSI) and Moving Average Convergence Divergence (MACD) to gauge whether buyers or sellers have the upper hand.

    Long-Term Fundamentals Remain Strong

    Despite short-term uncertainty, Solana’s underlying ecosystem continues to thrive. Known for its high transaction speeds and low fees, Solana remains a preferred platform for decentralized finance (DeFi) applications, NFT projects, and developer activity. Institutional interest has also grown compared to previous market cycles, reinforcing confidence in the network’s long-term potential.

    What Could Happen Next

    Solana has reached a critical juncture. If it breaks above resistance on strong volume, buyer confidence could return, potentially leading to a bullish phase. On the other hand, repeated failure to clear resistance may invite more selling pressure, pushing SOL lower to test deeper support levels before the next recovery.

    Frequently Asked Questions

    1. What is the current price of Solana (SOL)?
    Solana is trading at $77.97, reflecting cautious market sentiment.

    2. Why is Solana’s price struggling to gain upward momentum?
    Market-wide FUD has reduced buyer confidence, allowing sellers to dictate short-term price action.

    3. What happens if Solana breaks past its current resistance level?
    A breakout above resistance, supported by strong volume, could signal that buyers have taken control and spark a new bullish phase.

    4. Why are trading volume and momentum indicators important?
    High volume confirms the strength of a price move, while tools like RSI and MACD help identify whether buyers or sellers are dominant.

    5. Does the current FUD affect Solana’s long-term outlook?
    No. While short-term sentiment is weak, Solana’s fast, low-cost network and active developer community continue to support its long-term value.

  • XRP Surges Past $1.15 Amid 62% Volume Spike and Falling Exchange Supply

    XRP Surges Past $1.15 Amid 62% Volume Spike and Falling Exchange Supply

    XRP rebounded sharply this week, climbing back above $1.15 after finding solid support near the $1.03 level. The recovery was fueled by a dramatic 62% surge in daily trading volume, which reached $1.8 billion, signaling renewed trader interest and liquidity in the market.

    Trading Activity Accelerates as XRP Recovers

    The latest rebound follows a challenging June for XRP holders, during which the token retreated from February highs above $1.55 to a low between $1.00 and $1.04 by late June. That decline marked one of the largest holder drawdowns in over a decade. Despite the price drop, institutional demand for XRP-linked spot exchange-traded funds (ETFs) weakened, with net inflows falling from $132 million in May to just $59 million in June — a 55% monthly decline.

    However, on-chain metrics painted a more optimistic picture. According to Santiment, daily active addresses on the XRP Ledger climbed to their highest level since February, when XRP was trading between $1.47 and $1.54. This suggests that retail and network activity is on the rise even as institutional inflows cool.

    Binance Supply Shrinks While Futures Reset

    Data from CryptoQuant researcher ArabxChain showed that the XRP Binance Scarcity Index reached 0.77, its highest reading in more than two years. Binance’s XRP reserves have fallen by roughly 20% since November 2024, dropping from around 3.27 billion tokens to nearly 2.6 billion. Exchange holdings also declined from approximately 2.8 billion in May to 2.6 billion in early July, indicating tightening supply.

    In addition to lower exchange balances, analyst ChartNerd highlighted what was described as XRP’s “3rd Retest” on social media platform X, identifying the pattern as a favorable entry area for traders building positions through technical analysis.

    Technical Levels Remain in Focus

    Futures market data from Coinglass revealed that funding rates turned deeply negative between June 26 and June 28 as XRP hit its recent low. This positioning set the stage for a short squeeze, which subsequently pushed XRP toward $1.13 as funding rates returned to slightly positive territory, signaling more balanced futures positioning.

    Looking ahead, immediate resistance sits near $1.20, a level that capped the mid-June recovery attempt. A daily close above that threshold would expose the $1.35 to $1.40 range, representing roughly 22% upside from current prices. The daily Relative Strength Index (RSI) remains near 55, indicating room for further gains before reaching overbought conditions. The 200-day Exponential Moving Average (EMA) stands near $1.50, while a move below $1.00 would invalidate the current recovery structure.

    Notably, XRP trading volume recently surpassed that of Bitcoin on South Korean exchange Upbit, adding another data point as traders watch whether stronger demand continues to develop.

    What’s Next?

    XRP has successfully recovered above $1.15 after finding support near $1.03, supported by increased trading volume and strengthening XRP Ledger activity. Meanwhile, declining reserves on Binance and improving futures positioning reflect shifting market dynamics. Investors will now be watching closely to see whether XRP can break decisively above the $1.20 resistance level in the coming sessions.

  • XRP Surpasses Bitcoin in Upbit Volume as $1.15 Becomes Next Target

    XRP Surpasses Bitcoin in Upbit Volume as $1.15 Becomes Next Target

    XRP has overtaken Bitcoin in 24-hour trading volume on Upbit, South Korea’s largest digital asset exchange, as the token holds above the reclaimed $1.10 level. The surge in activity places XRP among the busiest assets on the platform and shifts market focus toward the $1.15 resistance level.

    XRP Overtakes Bitcoin in Upbit Trading

    Over the past 24 hours, XRP recorded approximately 113.18 million XRP in trading volume on Upbit, surpassing Bitcoin during that period. South Korea has historically been a major hub for XRP trading, and sharp increases in activity on Korean exchanges often attract broader market attention.

    Rising volume alongside price typically signals wider market participation, suggesting that more buyers have entered the market rather than a narrow group of traders driving the move. However, volume alone does not guarantee sustained gains — price direction depends on whether buyers can maintain support and absorb renewed selling pressure.

    Break Above $1.10 Changes the Technical Setup

    XRP recently reclaimed the $1.10 level after struggling for weeks to break above it. Previous recovery attempts repeatedly stalled at that zone, making the latest breakout more significant for traders. Buyers have so far defended support above the former resistance, helping XRP form a sequence of higher highs and higher lows — a pattern often associated with strengthening bullish momentum.

    Still, the structure remains incomplete without sustained buying above the breakout zone. A quick drop below $1.10 could weaken the setup and return XRP to sideways trading. Conversely, continued support would keep the $1.15 level as the next critical test for buyers.

    Low Average Returns Fuel Relief Rally Expectations

    A recent Santiment Data post highlighted historically low average returns on the XRP Ledger, which analysts have linked to the potential for a relief rally. This development coincides with signs of altcoin rotation in the broader cryptocurrency market. XRP’s price action is therefore unfolding within a mixed market that continues to send uneven signals.

    Traders are closely monitoring average returns, trading activity, and nearby technical levels to gauge whether the current move develops into a stronger trend or loses momentum. Regulatory clarity and institutional interest have also kept XRP in focus throughout 2026, while ongoing development on the XRP Ledger supports continued attention on the asset.

    Cryptocurrency markets remain volatile, and prices can change rapidly. Readers should conduct independent research before making investment decisions.

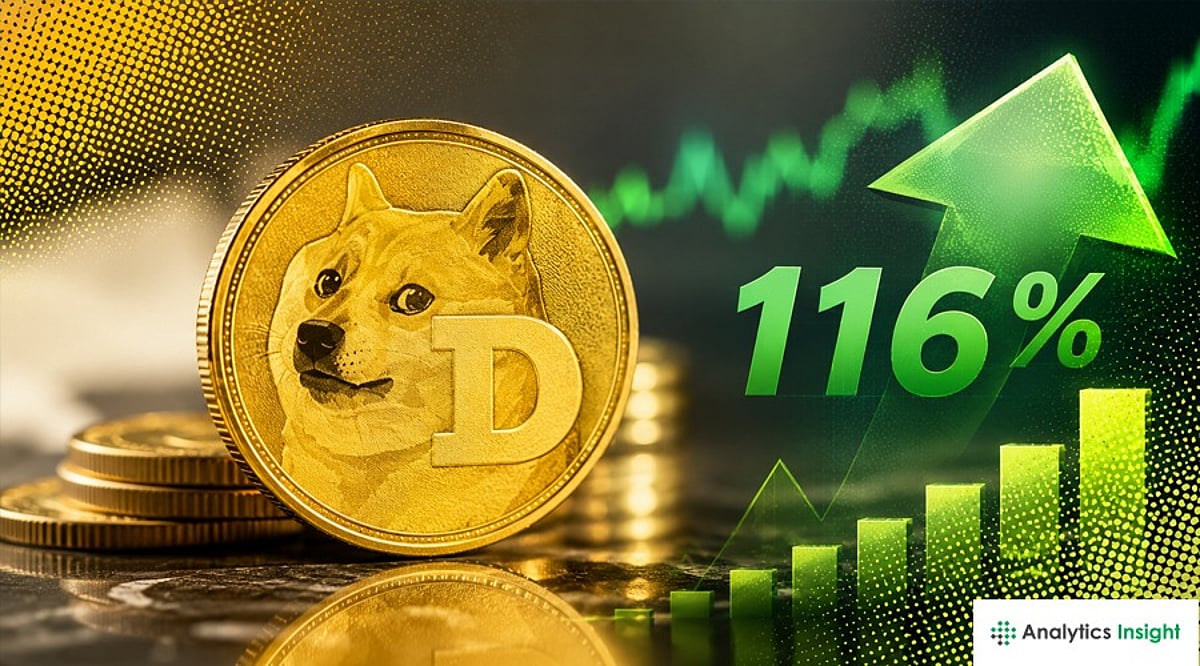
  • Dogecoin Trading Volume Surges 116% as Price Holds Near Critical Support Level

    Dogecoin Trading Volume Surges 116% as Price Holds Near Critical Support Level

    Dogecoin has drawn renewed attention after trading activity rose sharply while its price remained near local lows. Major exchanges recorded a more than 116% jump in DOGE volume over the previous day. The coin still trades below key moving averages and remains in a clear downtrend.

    As of June 25, 2026, DOGE is trading near $0.076 (approximately Rs. 7.15 to Rs. 7.50), down nearly 11% over the past seven days. Despite this decline, daily trading volume has stayed high at roughly $900 million to $950 million. Dogecoin’s market capitalization stands near $11.7 billion, keeping it among the largest cryptocurrencies by market cap. However, price action remains weak, and the asset struggles to recover after losing a key support level.

    The sharp volume increase is significant because active markets often signal stronger participation. Traders are watching not just the price but also whether sellers continue to dominate or if buyers begin to absorb supply.

    Key Support and Resistance Levels

    The most important price band now sits between $0.075 and $0.085. Traders view this zone as DOGE’s main support area. The 200-day moving average also sits near $0.0859, adding weight to that level. DOGE has stayed below major moving averages for some time, keeping the broader trend negative. Buyers have not yet forced a sustained recovery, and sellers still control short-term momentum.

    If DOGE loses the support zone, analysts see further downside ahead. The first lower target is near $0.070, and if selling pressure deepens, the next area of interest lies around $0.065.

    Long Positions Still Dominate

    Despite weak price action, long-to-short ratios remain tilted toward bullish bets across major exchanges. OKX shows an even stronger long bias, while Binance traders keep the ratio above 2. This setup creates risk if support breaks, as crowded long positions can fuel liquidations during a sharp move lower. However, the same positioning can also support a strong rebound if the price stabilizes near resistance.

    For now, $0.085 remains the first major hurdle for bulls. A break above that level could improve sentiment and attract more speculative demand. Until then, Dogecoin continues to trade under pressure while volume stays elevated.

    What’s Next?

    Despite the recent decline, trading volume surged more than 116%, showing renewed market participation. With bullish long-to-short ratios still dominant, traders are closely watching whether DOGE stabilizes for a recovery or faces further downside toward lower support levels.