Tag: volatility

  • Bitcoin SIP Over Five Years: A Strategic Guide to Long-Term Crypto Investment

    Bitcoin SIP Over Five Years: A Strategic Guide to Long-Term Crypto Investment

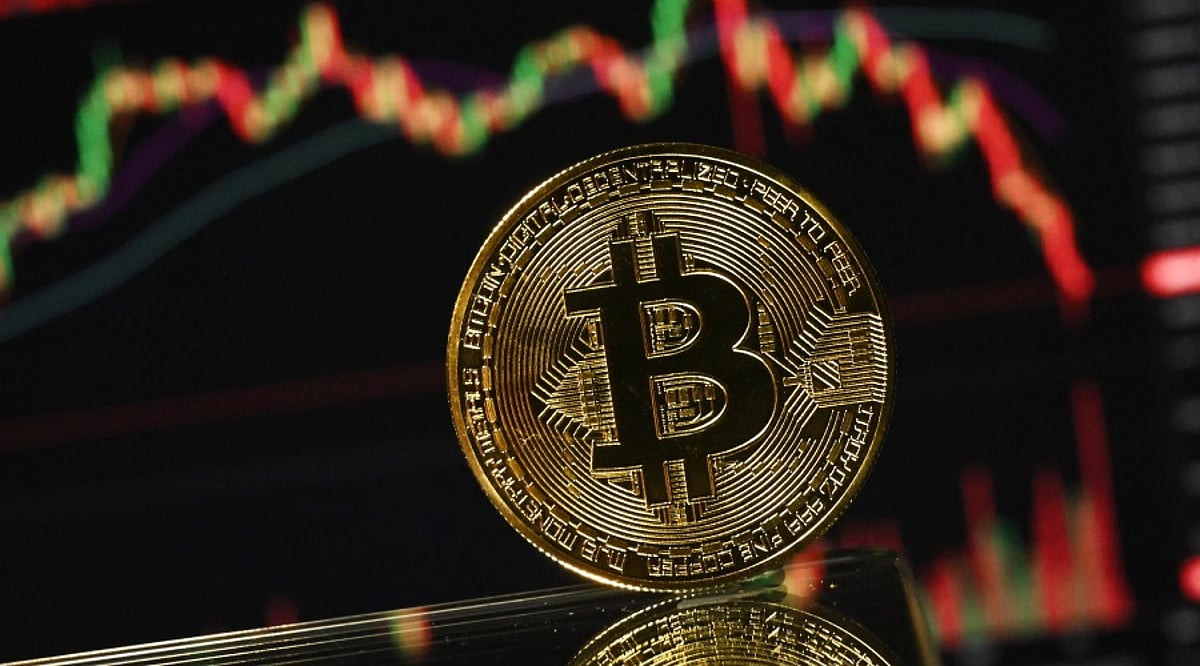
    A Bitcoin Systematic Investment Plan (SIP) involves committing a fixed amount to Bitcoin at regular intervals—weekly, monthly, or quarterly—over an extended period. Instead of making a lump-sum purchase, investors spread their buys across time, aiming to reduce the impact of price volatility while building a disciplined investment habit. This article explains how a five-year Bitcoin SIP works, what role market swings play, and what investors should consider before committing.

    What Is a Bitcoin SIP?

    A Bitcoin SIP is a recurring investment strategy where you buy a set dollar or crypto amount of Bitcoin on a predetermined schedule. For example, you might invest $100 every month for five years. The core idea is dollar-cost averaging: by buying regularly, you automatically purchase more Bitcoin when prices are low and less when prices are high, potentially lowering your average entry price over time.

    The Five-Year Approach

    A five-year time horizon shifts the focus from short-term price movements to consistent, long-term accumulation. Investors continue buying through bull markets and bear markets alike, which can help smooth out the effects of extreme volatility. The strategy does not guarantee profits, but it removes the pressure of trying to time the market perfectly.

    Managing Market Volatility

    Bitcoin is known for dramatic price swings. Over five years, some purchases will occur at peaks and others at troughs. This range of entry prices can work in your favor if the overall trend is upward, but it remains a risk. Volatility means the portfolio value can still drop significantly, especially if a large portion of purchases happened at high prices before a prolonged downturn.

    Compounding and Bitcoin

    Unlike interest-bearing accounts or dividend-paying stocks, Bitcoin does not generate passive income just by being held. Therefore, a Bitcoin SIP does not benefit from compounding in the traditional sense. Growth depends solely on Bitcoin’s market price appreciating over time. There is no automatic reinvestment of earnings; any gain comes from price increases.

    Investment Discipline Matters

    Sticking to a predefined contribution schedule is crucial. Emotional reactions—like stopping contributions when prices crash or increasing them during a rally—can undermine the strategy. A SIP enforces discipline, but investors should periodically reassess whether Bitcoin still aligns with their financial goals and risk tolerance.

    Risks to Consider

    Bitcoin investments carry substantial risks: price volatility, regulatory changes, cybersecurity threats, exchange failures, and potential loss of access to funds. A five-year horizon does not eliminate these dangers. Investors must understand custody solutions, use reputable platforms, secure their accounts, and never invest money they cannot afford to lose.

    Evaluating Performance After Five Years

    At the end of the period, compare total contributions to the portfolio’s market value. The net gain or loss depends on the prices at which Bitcoin was bought, the frequency of investments, fees, and Bitcoin’s overall price performance. Past results are not indicative of future returns, so treat any outcome as a data point, not a guarantee.

    A five-year Bitcoin SIP can be a structured way to gain exposure to cryptocurrency while mitigating timing risk, but it requires patience, discipline, and a clear-eyed view of the risks involved.


  • XRP’s Three-Month Volatility Low Raises Utility Questions as Price Holds Near $1.06

    XRP’s Three-Month Volatility Low Raises Utility Questions as Price Holds Near $1.06

    XRP has entered a notably quieter trading phase, with its 30-day realized volatility dropping to a three-month low of approximately 0.34 on Binance. According to CoinCodex, the token is currently trading near $1.06, a stabilization that follows weeks of sharper price swings.

    What Falling Realized Volatility Means for XRP

    Realized volatility measures an asset’s actual price movement over a specific period, reflecting past fluctuations rather than expected future conditions. CryptoQuant analyst Arab Chain noted that the decline indicates a clear reduction in daily price swings, describing the current action as relatively calm after a period of heightened volatility.

    The lower reading suggests that buyers and sellers have reached a temporary balance. Traders appear hesitant to open large positions until fresh information or stronger market momentum emerges.

    Traders Await the Next Market Catalyst

    Calmer markets often produce tighter ranges, weaker speculative activity, and less trading noise. However, extended volatility compression can precede a sharp move when new momentum arrives. Market participants are watching trading volume and open interest for signs that stronger participation has returned.

    Several catalysts remain in focus, including regulatory clarity in the United States, Ripple ecosystem growth, institutional adoption, derivatives positioning, macroeconomic developments, and broader crypto market sentiment. Recent attention has also been drawn to Google search results identifying XRP as a leading world bridge currency. Some analysts have discussed the possibility of a wider macro breakout and an early Wave 3 advance, though they link further gains to a sustained move above key resistance levels.

    Still, lower realized volatility offers no directional signal, as the eventual breakout could move in either direction.

    Utility Becomes the Core Value Argument

    Evernorth Chief Business Officer Sagar Shah argued that market price should not be the primary measure of XRP’s value. Speaking during a Q&A session on X, Shah said XRP is designed to move value across financial systems. While price attracts constant attention and dominates headlines, he presented utility as a stronger indicator of long-term value.

    Shah cited liquidity provision, cross-border settlement, lending, and tokenized assets as key uses within the XRP ecosystem. He emphasized that the most important signal comes from how XRP operates, rather than how it trades.

    For now, XRP remains near $1.06 while Binance realized volatility sits at a three-month low. Traders continue tracking market participation as the consolidation phase develops.

  • Japan and US Stage Rare Joint Intervention to Stabilize Yen Amid Rising Volatility

    Japan and US Stage Rare Joint Intervention to Stabilize Yen Amid Rising Volatility

    Japan and the United States have carried out a rare coordinated currency intervention to support the yen and curb disorderly market movements. Tokyo also signaled readiness for further action as a weaker currency and higher oil prices pressure Japan’s economic outlook.

    Joint Action Targets Sharp Yen Swings

    Japan’s Ministry of Finance confirmed the operation on Monday after intervention took place on Friday, July 31. Officials said both countries acted to curb excessive volatility and disorderly movements in the yen. Japan bought yen during Friday’s operation in coordination with the US Treasury. The action followed months of pressure on the currency, which recently traded near four-decade lows against the dollar.

    The ministry linked the move to the Japan-US Finance Ministers’ Joint Statement issued in September 2025. That agreement allows intervention when exchange rates show excessive volatility or disorderly movement. It also calls for transparent reporting of currency operations.

    Finance Minister Satsuki Katayama said Tokyo would keep close contact with Washington. She added, “We will not hesitate to carry out further coordinated interventions.” The United States also signaled support for further action. Treasury Secretary Scott Bessent said Washington backed Japan’s measures and stood ready to join another operation. The coordinated action was the first involving both countries since 2011.

    Meanwhile, the yen strengthened after Japan confirmed the intervention. It moved above 155 per dollar before giving back part of the gain. Traders continued to watch for more official buying. Markets now remain alert to further policy signals from both governments.

    FIMA Facility Adds Another Funding Option

    Japan also plans to use the Federal Reserve’s Foreign and International Monetary Authorities (FIMA) Repo Facility. The FIMA facility gives approved foreign monetary authorities access to short-term dollar funding. Under the program, authorities can temporarily exchange US Treasury securities for dollars, providing liquidity without forcing them to sell Treasury holdings directly in the open market.

    Japan’s ministry stated, “Japan plans to utilize the Federal Reserve’s FIMA Repo Facility in the future.” Tokyo can use the program to manage dollar needs during market stress. Additionally, the facility may support future intervention operations when authorities need dollar liquidity. However, access depends on the amount of eligible Treasury securities pledged as collateral. The ministry said it would maintain regular communication with the US Treasury and keep monitoring foreign exchange conditions to respond to disorderly moves.

    Weak Yen Adds Pressure on Japan’s Economy

    The intervention comes as Japan faces weaker growth and higher import costs. A soft yen raises the local cost of crude oil, food, and other imports. Japan recently cut its fiscal 2026 growth forecast to 0.9% from 1.3%, citing higher energy costs linked to Middle East tensions and pressure on household spending and company earnings.

    Moreover, the government lowered its private consumption forecast to 0.9% from 1.3% and reduced its capital spending growth estimate to 2.3% from 2.8%. Japan depends heavily on imported energy, so high oil prices and a weak currency can raise costs across transport, manufacturing, and household budgets.

    The Bank of Japan also faces close market attention. It kept its policy rate unchanged at 1% last week but left room for another increase. However, currency intervention and interest-rate policy serve different roles: the finance ministry manages exchange-rate operations, while the central bank sets monetary policy.

  • Bitcoin’s $9.57 Billion Options Expiry Nears as Volatility Hits Two-Year Low

    Bitcoin’s $9.57 Billion Options Expiry Nears as Volatility Hits Two-Year Low

    Bitcoin is bracing for a major month-end options expiry on Friday, July 31, with approximately 149,000 contracts worth $9.57 billion set to settle. The event arrives as the cryptocurrency trades near its $64,000 max-pain level, a price point that could amplify price swings once contracts are settled.

    Bitcoin Options Expiry Centers on $64,000

    The expiring batch carries a put/call ratio of 0.28, indicating a heavy dominance of call options over puts. Max pain sits near $64,000, close to Bitcoin’s spot price during Friday’s session. Open interest remains concentrated at higher strike prices on Deribit, with the $70,000 and $72,000 strikes each holding about $2.4 billion. The $60,000 strike carries approximately $1.3 billion.

    Across exchanges, total Bitcoin options open interest has climbed to roughly $34.7 billion, according to Coinglass, meaning the expiring batch represents a substantial portion of outstanding exposure.

    Low Volatility Meets Heavy Contract Settlement

    Bitcoin briefly moved above $65,000 early Friday but quickly retreated toward $64,325. The asset has remained within a broad consolidation range for about two months. Live market data showed a Friday range between $63,839 and $65,328.

    Analyst Daan noted that Bitcoin has reached its lowest weekly volatility in two years. That compressed price action now meets one of the market’s largest recent options expiries, raising questions about whether the event could finally disrupt the two-month consolidation.

    Deribit pointed to cautious macro signals continuing to pressure Bitcoin, while identifying market stabilization and renewed capital inflows as key indicators to watch.

    Ethereum Adds $825 Million to Expiry Event

    Around 433,000 Ethereum options contracts also expire Friday, with a notional value near $825 million. The contracts carry a 0.59 put/call ratio and a $1,800 max-pain level. Ether has traded within a narrow range near $1,900 during recent sessions. Total Ethereum options open interest across exchanges remains near $5.4 billion.

    Together, the Bitcoin and Ethereum expiries reach approximately $10.4 billion. Meanwhile, the broader crypto market returned to about $2.3 trillion after losing nearly $25 billion during the week.

    The weekly retreat followed the Federal Reserve’s decision to hold interest rates steady and the resumption of military action between the United States and Iran.

    Market participants will watch settlement flows, capital movement, and price stability for signs of renewed volatility in the days ahead.

  • Bitcoin Volatility Spikes: 9 Key Factors Driving the Renewed Price Swings

    Bitcoin Volatility Spikes: 9 Key Factors Driving the Renewed Price Swings

    Bitcoin volatility is on the rise again, with prices swinging more sharply than in recent months. Traders and investors are watching closely as a combination of institutional moves, macroeconomic shifts, and market mechanics create repeated bouts of turbulence. Below are the nine primary drivers behind Bitcoin’s renewed price instability.

    • Institutional Trading: Large institutional investors deploy significant capital in a short time, causing rapid price swings as major buy or sell orders affect market liquidity on exchanges.
    • Macroeconomic Uncertainty: Interest rates, inflation data, and global economic concerns influence investor sentiment, increasing Bitcoin’s price fluctuations across financial markets worldwide.
    • Leveraged Trading: High leverage in crypto futures amplifies both gains and losses, triggering cascading liquidations that accelerate short-term Bitcoin price volatility during market moves.
    • ETF Fund Flows: Inflows and outflows from Bitcoin ETFs create buying and selling pressure, contributing to sudden price movements and heightened daily volatility.
    • Regulatory Developments: Government regulations, policy announcements, and legal actions affect investor confidence, often leading to sharp Bitcoin price reactions across global markets.
    • Whale Activity: Large Bitcoin holders buying or selling substantial amounts can significantly influence market prices, creating sudden volatility on cryptocurrency exchanges.
    • Market Sentiment: Fear, optimism, and speculative trading quickly shift investor behavior, causing rapid Bitcoin price changes during uncertain market conditions.
    • Global News Events: Geopolitical tensions, financial crises, and major economic announcements increase risk sentiment, often resulting in stronger Bitcoin market volatility.
    • Lower Market Liquidity: Reduced trading liquidity during certain periods allows relatively smaller trades to create larger Bitcoin price movements and wider market fluctuations.

    Understanding these factors can help investors navigate the current environment of heightened volatility. As the crypto market matures, such price swings are likely to remain a key characteristic of Bitcoin trading.

  • Indian Stock Market Update: Nifty 50 Holds Above 24,000, Sensex Targets 77,800 as Global Volatility Persists

    Indian Stock Market Update: Nifty 50 Holds Above 24,000, Sensex Targets 77,800 as Global Volatility Persists

    The Indian stock markets are expected to open lower amid weak global cues, as the ongoing US-Iran conflict continues to weigh on risk sentiment. GIFT Nifty also indicates a gap-down start, trading at 24,056 with a discount of 187 points from its previous Nifty futures close.

    On Monday, the Sensex gained 47.01 points or 0.06% to settle at 77,616.40, while the Nifty 50 rose 4.10 points or 0.02% to finish at 24,211. The broader markets, Nifty Midcap 100 and Nifty Smallcap 100, ended on a flat note. The Indian rupee opened 32 paise lower at Rs. 95.94 per dollar on Tuesday against Monday’s close of Rs. 95.62.

    Sensex Outlook

    Technically, the Sensex formed a bullish candle on the daily chart and recovered its morning losses.

    “The 77,000 would act as a key support zone for short-term traders. As long as the market trades above this level, the uptrend wave is likely to continue. On the higher side, 77,800 would act as an immediate resistance for day traders. If the market successfully breaks that level, the rally could continue till 78,000-78,500. On the flip side, below 77,000, the uptrend would become vulnerable. Below this level, traders may prefer to exit their long positions,” said Shrikant Chouhan, Head of Equity Research at Kotak Securities.

    Nifty 50 Outlook

    Nifty 50 formed a small bullish candle on the daily chart, reflecting continued buying interest at lower levels.

    With weekly expiry today, traders should be prepared for heightened volatility and sharp intraday swings as derivatives positions are adjusted throughout the session. Right now, 24,000 is the ultimate floor. Slipping below this point will likely trigger a deeper slide and ruin the near-term chart setup. On the flip side, any bounce faces a heavy ceiling in the 24,200 to 24,300 zone. Because global headlines are running the show, upcoming expiry-day hedging could easily whip up extra wild price swings. Traders should avoid aggressive positions at the open and focus on disciplined, level-based execution. Expect volatility to remain elevated throughout the day, especially around key support and resistance levels.

    Bank Nifty Outlook

    On Monday, Bank Nifty rose 5.55 points or 0.15% to close at 58,131.45, forming a bullish candle on the daily chart, indicating buying interest at lower levels.

    It has been consolidating within the 56,500-58,500 range over the last four weeks, indicating a healthy pause after the previous up move. On the upside, 58,700 remains the immediate hurdle, said Bajaj Broking Research. “Failure to move above 58,700 will signal extension of last 4 weeks consolidation. On the downside, 57,400-57,500 is expected to act as the immediate support, coinciding with Thursday’s gap-up zone and Monday’s low. The major support is placed at 56,500, where the 20-week and 50-week EMAs converge along with the previous week’s low, making it a strong demand zone,” the brokerage added.

    Disclaimer: Analytics Insight does not provide financial advice or guidance on cryptocurrencies and stocks. This article is provided for informational purposes and does not constitute investment advice. You are responsible for conducting your own research (DYOR) before making any investments.

  • SpaceX’s Rapid NASDAQ 100 Entry Could Trigger $4.3 Billion in Passive Fund Inflows

    SpaceX’s Rapid NASDAQ 100 Entry Could Trigger $4.3 Billion in Passive Fund Inflows

    SpaceX officially joined the NASDAQ 100 index on Tuesday, July 7, 2026, just 15 trading days after its historic public market debut. The swift inclusion follows NASDAQ’s revised entry rules designed to accommodate large new listings, making the rocket and satellite company one of the fastest additions to the benchmark.

    The company’s IPO on June 12 priced at $135 per share and raised $75 billion — the largest IPO on record. With its market capitalization now above $2 trillion, SpaceX’s inclusion in the NASDAQ 100 ensures that millions of index fund investors gain automatic exposure to the stock through ETFs and mutual funds, including those tracking the Invesco QQQ complex.

    Passive Buying Pressure Expected

    J.P. Morgan estimates that the index inclusion could generate approximately $4.3 billion in passive fund inflows. This buying is driven by index rules rather than a fundamental view on the company, meaning fund managers must adjust their portfolios to match the new benchmark composition.

    However, SpaceX’s starting weight in the index will be limited. Despite its massive market cap, only about 5% of shares are freely traded. NASDAQ uses free-float market capitalization in its index calculations, keeping SpaceX’s initial weight near 1% to 1.3%.

    Volatility Risks Remain

    SpaceX shares surged after the IPO, reaching a post-listing high near $225.64 before pulling back to around $160 just ahead of the index entry. Even after the decline, the stock remains above its $135 IPO price and $150 opening price.

    Avery Marquez of Renaissance Capital noted, “IPOs are inherently volatile, and especially in those early weeks.” The small float — combined with broader market volatility — could amplify price swings. The Cboe NASDAQ 100 Volatility Index rose about 43% through Thursday, compared with an 8% rise for the Cboe Volatility Index tied to the S&P 500.

    S&P 500 Entry Still Distant

    While SpaceX has joined the NASDAQ 100, its inclusion in the S&P 500 is not imminent. S&P Dow Jones Indices requires a one-year listing and profitability standards, which SpaceX has not yet met. This gap means that passive demand from S&P 500 index funds will come later, if at all.

    Lockup expirations also loom. Early investors and employees may become eligible to sell shares in stages. Louis Navellier of Navellier & Associates said he would consider buying SpaceX after insiders sell some shares and once the company appears ready to report a profitable quarter, highlighting the uncertainty around public market performance.