Category: Cryptocurrency

  • Coinbase Adds Native INJ Support: Trading, Deposits, and Withdrawals Now Live

    Coinbase Adds Native INJ Support: Trading, Deposits, and Withdrawals Now Live

    Coinbase has officially launched support for Injective’s native INJ token, enabling spot trading, deposits, and withdrawals directly through the Injective network. The update provides users with direct access to INJ transfers and exchange services without relying on wrapped or bridged versions.

    With this rollout, Coinbase customers can buy and sell INJ on the exchange’s spot market and transfer the token between Coinbase and external Injective addresses. The exchange documents asset launches and transfer availability on its status history page, allowing users to check current operating status before placing orders or initiating transfers.

    This launch follows a previous integration where Coinbase’s x402 protocol launched on Injective, enabling artificial intelligence agents to pay network fees. The latest update, however, focuses on direct retail access to INJ trading and native network transfers.

    Deposits and Withdrawals Enable Self-Custody

    Native support allows deposits and withdrawals to move through Injective’s own network infrastructure. Unlike a trading-only listing, holders can now withdraw INJ to compatible external wallets and deposit native tokens into Coinbase before selling or using exchange services.

    This functionality matters because it gives users control over where they store their tokens and allows them to move INJ between Coinbase, personal wallets, and other compatible platforms. However, customers must select the correct network before sending tokens. A transfer through an unsupported blockchain or token format could prevent Coinbase from crediting the deposit.

    Coinbase’s transfer guidance advises users to verify network compatibility and asset formats. Customers should review deposit or withdrawal details displayed inside their accounts before approving transactions.

    Listing Widens Injective’s Market Visibility

    As a widely monitored cryptocurrency exchange, Coinbase’s support increases INJ’s visibility among users who rely on the platform for spot purchases and digital asset transfers. The update covers three common exchange functions—buying, depositing, and withdrawing—through the Injective network.

    Broader exchange availability can make an asset easier to discover and access. Nevertheless, a new listing does not confirm future demand, market performance, or lasting price movement. This development follows other Coinbase events, including the settlement of the SEC’s Gensler-era lawsuit against the company.

    Users should confirm that Coinbase displays the native Injective network before transferring tokens and compare the displayed address and network details with their external wallet.

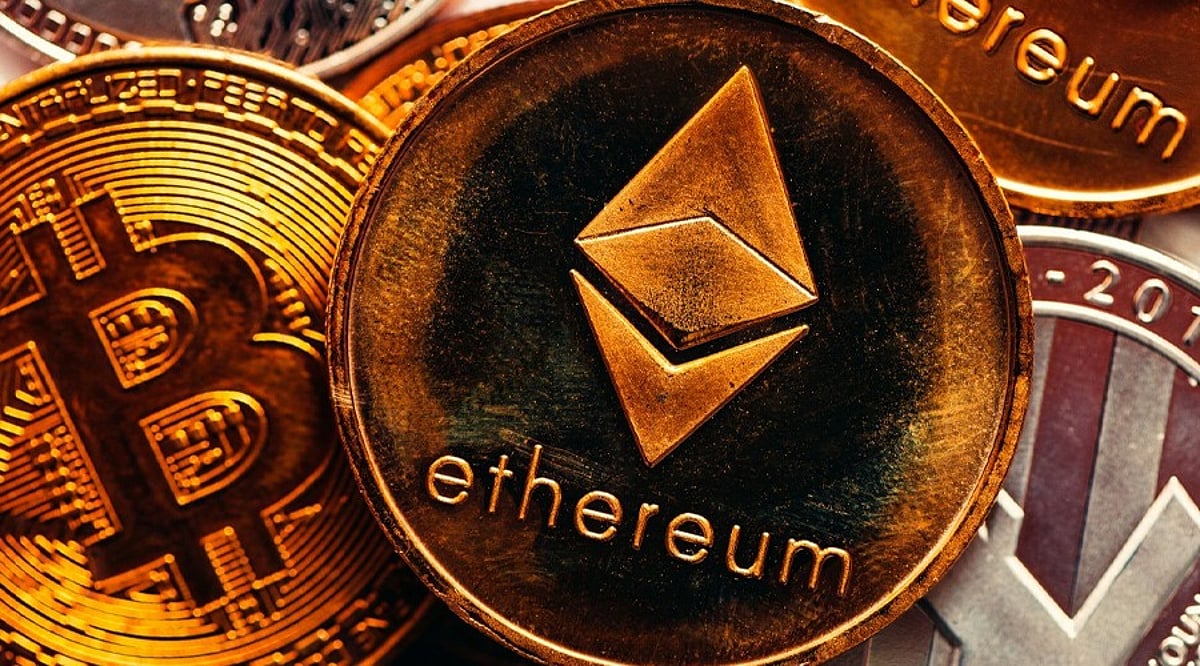
  • Ethereum Fees Plunge 51% as Transactions and Staking Reach All-Time Highs

    Ethereum Fees Plunge 51% as Transactions and Staking Reach All-Time Highs

    Ethereum’s quarterly fee revenue dropped 51% year-over-year to approximately $64 million in Q2 2026, even as transaction volumes and staking activity hit new records, according to a report from Bitwise. The decline stems from cheaper and more abundant blockspace rather than weakening demand.

    Revenue measured in ETH actually rose for the first time in over a year. Ethereum generated roughly $131 million in fee revenue during Q2 2025, but that figure fell to nearly $64 million one year later.

    Cheaper Blockspace Drives Higher Ethereum Usage

    Ethereum processed 203.9 million transactions during the quarter, up sharply from 121.1 million a year earlier. Network throughput also improved to 26 transactions per second from 15. The network increased its block gas limit to 60 million, creating more room for transactions and reducing user costs even as activity expanded.

    Bitwise described rising usage and falling fees as the quarter’s dominant trend. Researchers attributed the gap to protocol changes that expanded blockspace across blockchain networks. In ETH terms, quarterly revenue increased from 27,670 ETH in Q1 to 31,166 ETH in Q2, though the weaker token price reduced the dollar total.

    Active staking reached a record 40.2 million ETH, representing about 33% of the total supply. Institutional inflows continued as more tokens entered staking contracts. The question remains whether rising usage and record staking can offset weaker dollar revenue as Ethereum faces broader market pressure.

    The same pattern appeared on other networks. Solana processed 9.8 billion non-voting transactions near its record, while its dollar revenue declined. Avalanche handled 236 million C-Chain transactions, compared with 58 million a year earlier. Lower congestion reduced fees even as network use expanded.

    ETH Price Faces Oil, Rates, and Technology Pressure

    Ethereum traded near $1,927 on July 23 after reaching an intraday high of $1,941, according to crypto.news data. The token recovered more than 27% from its June low near $1,514. However, repeated failures near $1,955 kept ETH below the psychological $2,000 level.

    Oil prices added pressure as Middle East tensions pushed crude higher for a fifth session. West Texas Intermediate moved above $90 per barrel. Attacks by Iran-aligned Houthis on Saudi oil tankers raised supply concerns. Higher energy costs could lift inflation and narrow the Federal Reserve’s policy options.

    CME FedWatch data showed the probability of a September rate hike rising to 79% from 68%. Traders still expected no change at the July meeting. Technology shares also weakened after Alphabet lifted its 2026 capital-spending forecast to between $195 billion and $205 billion.

    Alphabet reported negative free cash flow of $5.9 billion as quarterly spending doubled to $44.9 billion. Its shares fell during premarket trading. Meanwhile, US spot Ethereum ETFs recorded $72.64 million in net inflows on July 22, according to SoSoValue.

    BlackRock’s iShares Ethereum Trust led with $53.47 million. The regulated products continued attracting capital while ETH remained below $2,000. BitMEX also announced plans to stop operations on September 23 following a strategic review by parent company HDR Global Trading.

    The exchange told customers to close positions and withdraw funds before the deadline. BitMEX has served more than two million professional and institutional traders since 2014. Position transfers could shift leverage to rival platforms. Binance, Bybit, OKX, and other exchanges still operate larger Ethereum derivatives markets.

    Ethereum fee revenue fell 51% even as transactions, throughput, and staking reached record levels. Cheaper blockspace reduced user costs, while ETF inflows supported demand. Still, oil prices, rate expectations, and weaker technology shares could continue influencing ETH’s attempt to reclaim $2,000.

  • Dogecoin Drops Below $0.070 as Bearish Momentum Intensifies

    Dogecoin Drops Below $0.070 as Bearish Momentum Intensifies

    Dogecoin fell below $0.070 on Friday, shedding 4.75% in 24 hours, as escalating geopolitical tensions, market deleveraging, and weakening sentiment weighed on speculative cryptocurrencies. The decline pushed DOGE to approximately $0.0690, placing the largest memecoin near support levels last seen in late 2024. Broader crypto weakness deepened the move, while traders monitored whether spot ETF inflows could spark a recovery.

    Market Fear Drives Selling Across Meme Coins

    The total cryptocurrency market capitalization dropped 0.96% to $2.22 trillion, as liquidations added pressure to the broader macro-driven sell-off. Bitcoin traded near the mid-$65,000 range, while Ethereum slipped toward $1,880 after giving back earlier weekly gains. XRP and Dogecoin also weakened as investors reduced exposure to higher-risk assets amid the escalating United States-Iran crisis. CoinMarketCap’s Fear and Greed Index fell to 37 on Friday from 40 earlier in the week, signaling a further shift toward fear.

    Dogecoin often reacts sharply to changes in retail interest and market risk appetite, leaving it vulnerable during periods of uncertainty. As speculative demand weakened, DOGE and other meme coins faced heavier selling pressure than several larger digital assets.

    Derivatives Data Shows Volatility and Bearish Demand

    Dogecoin futures open interest slipped to about $1.10 billion, according to CoinGlass, indicating a modest reduction in outstanding leveraged positions. At the same time, futures trading volume surged 76% to nearly $1.38 billion, as retail traders remained active despite falling prices. The combination of lower open interest and higher volume pointed to rising volatility rather than a clear return of bullish conviction.

    DOGE’s perpetual futures funding rate fell to approximately negative 0.0016%, meaning short sellers paid holders of long positions. Negative funding typically emerges when bearish expectations strengthen and demand for short exposure rises across the derivatives market.

    Technical Indicators Keep Sellers in Control

    Dogecoin remained below its 50-day exponential moving average at $0.0788 and its 200-day average at $0.1032. These levels kept the short-term and medium-term trend tilted toward sellers, while the $0.070 to $0.079 area formed the nearest resistance zone. Buyers would need to reclaim that zone before the market could show stronger signs of a possible trend reversal.

    The Relative Strength Index hovered near 31, reflecting persistent selling pressure while placing DOGE close to oversold territory. Meanwhile, the Moving Average Convergence Divergence tested its signal line, leaving room for bearish momentum to build if sellers retained control. The next major support stands at $0.0641, and a daily close below it could trigger another selling wave in the coming sessions.

    Conclusion

    Dogecoin remains under pressure below $0.070 as geopolitical tension, weak market sentiment, negative funding, and bearish technical signals favor sellers. The $0.0641 support level now represents the key downside test, while buyers must reclaim the $0.070–$0.079 zone before a stronger recovery can develop.

  • Bitcoin Holds Near $65,200 as Record ETF Inflows Offset Geopolitical Uncertainty

    Bitcoin Holds Near $65,200 as Record ETF Inflows Offset Geopolitical Uncertainty

    Bitcoin traded near $65,218 on Friday, supported by seven consecutive sessions of spot ETF inflows totaling nearly $1 billion, even as escalating US-Iran tensions and rising oil prices kept overall market sentiment fragile. The leading cryptocurrency showed resilience ahead of the Federal Reserve meeting on July 28-29, with resistance at $66,000 and key support at $64,350.

    Market Overview

    Bitcoin held near $65,218.75, up 0.51% over the past 24 hours, according to CoinMarketCap data. The price action remains anchored to oil movements, ETF flows, and shifting Fed rate expectations. Altcoins outperformed, with Ethereum gaining 2.27%, Solana 2.39%, and Dogecoin jumping 4.78%.

    Analyst Perspectives

    Middle East Escalation Tests Risk Appetite

    Akshat Siddhant, Lead Quant Analyst at Mudrex, noted Bitcoin slipped to around $64,800 as fresh attacks in the Middle East dampened investor confidence. Crude oil pushed past $90 a barrel, driving US bond yields to 18-month highs. Despite this, spot Bitcoin ETFs extended their inflow streak to seven sessions, drawing nearly $1 billion. Resistance sits at $66,000, with $64,350 acting as the key support zone.

    Fed Meeting Looms as Next Catalyst

    Vikram Subburaj, CEO of Giottus, placed Bitcoin near $65,100, down about 1% as oil above $100 and firmer Treasury yields weighed on sentiment. He called the July 28-29 Fed meeting the most important near-term catalyst. Spot ETFs attracted close to $999 million across seven straight sessions through July 22, though preliminary data hinted at a pause on July 23.

    Support Holds Despite Selling Pressure

    The CoinSwitch Markets Desk noted Bitcoin briefly dipped below $65,000 before recovering. Brent crude climbed past $100, while bond yields hit 18-month highs. Higher energy costs revived inflation worries. The 21-day moving average near $64,000 is key support, with $68,000 marking the next resistance band.

    Regulatory Signals Add a Silver Lining

    Nischal Shetty, Founder of WazirX, flagged Argentina’s proposal allowing mutual funds to invest directly in Bitcoin as a meaningful adoption signal. Bitcoin’s near-term support lies between $64,200 and $64,500, with traders watching whether it can reclaim $66,000.

    Bitcoin’s Structure Stays Comparatively Resilient

    Riya Sehgal, Research Analyst at Delta Exchange, said gold and silver fell despite geopolitical tensions, as rising Treasury yields and a stronger dollar outweighed safe-haven demand. Bitcoin held up better than Ethereum and most altcoins. A move past $66,100 could open the $66,600 to $66,900 zone, while a break under $65,000 risks a drop toward $64,200.

    Top 10 Coins at a Glance

    Biggest Gainers: DOGE (+4.78%), ETH (+2.27%), SOL (+2.39%).

    Relative Laggards: USDT, USDC, TRX (minimal movement).

    Key News Driving Market Sentiment

    US-Iran Tensions Keep Oil and Yields Elevated

    Fresh hostilities pushed oil above $90 a barrel, reviving inflation concerns just as the Fed prepared for its meeting. Traders trimmed exposure to riskier assets.

    CLARITY Act Text Sparks Fresh Senate Debate

    The full text of the CLARITY Act became public on July 22, reigniting disagreement over enforcement roles. Passage odds are roughly 43% in prediction markets.

    Bitcoin ETF Inflow Streak Faces a Test

    Preliminary data hinted at a possible outflow midweek, suggesting institutional appetite may be cooling. Analysts are watching whether the trend resumes.

    XRP Whales Accumulate as ETF Pace Slows

    Large XRP holders increased positions this week. The token holds above $1.10, supported by its EU MiCA license and cumulative ETF inflows near $1.48 billion.

    Coinbase Expands Payments for AI Agents

    Coinbase introduced a feature allowing corporate customers to accept payments directly from AI agents via the x402 protocol, signaling growing overlap between AI and blockchain.

    BNY Mellon Advances Tokenized Treasury Plans

    BNY Mellon confirmed plans to launch tokenized US Treasuries by late 2026, targeting round-the-clock settlement by 2027.

    Investor and Market Outlook

    Bitcoin holds near $65,200 as ETF demand offsets Middle East pressure. A close above $66,000 could open a path toward $69,000. A slip below $64,350 risks exposing support near $64,000. Ethereum trades near $1,874, testing resistance at $1,950. Oil prices, Treasury yields, and the Fed decision remain the key macro variables.

  • Bitcoin Under Pressure: Rising Oil Prices, High Interest Rates, and Regulatory Uncertainty Weigh on Market

    Bitcoin Under Pressure: Rising Oil Prices, High Interest Rates, and Regulatory Uncertainty Weigh on Market

    Bitcoin is facing a challenging period as rising oil prices fuel inflation concerns, elevated interest rates reduce risk appetite, and ongoing regulatory uncertainty keeps investors cautious. Despite these headwinds, institutional support through spot Bitcoin ETFs continues to provide a long-term foundation for the cryptocurrency.

    Key Takeaways

    • Rising oil prices have renewed inflation fears, increasing pressure on Bitcoin.
    • High interest rates are shifting investor capital toward safer assets.
    • Institutional demand via spot Bitcoin ETFs remains a positive factor for long-term confidence.

    Higher Oil Prices Stoke Inflation Worries

    Bitcoin’s recent weakness is largely tied to the surge in oil prices. Brent crude has climbed back to $100 per barrel amid escalating tensions in the Middle East. Higher oil costs ripple through the economy, raising transportation, manufacturing, and service expenses — costs that are ultimately passed on to consumers. This inflationary environment makes central banks hesitant to cut interest rates, which in turn dampens appetite for riskier assets like Bitcoin.

    Interest Rates Dampen Demand for Cryptocurrencies

    Central banks worldwide have kept borrowing costs high to combat inflation, making government bonds and money market funds more attractive due to their reliable, low-risk returns. Consequently, capital that might have flowed into cryptocurrencies has moved into traditional financial products. Investors are closely monitoring central bank meetings, with many expecting rates to remain elevated if inflation stays above target — especially with oil prices continuing to rise.

    Regulatory Uncertainty Lingers

    Governments around the globe are still crafting new rules for cryptocurrencies, covering taxation, stablecoins, exchange operations, anti-money laundering, and investor protection. While many investors welcome clear regulations — which could boost confidence and attract institutional money — the current uncertainty creates caution. Any major policy announcement can quickly move Bitcoin prices as traders react to the latest developments.

    Market Sentiment Remains Cautious

    Bitcoin has held relatively steady near $66,000, but volatility persists. Trading volumes are lower than in previous bull markets, indicating a wait-and-see stance among many investors. They are unlikely to re-enter the market until inflation slows, interest rates fall, or economic conditions improve. Analysts note that Bitcoin is now more sensitive to macroeconomic data — such as inflation, unemployment, and central bank decisions — than in earlier years.

    Institutional Investors Provide a Buffer

    Despite short-term pressures, institutional demand remains a strong pillar. U.S. spot Bitcoin ETFs have recently reported fresh inflows after periods of withdrawals. These regulated products make it easier for pension funds, wealth managers, and large financial institutions to gain exposure to Bitcoin without directly holding the asset. This steady institutional participation helps support Bitcoin even during uncertain times.

    What’s Next for Bitcoin?

    The coming months will be crucial. Investors will watch central bank decisions, inflation reports, oil market developments, and regulatory updates closely. Continued inflows into spot Bitcoin ETFs could provide additional support. The balance between these positive and negative factors will likely determine Bitcoin’s next major price move.

    Why This Matters

    Bitcoin has become a significant part of the global financial system, so changes in oil prices, interest rates, and government policies now affect millions of investors. Understanding these risks helps investors interpret Bitcoin’s performance and prepare for future market shifts.

    Outlook

    Several factors are currently working against Bitcoin: oil prices above $100, high interest rates limiting risk appetite, and regulatory hurdles. However, institutional adoption via spot Bitcoin ETFs has helped cushion losses from previous shocks. The near-term direction depends on inflation trends, interest rate decisions, oil prices, and regulatory signals.

    Frequently Asked Questions

    1. Why do higher oil prices affect Bitcoin? Higher oil prices can increase inflation, making investors less willing to buy riskier assets like Bitcoin.
    2. How do interest rates impact Bitcoin prices? Higher interest rates make safer investments more attractive, reducing demand for cryptocurrencies.
    3. Is Bitcoin still attracting institutional investors? Yes. Spot Bitcoin ETFs continue to draw institutional investment despite short-term volatility.
    4. Why does regulation matter for Bitcoin? New regulations can affect how cryptocurrencies are traded, taxed, and adopted by financial institutions.
    5. What could help Bitcoin recover? Lower inflation, interest rate cuts, stable oil prices, and greater regulatory clarity could improve market confidence and support Bitcoin prices.
  • Bitcoin Holds Above $65,400 as Bulls Set Sights on $66,000 Resistance

    Bitcoin Holds Above $65,400 as Bulls Set Sights on $66,000 Resistance

    Bitcoin is trading near the $65,300–$65,400 range after a volatile session, maintaining its position above the critical $65,000 support level. The cryptocurrency’s market cap stands above $1.3 trillion, with daily trading volume exceeding $23 billion, indicating sustained investor interest despite recent price fluctuations.

    Chart Analysis

    The 5-minute BTC/USD Bitstamp chart reveals a sharp decline toward the $64,600–$64,700 area before buyers intervened. Strong demand at that level halted the downturn and propelled prices higher. Following this bounce, Bitcoin formed a series of higher lows, signaling that buyers are gradually gaining control.

    The Bollinger Bands support this bullish view. The price is trading near the upper band, while the middle band is trending upward, reflecting short-term strength. However, the distance between the price and the upper band suggests a potential minor pullback before the next upward move.

    Key Price Levels

    Bitcoin faces initial resistance near $65,500, with the next major hurdle between $65,800 and $66,000. A decisive break above this zone could pave the way toward $66,200–$66,500, where another significant test awaits.

    On the downside, the first support is near $65,200, followed by $64,900. The strongest support remains in the $64,600–$64,700 range, where buyers have previously demonstrated solid demand.

    Market Trend

    The latest price action indicates that Bitcoin has begun a recovery after a weak phase earlier this week. Buyers have consistently stepped in near major support levels, pointing to steady demand amid market uncertainty. However, the market has yet to clear all resistance levels. A strong move above $66,000 is needed to confirm a more robust recovery; until then, prices may continue to oscillate within a wide range.

    Latest Bitcoin News

    Fresh market data has boosted confidence across the crypto sector. Spot Bitcoin ETFs have recorded several consecutive sessions of net inflows, signaling that institutional investors are increasing exposure after weeks of weaker demand. Technical analysts also note that Bitcoin has successfully defended the $65,000 level, with momentum indicators showing reduced selling pressure. Many experts believe a clear move above $67,000 could trigger a much larger rally.

    The broader financial market has also been supportive. Strong risk appetite has benefited cryptocurrencies, with Bitcoin outperforming several traditional equity sectors during July.

    Investor Sentiment

    Long-term holders continue to retain the bulk of their Bitcoin rather than taking profits during short-term price increases. Exchange balances remain stable, minimizing immediate selling pressure. Overall investor confidence is high compared to previous weeks, though traders remain cautious about interest rate forecasts, economic data, and geopolitical developments, which could quickly shift market sentiment.

    Why This Matters

    Bitcoin is often viewed as a trendsetter for the broader cryptocurrency market. A rise above key resistance levels could create a positive ripple effect, supporting gains in other cryptocurrencies, while a decline might trigger a broad selloff. Strong institutional demand, consistent trading volumes, and significant support around $65,000 make the current price action critical for traders and investors.

    Outlook

    Bitcoin is establishing a firmer foothold above $65,000 after buyers defended support. Recent uptrends, high volume, and ETF inflows have bolstered market sentiment in the short term. The immediate resistance zone between $65,800 and $66,000 is the next key test. A successful breakout could push prices toward $66,500 and then $67,000. Conversely, a drop below $65,200 could lead to a retest of $64,900 and potentially $64,600. While buyers remain in control, Bitcoin has yet to achieve a major breakout above critical resistance to confirm a sustained uptrend.

    Frequently Asked Questions

    1. What is Bitcoin trading at now?

    Bitcoin is trading between $65,300 and $65,400, holding firmly above key support after a volatile session.

    2. Why is $65,000 important for Bitcoin?

    It serves as a crucial psychological and technical support zone where buyers consistently step in to absorb selling pressure.

    3. What is the next resistance level for Bitcoin?

    The immediate resistance zone lies between $65,800 and $66,000, with a major technical test near $66,500.

    4. How do Bitcoin ETF inflows affect the price?

    Consistent spot ETF inflows highlight sustained institutional demand, absorb exchange supply, and support positive market sentiment.

    5. What could happen if Bitcoin falls below $65,200?

    A drop below $65,200 could trigger short-term selling, opening the path for a retest of lower support levels at $64,900 and $64,600.

    Disclaimer: This article is for informational purposes only and does not constitute financial advice. Cryptocurrency investments carry risk. Always conduct your own research before investing.

  • XRP Whale Wallets Hit Record High While Retail Investors Cash Out

    XRP Whale Wallets Hit Record High While Retail Investors Cash Out

    XRP has entered a new phase where large investors and small traders have chosen completely different paths. Blockchain data shows that whale wallets have continued to buy more XRP, while many retail investors have sold part of their holdings. This gap between big and small investors has become one of the biggest talking points in the crypto market.

    Large holders often focus on long-term value instead of daily price swings. Retail traders usually react faster to market drops and uncertainty. Current on-chain data reflects exactly that pattern.

    XRP Price Holds Above $1

    XRP trades at approximately $1.11 on the market as of July 24, 2026, with a market cap that exceeds $69 billion. The total volume of the asset in one day remains at around $1.04 billion. In total, there are around 62.47 billion XRP tokens in circulation.

    While XRP seems to be doing relatively stable with a price above $1, positive investor sentiment has not resulted in further price gains. The cryptocurrency has proven to be unpredictable for many traders as it constantly pushes against a resistance zone around $1.14-$1.15.

    Whale Wallets Reach Record Numbers

    The biggest story comes from blockchain data. Wallets that hold at least 10,000 XRP have climbed to a record 332,230 addresses. This number shows that large investors have continued to collect XRP even during weak price action.

    This trend has continued for several months. Instead of waiting for higher prices, whales have added more coins whenever the market slowed down. Such buying behavior often shows confidence in future growth rather than interest in quick profits.

    Many market experts believe whales usually study market cycles before they make large purchases. Their steady buying suggests that these investors still see value in XRP despite recent price struggles.

    Retail Investors Continue to Sell

    Several reasons explain this move. The price has stayed within a narrow range for weeks. Many traders expected a stronger rally but did not get one. As a result, some chose to lock in profits, while others sold since they feared another decline.

    This selling does not always mean investors have lost faith in XRP forever. Many retail traders simply prefer to wait until the market shows stronger momentum before they enter again.

    Blockchain Data Supports the Trend

    The number of whale wallets has reached an all-time high. Net position data also shows that these large holders have continued to increase their balances. At the same time, exchange selling from major wallets has remained lower than previous periods.

    These figures suggest that large investors have not rushed to sell despite market uncertainty. Instead, many have treated recent price weakness as an opportunity to build bigger positions.

    Such behavior often attracts attention since whales usually control enough capital to influence market trends over time.

    Price Faces Strong Resistance

    The price has struggled to move above the $1.14 to $1.15 resistance zone. Every rejection has encouraged short-term traders to leave the market, which has slowed fresh buying.

    This price action has created a balance between buyers and sellers. Bulls have protected the $1 level, while sellers have defended higher prices. Until one side gains control, XRP may continue to trade within this range.

    Many Holders Still Remain in Loss

    Recent data reveals that only 43.4% of XRP’s circulating supply remains in profit. This marks the lowest level in almost two years.

    This means that more than half of XRP holders currently own coins that sit below their purchase price. Such conditions often create emotional pressure since many investors worry about deeper losses.

    However, crypto markets have shown similar situations before. Long periods where most holders remain in loss have sometimes appeared before major recoveries. Although history does not guarantee future results, many experienced investors continue to watch this indicator closely.

    Ripple Continues to Build the XRP Ecosystem

    New grant programs now help startups and blockchain developers build applications on the XRP Ledger. These initiatives support innovation and encourage more businesses to create products that use the network.

    Ripple has also continued work on payment solutions, digital asset services, and enterprise technology. These developments strengthen the long-term use case for XRP beyond short-term price movements.

    Futures Market Shows Rising Interest

    Recent updates indicate that the open interest of XRP futures has reached higher numbers. The implication here is that traders have been active in opening positions in the futures market.

    In reality, greater open interest relates to active trading. It can also lead to significant price movements since openings of long and short positions generate volatility when prices breach the resistance or support.

    Why This Matters

    Whale activity often provides an early signal of market direction as large investors usually make decisions after careful research. At the same time, retail selling reflects broader market sentiment. When both groups move in opposite directions, the trend can reveal valuable insights about confidence, future demand, and the possible direction of XRP’s price.

    Outlook

    The token still trades below the key $1.14 to $1.15 resistance level, but large investors have not slowed their accumulation. Record whale wallet numbers, steady on-chain data, and continued ecosystem growth show that many major holders still believe in XRP’s long-term potential.

    The next major price move will likely depend on overall crypto market sentiment, stronger buying demand, continued Ripple development, and a successful break above important resistance. Until that happens, whale accumulation and retail selling will remain the biggest themes in the XRP market.

    FAQs

    1. Why are XRP whales buying more tokens? Large investors accumulate XRP during price dips, demonstrating strong long-term confidence despite temporary market stagnation.
    2. Why are retail investors selling XRP? Retail traders reduce exposure or take short-term profits after XRP repeatedly failed to break past key resistance zones.
    3. What is XRP’s current price? XRP trades around $1.11, maintaining a market capitalization exceeding $69 billion with steady daily volume.
    4. What does record whale wallet growth mean? Wallets holding over 10,000 tokens reached historic highs, signaling sustained accumulation by high-net-worth investors.
    5. What could influence XRP’s next price move? Key catalysts include broader market sentiment, ecosystem expansion, institutional adoption, and breaking resistance between $1.14-$1.15.
  • Bitcoin Surges Past $66K: Can the Rally Overcome Seasonal Headwinds?

    Bitcoin Surges Past $66K: Can the Rally Overcome Seasonal Headwinds?

    Bitcoin has reclaimed the $66,000 level, fueled by strong institutional demand and healthy market activity. However, seasonal slowdown risks and key resistance levels could determine whether the rally continues.

    Key Takeaways

    • Bitcoin has recovered above $66,000 with support from strong institutional demand.
    • The $68,500 to $70,000 range remains the next major hurdle for buyers.
    • Seasonal market weakness could slow momentum despite positive long-term signals.

    Bitcoin has crossed the $66,000 mark once again after a brief period of weak price action. This move has brought fresh confidence to the crypto market, as many traders view this level as an important psychological and technical point.

    At the time of writing, Bitcoin trades between $65,600 and $66,000. The digital currency now holds a market value of more than $1.31 trillion, while its circulating supply stands near 20.06 million BTC. Daily trading volume remains between $27 billion and $30 billion, indicating active participation from both buyers and sellers.

    Strong Demand Supports the Recovery

    Bitcoin has surpassed $66,000 for multiple reasons. One of the main drivers is continued strong institutional demand. This constant interest from the financial industry has helped stabilize the market despite various price fluctuations.

    Bitcoin remains the world’s largest cryptocurrency, representing over 55% of the entire crypto market. This dominance shows that investors continue to place more confidence in Bitcoin than in smaller altcoins, especially during uncertain times.

    Technical Charts Show Improved Strength

    The latest price move has improved Bitcoin’s technical picture. After the recovery, the price now sits above several short-term moving averages that traders use to gauge market trends. This shift has encouraged many investors who were waiting for confirmation before entering the market.

    The next important resistance lies between $67,500 and $68,500. If Bitcoin moves above this range, many traders may shift their focus to $70,000, a major psychological price level. On the downside, Bitcoin has support between $64,000 and $65,000. If the price falls below that area, the next major support appears near $62,000.

    Blockchain Data Paints a Positive Picture

    On-chain data confirms a long-term bullish outlook. Many holders are choosing to keep their Bitcoin rather than sell after the recent recovery. This tendency reduces the supply of coins available on exchanges, lowering the risk of a sharp price decline.

    Quantities of Bitcoin stored on exchanges remain lower than in previous market cycles, indicating fewer sellers. Additionally, the Bitcoin network continues to show stability as miners remain active.

    Seasonal Slowdown May Slow the Rally

    Despite the positive signs, history shows that Bitcoin often moves more slowly during this part of the year. Trading activity typically falls during the middle months as many large investors reduce market participation. Lower activity can lead to smaller price moves and higher day-to-day volatility.

    This seasonal trend does not always lead to a price drop, but it can delay the next major rally. Many analysts believe Bitcoin could trade between $64,000 and $68,000 until a strong new catalyst emerges. Fresh investment, positive economic news, or supportive crypto regulations could provide the necessary push.

    Global Economic Factors Still Matter

    Bitcoin no longer moves solely on crypto-specific news. The global economy now plays a major role in its price. Investors continue to watch inflation reports, central bank decisions, employment numbers, and interest rate expectations. These events affect confidence across all financial markets.

    If inflation continues to cool and central banks begin to lower interest rates, investors may allocate more capital to assets like Bitcoin. However, strong economic data could delay rate cuts, strengthening the US dollar and creating short-term pressure on cryptocurrencies.

    Market Confidence Continues to Improve

    Investor confidence has improved after Bitcoin climbed back above $66,000. Many traders now believe buyers have defended an important support zone. This view has encouraged more participants to return after waiting through the recent pullback.

    The futures market also looks healthier than before, with traders not building excessive leverage. This balance reduces the risk of sudden liquidations that often cause sharp price drops. Even with better sentiment, experienced investors continue to manage risk carefully, as Bitcoin can still move sharply within a single day.

    Why This Matters

    Bitcoin is widely regarded as the bellwether of the cryptocurrency market. When BTC breaks through a significant barrier like $66,000, it boosts investor perception of digital assets. However, seasonal influences can make market sentiment fickle, making this period crucial for traders, investors, and the broader crypto ecosystem.

    Outlook

    Bitcoin has gained traction after returning to the $66,000 level. With a market capitalization over $1.31 trillion, daily trading volume between $27 billion and $30 billion, and strong backing from long-term holders, the market shows resilience despite high volatility.

    In the coming weeks, Bitcoin’s price direction will become clearer. Breaking above the $68,500 resistance could pave the way toward $70,000. Conversely, losing current support may lead to a consolidation phase.

    FAQs

    1. Why did Bitcoin move above $66,000? Strong institutional demand, steady market confidence, and positive technical signals helped Bitcoin recover above this key level.
    2. What is the next major resistance for Bitcoin? Analysts view the $68,500 to $70,000 range as the next important resistance area.
    3. Why do experts mention a seasonal slowdown? Bitcoin often sees lower trading activity during certain months, which can reduce momentum and delay major price moves.
    4. Does institutional interest still support Bitcoin? Yes. Large investors continue to hold Bitcoin, which has helped maintain market stability during recent volatility.
    5. Can Bitcoin reach new highs this year? If Bitcoin breaks above major resistance with strong buying volume and favorable economic conditions, many analysts believe further gains remain possible.
  • Ethereum Breaks Above $1,900: Is a Rally to $2,100 Next?

    Ethereum Breaks Above $1,900: Is a Rally to $2,100 Next?

    Ethereum has reclaimed the $1,900 mark, fueled by strong institutional demand, robust ETF inflows, and improving market sentiment. After hovering below $1,800 for weeks, the second-largest cryptocurrency by market cap surged past $1,900 and is now trading around $1,925–$1,930. With a market capitalization exceeding $232 billion and daily trading volume near $10 billion, analysts are watching whether ETH can break through $2,000 and target $2,100.

    Institutional Demand Keeps Ethereum on Track

    One of the biggest drivers behind Ethereum’s recent rise is sustained interest from institutional investors. Large financial firms continue to increase exposure through spot Ethereum exchange-traded funds (ETFs), which have helped improve market confidence. Recent data shows U.S. spot Ethereum ETFs attracted approximately $72.7 million in net inflows, marking another day of positive investment. This institutional buying reduces the available supply of ETH, supporting higher prices.

    Ethereum Continues to Lead the Smart Contract Market

    Ethereum remains the most valued smart contract blockchain, powering countless decentralized platforms, applications, and token projects daily. Its dominance in the smart contract space gives it a competitive edge over rival cryptocurrencies. Additionally, Ethereum’s staking mechanism allows investors to earn rewards by locking their coins, while its burn mechanism removes a portion of transaction fees from circulation, reducing selling pressure and supply over the long term.

    Positive Market Sentiment Supports the Rally

    The broader cryptocurrency market has seen positive momentum, with Bitcoin trading steadily and boosting investor confidence. This has encouraged buyers to invest freely in altcoins like Ethereum. Traders have become more active, bringing fresh purchases into the market. Based on current feedback, Ethereum could continue its recovery unless market conditions change dramatically.

    Technical Picture Shows More Upside

    Ethereum has moved above the important resistance level at $1,900, which now acts as first support. Many analysts believe this level could help protect the rally if buyers continue to defend it. The next challenge sits near $1,950, followed by the psychological barrier at $2,000. If Ethereum breaks above these levels, the price could move toward $2,100. On the downside, support remains at $1,850, with $1,800 as the next major level if sellers regain control.

    On-Chain Activity Reflects Healthy Demand

    Blockchain data supports the recovery. Large investors, often called whales, have increased their activity during the latest rally. Network activity has remained stable, and transaction volumes show healthy participation. This suggests that Ethereum’s recovery comes from genuine market demand rather than short-term speculation.

    Risks Still Deserve Attention

    Despite the positive outlook, investors should remain cautious. The cryptocurrency market still reacts to interest rate decisions, economic uncertainty, and regulatory developments. Any unexpected event could slow the rally. Additionally, security incidents across the crypto ecosystem—such as recent attacks on Bitcoin- and Ethereum-related protocols causing losses of around $35 million—remind investors that risks persist.

    Why This Matters

    Moving past $1,900, Ethereum reflects surging institutional confidence and growing on-chain adoption. Given its foundational role across decentralized finance, ETH’s rally serves as a key sentiment driver for all digital assets.

    Can Ethereum Reach $2,100?

    After rising back above $1,900, Ethereum has gained considerable momentum. Institutional demand remains strong, the platform continues to dominate the smart contract segment, and market sentiment has improved. As long as bulls remain in charge and ETF interest stays strong, Ethereum will likely attempt to breach $2,000 soon. A successful move above that level could open the path toward $2,100. While short-term volatility is possible, the conditions for a continued recovery remain favorable.

    Frequently Asked Questions

    1. Why has Ethereum moved above $1,900? Ethereum has gained support from strong institutional demand, positive ETF inflows, and improved sentiment across the cryptocurrency market.
    2. What is the next price target for Ethereum? Analysts believe $2,000 is the next key resistance, while $2,100 remains the next major upside target if buyers stay in control.
    3. How much money entered Ethereum ETFs recently? Recent data shows U.S. spot Ethereum ETFs recorded approximately $72.7 million in net inflows.
    4. What support level should investors watch? The first major support sits at $1,900, followed by $1,850 if the market faces short-term pressure.
    5. What risks could affect Ethereum’s rally? Economic uncertainty, regulatory decisions, and security incidents across the crypto industry could slow Ethereum’s upward momentum.

    Disclaimer: This article is for informational purposes only and does not constitute investment advice. Cryptocurrency investments carry risk. Always do your own research before investing.