Category: Cryptocurrency

  • XRP Holds Above $1 as ETF Inflows Increase and XRPL Lending Protocol Enters Testing

    XRP Holds Above $1 as ETF Inflows Increase and XRPL Lending Protocol Enters Testing

    XRP maintained its crucial $1 support level as leverage declined, network activity expanded, ETF demand continued, and Ripple opened its proposed XRPL Lending Protocol for developer testing. The token gained 1.59% during the session, although resistance near $1.10 prevented a confirmed technical recovery.

    XRP Defends $1 After Major Leverage Reset

    XRP rose from $1.0451 to $1.0544 within a 24-hour range of $0.0435. The token later consolidated between $1.03 and $1.06, leaving the market range-bound rather than signaling a broader recovery. It remains 19% lower for the month. Trading activity peaked on June 29 at 17:00 UTC, with volume reaching 86.5 million XRP—about 67% above the session’s average volume. Open interest across major exchanges dropped below 150 million after reaching 1.3 billion previously, removing much of the crowded leverage behind XRP’s earlier rally. Funding rates turned negative, and forced long liquidations cleared additional bullish positioning. The four-hour relative strength index recovered from oversold conditions to 46. XRP still trades below major moving averages, with resistance near $1.10, followed by the 50-day EMA around $1.20 and the 100-day EMA near $1.31.

    Network Growth and XRP ETF Inflows Continue

    Daily active addresses climbed from 23,000 on June 14 to nearly 39,500 by June 27—a 72% surge in two weeks. At the same time, XRP spot ETFs recorded an eighth consecutive week of inflows, bringing cumulative inflows to $144.7 million despite broader weakness across cryptocurrency investment funds. On June 26, XRP ETFs attracted $15.6 million in net inflows, while Bitcoin ETFs saw $444.5 million in outflows and ether funds lost $12.9 million. The strength in network use and sustained ETF inflows could push XRP through the $1.10 resistance zone, but price action has not yet confirmed that shift. Initial resistance sits at $1.06, followed by $1.09–$1.10. A move above $1.20 would provide a stronger recovery signal; a break below $1 could bring the $0.90–$0.87 region back into focus.

    Ripple Opens XRPL Lending Protocol Testing

    Ripple announced that developers can now test the proposed XRPL Lending Protocol in a dedicated environment. The system would introduce native borrowing and lending functions to the XRP Ledger via two technical specifications—XLS-65 and XLS-66. These would help financial firms structure credit agreements directly on the network. The Single Asset Vault creates a standard format for pooling assets, while the Lending Protocol manages loan terms, servicing, and repayment rules. If network validators approve both specifications, institutions could use tokenized real-world assets like money market funds and commodities as working capital for lending. Developers can experiment with the framework while XRP continues trading between key support and resistance levels.

    What’s Next for XRP?

    XRP continues to defend the $1 support level with declining leverage, strengthening network activity, and positive ETF inflows. The XRPL lending development adds another institutional use case. Traders should watch whether XRP can break above $1.10 and advance toward $1.20 in the coming sessions.
  • Galaxy Research Lowers CLARITY Act Passage Odds to 50% Amid Senate Calendar Constraints

    Galaxy Research Lowers CLARITY Act Passage Odds to 50% Amid Senate Calendar Constraints

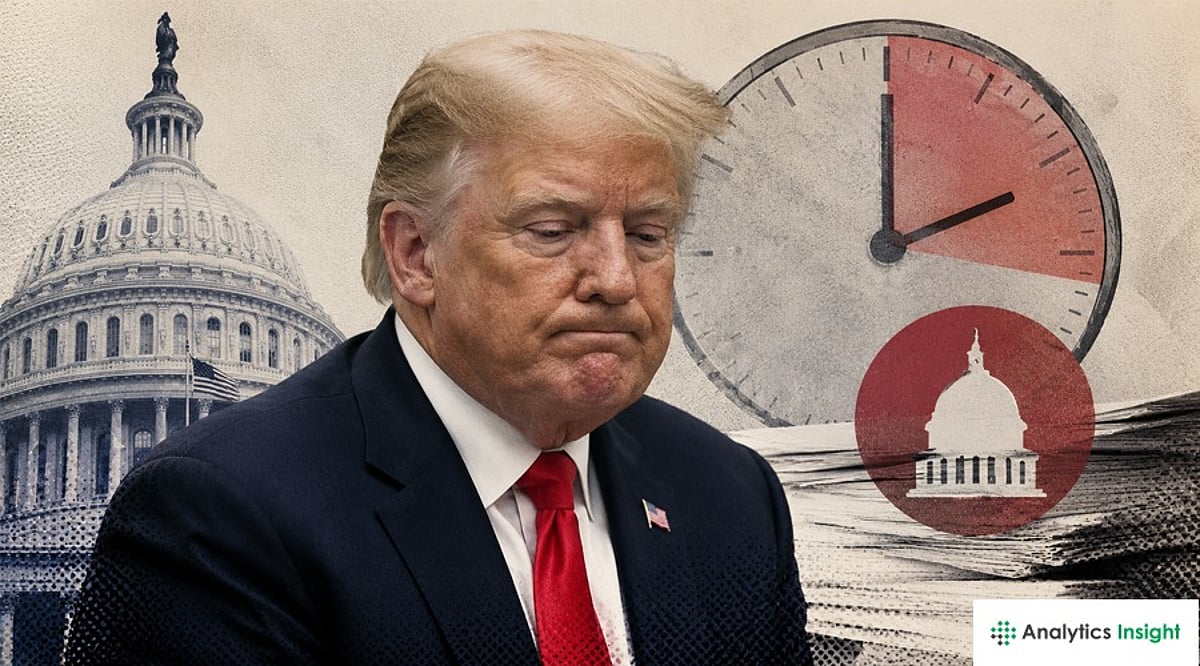
    Galaxy Research has reduced its estimate for the CLARITY Act becoming law in 2026, citing growing pressure on the US Senate calendar. The research firm lowered its forecast from 60% to 50%, emphasizing that the main challenge is timing rather than support for the legislation.

    Alex Thorn, Galaxy’s head of firmwide research, explained that lawmakers face a limited window to advance the crypto market structure bill before Congress enters its August recess. He noted that several legislative priorities continue to compete for Senate floor time.

    Scheduling Delays and Limited Senate Floor Time

    Galaxy Research said the latest revision reflects delays in the legislative process instead of concerns about the contents of the CLARITY Act. Thorn wrote that “as the Senate calendar tightens and a lack of progress in negotiations makes passage less likely than several weeks ago.”

    According to Thorn, the bill still lacks a unified Banking-Agriculture Committee text. In addition, Senate leaders have not announced a floor date or scheduled a motion to proceed. These missing steps have reduced confidence that lawmakers can complete the process within the available time.

    Galaxy previously reduced its estimate from 75% to 60% earlier in June. The latest adjustment brings the projected odds to an even 50-50 as lawmakers continue negotiations on unresolved sections of the proposal.

    Thorn stressed that the downgrade relates to legislative timing rather than the bill itself. The research team continues to view the legislation as capable of advancing if Congress schedules enough debate before the summer break.

    Other Legislative Priorities Increase Pressure on the CLARITY Act

    The Senate calendar has become more crowded after President Donald Trump stated that he would not sign a bipartisan housing bill unless Congress also passed the SAVE Act. Thorn said the dispute has reduced available floor time for other measures, including the CLARITY Act.

    He also noted that lawmakers must address other major items, including Section 702 of the Foreign Intelligence Surveillance Act and the National Defense Authorization Act for fiscal year 2027. These measures require Senate attention before the August recess.

    Thorn wrote, “For a 60-vote bill that still needs a merged Banking-Agriculture text, a motion to proceed, floor debate, an amendment process, and then House action on whatever the Senate produces, the runway is quickly declining into just a matter of weeks.”

    He added that Senate Majority Leader John Thune should announce floor time by early July. Without a scheduling decision, Thorn said the bill could move into September, when midterm political considerations may make difficult votes harder to schedule.

    Crypto Industry Continues to Watch the Bill’s Progress

    The CLARITY Act aims to establish a federal regulatory framework for digital assets in the United States. The proposal would divide oversight between the Securities and Exchange Commission and the Commodity Futures Trading Commission, while assigning primary authority over most crypto assets to the CFTC.

    The legislation has remained a major topic of discussion among lawmakers, digital asset companies, financial institutions and advocacy groups. While more than 200 crypto organizations have urged Congress to approve the bill, other groups have raised concerns about regulatory oversight and financial safeguards.

    The bill is scheduled for a House hearing on July 17 as lawmakers continue discussions. Industry participants are monitoring the Senate calendar closely because the remaining legislative timetable may determine whether the proposal advances this year.

    Despite lowering the probability estimate, Galaxy Research maintained that the legislation still has a realistic path forward. Thorn wrote, “We still think enactment this year has a strong chance — for a bill of this magnitude and complexity, 50-50 are pretty good odds.” The coming weeks are expected to determine whether Senate leaders allocate enough time to move the bill through the remaining legislative stages.

  • Bitcoin Tests Key Support as Early Bottom Signals Emerge: What Traders Should Watch

    Bitcoin Tests Key Support as Early Bottom Signals Emerge: What Traders Should Watch

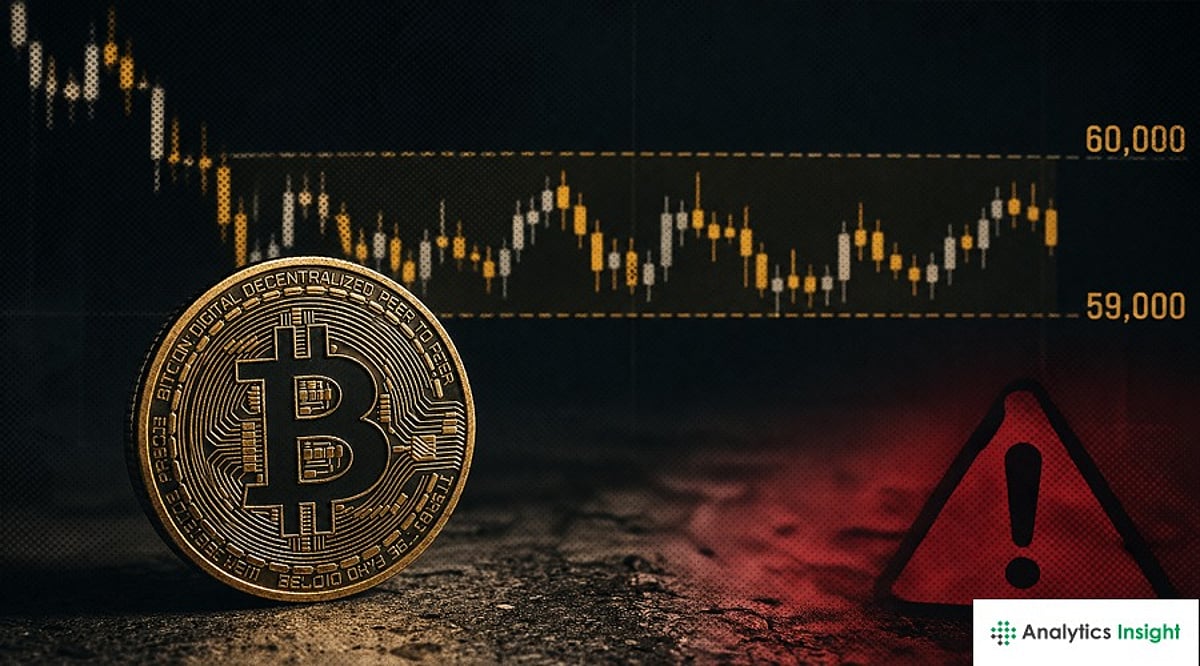
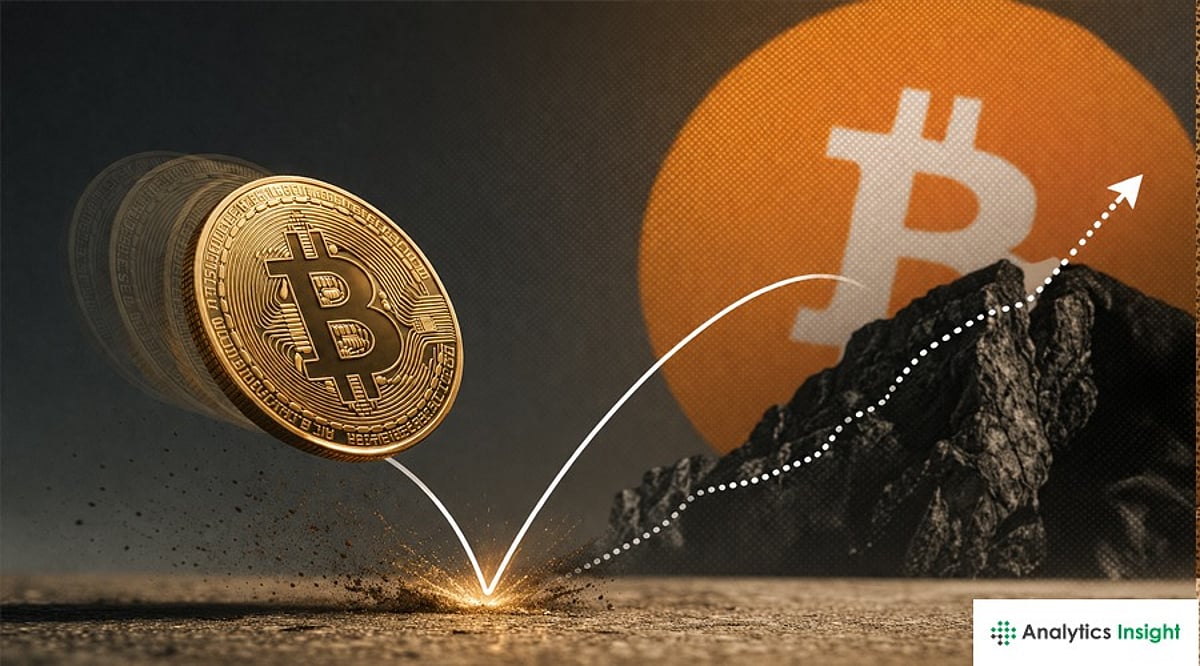
    Bitcoin has reached a critical price zone as on-chain data reveals early signs of a market bottom, while long-term chart levels continue to expose the cryptocurrency to further losses. Selling pressure appears to be easing after heavy market declines, but analysts caution that Bitcoin must hold nearby support before any sustained recovery can develop.

    The next several weeks will be pivotal in determining whether buyers can establish a stable base or if sellers will drive prices toward lower levels.

    On-Chain Model Enters Bottoming Zone

    On-chain analyst MorenoDV notes that Bitcoin has produced one of its first signals of a deeper market cleanup, though the data does not confirm a final bottom. The analyst uses the Bitcoin UTXO Block Profit and Loss Count Ratio Model, which compares profitable UTXO blocks with those holding unrealized losses.

    A high ratio indicates many holders still have profits available, creating room for further selling as investors reduce exposure or lock in gains. Conversely, a lower reading suggests more holders have moved into losses after the market has already absorbed heavy selling pressure.

    The latest ratio has entered a zone associated with earlier bottoming periods, but MorenoDV says the 365-day moving average still needs to decline further. Until that longer-term measure drops, the current signal may reflect a temporary oversold phase rather than a complete market reset.

    Bitcoin Range Keeps $67,000 in View

    Crypto trader Honey observes that Bitcoin has already moved below the June low near $59,000, leaving the June high around $67,000 as the next major range level. The trader expects the strongest range-bound outcome to involve a rise over the next four to six weeks before Bitcoin approaches the June high.

    That path would carry the price from one side of the current range to the other before any larger decline develops during the fourth quarter. This outlook does not signal the start of a new bull market, as Bitcoin would remain inside an established range while traders await clearer direction.

    Short-covering could also trigger brief rallies if bearish traders close positions, although MorenoDV says those moves would not prove a lasting recovery. The key question is whether buyers can sustain enough demand to push Bitcoin toward $67,000 while the broader market still tests long-term support.

    200-Week Average Shifts Focus Lower

    Chart analyst Nic Puckrin notes that Bitcoin closed below its 200-week simple moving average for the first time in more than three years. The break also marked the first move below that average during the current market cycle, increasing attention on lower support levels.

    In earlier bear markets, the 200-week average served as a major reference point for traders tracking long-term market weakness. Puckrin identifies the 61.8% Fibonacci retracement near $57,900 as the next support level if Bitcoin remains below the long-term average.

    If sellers break that zone, traders may turn toward the on-chain realized price near $53,200 as the next major level. For now, on-chain conditions suggest slower selling, while chart signals show that Bitcoin still faces pressure around several important support areas.

    What’s Next?

    Bitcoin shows early bottoming signals as selling pressure begins to ease, but the market still faces major risks below the 200-week moving average. Support at $57,900 and $53,200 remains critical, while $67,000 marks the next recovery target. Traders should watch these levels before confirming a stronger rebound.

  • Dogecoin 2026: ETF Adoption and Payment Expansion Could Determine DOGE’s Next Move

    Dogecoin 2026: ETF Adoption and Payment Expansion Could Determine DOGE’s Next Move

    Dogecoin (DOGE) is trading near $0.075 in late June 2026, despite the introduction of two U.S. spot exchange-traded funds (ETFs), clearer regulatory classification, and a growing payment infrastructure. Price forecasts range from $0.05 to $1 as investors weigh whether institutional access and real-world usage can generate sustained demand for the meme coin.

    ETF Growth Fails to Shift DOGE Demand

    DOGE holds a market capitalization of approximately $14.6 billion and has been trading within a tight range of $0.074 to $0.076. Resistance remains near $0.078 after an eight-month downturn in the altcoin market. The REX-Osprey DOJE fund launched in September 2025, while 21Shares listed TDOG on the Nasdaq in January 2026. TDOG maintains Dogecoin reserves on a one-to-one basis.

    Dogecoin also benefits from a formal commodity classification from the U.S. Securities and Exchange Commission (SEC). This status reduces the securities-law uncertainty that previously affected several digital assets.

    21Shares introduced the leveraged TXXD product in 2025, creating a wider regulated trading market around DOGE. Still, cumulative ETF inflows remain modest relative to Dogecoin’s market value. Spot DOGE funds recently recorded their longest positive inflow streak since launch—three consecutive weeks of gains—but the data has not yet signaled a major shift in institutional appetite.

    Annual Issuance Shapes the Price Prediction

    Dogecoin adds approximately five billion tokens each year through its fixed block reward. Unlike Bitcoin, DOGE has no hard supply cap, so new demand must absorb continuing issuance. This structure means flat demand creates gradual price pressure. ETF purchases must cover both new supply and existing selling before they materially alter the token’s demand curve.

    The base Dogecoin price prediction places DOGE near $0.15 if ETF inflows grow and the wider altcoin market recovers—roughly doubling its late-June price. The bull scenario targets $1 during a broad memecoin revival, requiring a strong risk-on market, sustained ETF demand, and continued institutional participation.

    By contrast, the bear scenario points to $0.05 if inflows remain limited and risk appetite stays weak. Market conditions remain challenging, with 84% of Binance-listed altcoins trading below their 200-day averages.

    Payment Expansion Adds a Longer-Term Use Case

    House of Doge has expanded payment infrastructure during 2026 through partnerships with merchant and consumer-finance providers. The initiative aims to move DOGE beyond brokerage accounts and speculative trading.

    House of Doge and MoonPay announced a merchant-payments partnership in June 2026. Earlier integration work targeted financial applications that could route Dogecoin through established consumer platforms.

    Dogecoin processes blocks in about 10 to 15 seconds, and transaction fees remain low. These features support everyday payments, although faster and cheaper alternatives already operate across the market.

    Merchant usage would need to absorb a meaningful share of the five billion new DOGE entering circulation each year. Current adoption has not yet reached that scale. ETF flows provide the clearest near-term measure of institutional demand, while payment activity remains an early adoption channel that requires broader participation from merchants and consumers.

    What’s Next?

    Dogecoin’s 2026 outlook depends on whether ETF inflows and payment adoption can outpace ongoing supply growth. The base case favors a move toward $0.15, while stronger demand could support higher targets. Investors should closely track fund flows, market sentiment, and real-world usage before assessing DOGE’s next major move.

  • Bitcoin and Gold Sink Together in 2026 as Market Pressures Mount

    Bitcoin and Gold Sink Together in 2026 as Market Pressures Mount

    Bitcoin and gold have both declined as higher interest rates, tighter liquidity, and market uncertainty reduced demand for traditional and digital stores of value. The rare move has raised attention because the two assets often follow different paths during market stress.

    Bitcoin and gold have fallen sharply in 2026, marking an uncommon period when two assets often viewed as stores of value declined together. Market strategist Charlie Bilello reported that Bitcoin is down 31% while gold has lost 6% this year, making them the weakest-performing major asset classes so far.

    The unusual move has drawn attention because the two assets have historically performed differently during periods of market stress.

    Bitcoin and Gold Record an Unusual Year

    Charlie Bilello reported that Bitcoin and gold have become the two worst-performing major asset classes in 2026. He described the development as something ‘we havenʼt seen before in any calendar year.’

    The simultaneous decline suggests investors have reduced exposure to both digital and traditional stores of value. Instead, capital has moved toward other asset classes that have delivered stronger returns during the year.

    Several factors have contributed to the shift. Market conditions have become more challenging in 2026 as investors respond to higher interest rates, tighter liquidity, geopolitical uncertainty and a rise in crypto-related security incidents. These factors have weakened demand for both Bitcoin and gold.

    Analysts also point to the stronger US dollar and the Federal Reserve’s restrictive monetary policy as key drivers behind the downturn. Higher borrowing costs have encouraged investors to shift toward income-generating assets, reducing interest in investments that do not produce regular yields.

    Correlation Between Bitcoin and Gold

    Bitcoin climbed above $110,000 during the second half of 2025 while gold continued to post steady gains. Even though both assets advanced, they responded to different market conditions and showed only a limited price correlation.

    The relationship changed during 2026. Bitcoin dropped from around $90,000 to nearly $60,000 after February. Gold held up better at first but later moved lower as well. By June, both assets were declining at the same time, pushing their price correlation into positive territory for one of the rarest periods on record.

    Data from CryptoQuant also showed noticeable changes in the Bitcoin-gold price correlation between June 2025 and June 2026. The correlation moved between positive and negative readings before strengthening as both assets declined together.

    Bitcoin researcher Adam Livingston commented on the trend, stating that “2026 is officially the most oversold year for Bitcoin versus gold ever recorded.” At the same time, the Bitcoin-to-gold ratio continued to weaken, reflecting Bitcoin’s larger decline compared with gold.

    Gold Outlook Remains Mixed as Market Uncertainty Continues

    Investor Robert Kiyosaki recently shifted his focus from Bitcoin to precious metals after discussing both assets earlier in June. On June 25, he announced that gold had “made the turn” and predicted a longer-term bull market for gold and silver while maintaining a $35,000 long-term price target.

    Days later, however, he revised his short-term view after gold extended its decline. On June 29, Kiyosaki admitted, “I was wrong. Gold still crashing.” Despite the setback, he maintained his longer-term bullish outlook for the metal.

    Gold has also faced pressure from changing geopolitical developments. Reports surrounding US-Iran nuclear negotiations reduced demand for safe-haven assets as some investors shifted toward riskier investments. At the same time, uncertainty over future Federal Reserve policy has continued to influence both gold and Bitcoin prices.

    Market participants are now watching central bank decisions, US dollar strength and geopolitical events for signs of whether the recent weakness in both assets will continue or begin to reverse.

  • SHIB Faces Growing Selling Pressure but Derivatives Show Renewed Trader Interest

    SHIB Faces Growing Selling Pressure but Derivatives Show Renewed Trader Interest

    Shiba Inu (SHIB) is experiencing mounting selling pressure as exchange inflows surge and technical indicators remain bearish. Despite these headwinds, the derivatives market is flashing fresh signals of trader confidence, with open interest and funding rates climbing.

    Exchange Activity Raises Selling Pressure

    Recent on-chain data shows a sharp increase in SHIB deposits to centralized exchanges. Exchange inflows exceeded 240 billion SHIB, while outflows reached nearly 295 billion SHIB during the same period. Although overall net flow remained negative, the sudden rise in deposits has drawn market attention, as large transfers to exchanges often precede selling activity. Many traders have responded by reducing buying activity, waiting for stronger signals before committing additional capital.

    Technical Structure Keeps Buyers on the Sidelines

    SHIB continues to trade below its 50-day, 100-day, and 200-day moving averages. These indicators turned bearish after the token broke below a multi-month rising wedge pattern. Since that breakdown, every recovery attempt has lost momentum as sellers return during rallies. Repeated rejections at higher levels have diminished confidence among buyers seeking a sustained rebound.

    Speculative interest remains limited. Historically, SHIB has relied on strong retail participation, social media attention, and rapid inflows of risk capital. Those drivers have been largely absent as Bitcoin, Solana, and other cryptocurrencies attract the bulk of digital asset investment. Meanwhile, on-chain activity—active addresses, sending addresses, and daily transactions—has increased over the past 24 hours, but investors remain focused on price performance as SHIB records lower highs and lower lows. The question remains: can stronger on-chain activity eventually outweigh persistent price weakness?

    Derivatives Market Shows Renewed Confidence

    While spot market demand is soft, the derivatives market is recording stronger activity. Shiba Inu perpetual futures open interest rose to $31 million on Monday, up from $18 million the previous day. This latest increase follows a previous decline that pushed open interest to $26 million on Wednesday, its lowest since September 2024. The rebound suggests traders have started opening new positions after that earlier drop.

    Additionally, the OI-weighted funding rate stayed positive, increasing to 0.011% on Monday from 0.0052% the day before. A positive funding rate indicates that traders are increasingly positioned for higher SHIB prices. As derivatives activity improves, market participants are balancing stronger futures positioning against persistent weakness in spot price action and technical indicators.

    What’s Next?

    Shiba Inu continues to face selling pressure as exchange inflows increase and technical indicators remain weak. At the same time, stronger futures open interest and a positive funding rate reflect renewed trader participation. Market participants will likely watch whether improving derivatives activity can support SHIB price momentum moving forward.

  • May Stablecoin Volume: Polygon Records $80 Billion, Tops Solana and BNB Chain

    May Stablecoin Volume: Polygon Records $80 Billion, Tops Solana and BNB Chain

    Polygon processed nearly $80 billion in stablecoin transfer volume during May, recording 198 million transactions and surpassing both Solana and BNB Chain in transaction count. The milestone marks the network’s second-highest monthly stablecoin volume on record.

    According to Polygon’s data, the network handled approximately $79.25 billion in stablecoin transfers during the month. Cumulative stablecoin transfer volume on Polygon has now exceeded $2.4 trillion. Average transaction fees remain around $0.002, with settlement times of about two seconds. The network also reports more than seven billion lifetime transactions and 99.99% uptime.

    The vast majority of activity came from USDC and USDT transfers, reflecting the growing use of stablecoins for blockchain-based payments and settlement. Polygon has continued to strengthen its payment infrastructure through acquisitions and partnerships. Earlier this year, Polygon Labs acquired Coinme and Sequence in deals valued at a combined $250 million, aimed at expanding consumer payments and developer services.

    Visa added Polygon to its stablecoin settlement pilot in April, a program that has reportedly reached a $7 billion annualized run rate. Meta also introduced USDC payouts on Polygon and Solana for eligible creators. Payment-focused applications built on Polygon generated about $9.9 billion in transaction volume during the first half of 2026, exceeding the network’s total payment-related volume for all of 2025.

    In emerging markets, Polygon processed approximately $309 million in Latin American stablecoin transfers during May, with an increasing focus on cross-border payments. Despite these growing on-chain metrics, the POL token has not mirrored the surge in usage, trading broadly in line with broader cryptocurrency market conditions.

    Solana also posted strong on-chain data during the same period, generating about $2.17 million in daily application revenue. Derivatives data showed SOL funding rates turning positive and the long-to-short ratio rising above one, indicating bullish positioning among traders. However, institutional demand remained weaker, with spot Solana ETFs recording about $3.8 million in net outflows during the previous week.

    SOL traded around $71.82, remaining below its 50-day, 100-day, and 200-day exponential moving averages. Analysts noted resistance near $74.75 and $75.14, while support sits near $69.16 and the recent cycle low around $60.13. Singapore Gulf Bank also announced a limited-time waiver of gas and banking fees for stablecoin minting and redemption on Solana, aiming to encourage greater use of stablecoins on the network.

    Competition remains intense, with Ethereum and Tron holding the largest stablecoin balances. Polygon recently reported about 28 million weekly USDC transactions, placing it ahead of Solana in that category. Both blockchains continue to expand payment services while vying for a larger share of stablecoin settlement activity.

  • MiCA Deadline Forces Thousands of European Crypto Firms to Shut Down

    MiCA Deadline Forces Thousands of European Crypto Firms to Shut Down

    Crypto companies across Europe are reaching the end of the MiCA transition period, with July 1 marking the point when older national registrations will no longer be enough to stay in business. From that date, only firms that secured a MiCA license can continue offering crypto services across the region, placing many existing operators under pressure.

    Industry figures show the gap between previously registered firms and those that completed the new licensing process. More than 3,000 virtual asset service providers (VASPs) were registered before MiCA, yet only 244 have obtained authorization as crypto-asset service providers (CASPs). Meanwhile, the European Securities and Markets Authority has instructed firms without approval to wind down their activities in an orderly manner while protecting customer assets.

    MiCA Deadline Leaves Many Firms Without Authorization

    MiCA became fully applicable across Europe after introducing stablecoin rules in June 2024 and broader crypto regulations later that year. Existing providers were granted a transition period that expires on July 1, allowing time to obtain authorization from national regulators. Licensed firms can then operate throughout the European Economic Area, which includes the European Union, Norway, Iceland, and Liechtenstein.

    Meanwhile, the European Securities and Markets Authority (ESMA) has instructed unauthorized crypto firms to close their operations in an orderly manner once the transition period ends. The regulator also asked companies to safeguard customer assets during the process. Industry executives expect the new framework to reduce the number of active providers across the region.

    Erald Ghoos, CEO of OKX Europe, estimated that “80% of the crypto players won’t survive after MiCA.” He added that “It’s not only because of MiCA itself, it’s because of the whole width and heaviness of the European regulatory burden.” According to Ghoos, firms offering stablecoin services may also require Payment Institution or Electronic Money Institution licenses, adding further compliance requirements.

    Compliance Costs Create Challenges for Smaller Companies

    Industry participants say the financial burden extends beyond the minimum capital required for authorization. Patrick Gruhn, founder and CEO of Perpetuals.com Ltd, said firms need between €50,000 and €150,000 in regulatory capital depending on their license category. However, obtaining authorization can cost as much as €700,000 during the first year, followed by annual compliance expenses that may reach €250,000 for smaller firms.

    Gruhn also stated that legal fees alone can approach €100,000, while the authorization process may take between 12 and 24 months before companies can begin regulated operations. He noted that although many businesses could disappear, numerous pre-MiCA registrations belonged to shell entities with limited activity. According to Gruhn, many compliance jobs created under the new framework may also offset employment losses elsewhere.

    Several companies have reportedly explored acquisitions rather than completing the licensing process themselves. Ghoos said some firms approached OKX Europe after determining they could not meet the regulatory costs required under MiCA.

    Poland Reflects the Wider Licensing Challenge

    Poland presents one of the clearest examples of the transition’s effect. The country previously had around 2,000 registered VASPs, yet only one company has obtained a MiCA license. Legislative delays and regulatory hurdles slowed the licensing process, leaving many firms without authorization ahead of the deadline.

    Mateusz Kara, CEO of Morphic Financial Group, said “It will change the business landscape of crypto entities a lot.” He added, “As far as I know, we are the only ones that have a MiCA license right now.” Kara also stated that many firms could be forced to cease operations during the second half of the year.

    Meanwhile, legal experts expect enforcement to differ among European jurisdictions. John Salmon, partner at Hogan Lovells, said “None of us know what’s going to happen,” noting that some countries introduced legislation later than others. However, his colleague Lavan Thasarathakumar said “Any regulator, jurisdiction, or member states allowing firms to continue to operate under their existing national law would be deemed in breach of EU regulations.”

    BitGo Europe has also introduced a regulated custody option that allows firms to transfer customer wallets instead of pursuing their own MiCA authorization. CEO Mike Belshe described the transition as ‘a setback,’ adding that “European users will become the biggest victims of the end of this transitional period.”

  • Bitcoin 2026 Mid-Year Outlook: Will the Second Half Spark a Recovery?

    Bitcoin 2026 Mid-Year Outlook: Will the Second Half Spark a Recovery?

    Bitcoin entered 2026 with high expectations after a strong rally in late 2025. During the previous market surge, Bitcoin crossed $126,000, which created huge excitement across the crypto market. Now, Bitcoin trades close to $60,000, meaning the asset has lost more than 50% of its value from the peak level. The first half of the year turned into one of the weakest periods for Bitcoin since the major crypto crash of 2022.

    Why Bitcoin Fell

    Several major reasons pushed Bitcoin lower during the first half of the year. One of the biggest reasons came from the global economy. Central banks across many countries kept interest rates high for longer than expected. Higher rates usually hurt risky assets as investors move money into safer places.

    Another reason came from changing market trends. Over the past year, large investors shifted focus toward artificial intelligence companies, technology stocks, and traditional safe assets like gold. As money moved elsewhere, Bitcoin lost some of the strong demand that helped push prices higher in previous years.

    Recently, Bitcoin even dropped below the important $60,000 support level and touched nearly $59,800. This price level worried traders since it showed that sellers still control short-term market action.

    Institutional Demand Became Weak

    Institutional demand played a huge role in Bitcoin’s rally during 2024 and 2025. Large investment firms poured billions of dollars into Bitcoin exchange-traded funds, also known as ETFs. That steady flow of money helped prices move upward very quickly.

    Recent reports show nearly $4.5 billion moved out of Bitcoin investment funds this year. This large withdrawal clearly shows that big institutions have become more careful. Many investors now wait for stronger market conditions before they put fresh money back into crypto.

    Problems Faced by Bitcoin Mining Companies

    Bitcoin miners also faced serious challenges this year. Mining companies help secure the Bitcoin network, but their business depends heavily on the market price. Right now, many mining firms face rising costs. Electricity prices remain high in several countries, while equipment costs continue to put pressure on profits. For some miners, production expenses now sit dangerously close to Bitcoin’s actual market value.

    A Big Surprise From Strategy Inc

    Strategy Inc, the company previously known as MicroStrategy, has always stood as one of Bitcoin’s biggest corporate supporters. For years, the company followed a simple strategy and kept buying Bitcoin without any plan to sell. The company announced a major restructuring plan that could lead to up to $1.25 billion worth of Bitcoin sales. Along with this move, the company also announced stock buybacks and plans to strengthen reserves.

    Reasons Recovery Still Looks Possible

    Historically, Bitcoin often follows a four-year market cycle. Price weakness usually appears after major rallies, but recovery often arrives later than expected. Some analysts believe the current correction may continue for a few more months before the market finds stability. Technical experts say the $58,000 price zone now acts as a very important support level. If Bitcoin stays above this range, price could move back toward $70,000 to $75,000 before summer ends.

    Experts Still Expect Higher Prices

    Some analysts from major firms have predicted Bitcoin could reach anywhere between $100,000 and $170,000 by the end of the year. These forecasts depend on several important factors. One major factor involves ETF demand returning later this year. Another factor depends on better government regulation. If clear crypto laws arrive in major economies, many institutions may return with fresh capital.

    What Comes Next for Bitcoin

    Right now, market sentiment remains cautious, but long-term belief has not disappeared. Some market predictions suggest Bitcoin may recover toward $80,000 to $90,000 before 2027 begins, while others remain more conservative. Much depends on economic conditions, investor confidence, and regulatory progress during the next few months.

    Bitcoin faced a very disappointing first half of 2026, but history shows sharp corrections do not always signal the end of a bull cycle. If confidence returns and institutional demand rises again, the second half of the year may finally bring the recovery that many market watchers still expect.

  • How India’s Income Tax Department Tracks Bitcoin and Crypto Transactions: KYC, TDS, and Blockchain Analytics

    How India’s Income Tax Department Tracks Bitcoin and Crypto Transactions: KYC, TDS, and Blockchain Analytics

    Yes, the Income Tax Department can trace Bitcoin and crypto transactions in India through various sources including exchange KYC records, TDS forms, blockchain analytics, bank transactions, and income tax return disclosures. Crypto is decentralized, but it’s not invisible. The department actively uses these methods, as evidenced by over 44,000 enforcement notices issued to undisclosed crypto users in 2025-26.

    In India, Virtual Digital Assets (VDAs) like cryptocurrencies such as Bitcoin, Ethereum, and others are taxable. The Income Tax Department states that income from the transfer of VDAs is taxed at a flat rate of 30% plus surcharge and cess. Further, 1% TDS is applicable on VDA transfers under Section 194S.

    How Crypto Transactions are Tracked

    Exchange Records: Exchanges gather identity information like PAN, Aadhaar-linked bank account numbers, and transaction history during every crypto transaction on FIU-approved platforms. This attaches a face to crypto transactions, purchases, sales, deposits, and withdrawals.

    TDS Reporting: Under Section 194S, 1% TDS is deducted from the consideration received on VDA transfers. This creates a tax trail even before investors file their returns. When TDS is reported by the exchange but the taxpayer does not report crypto income in Schedule VDA, a mismatch occurs, triggering scrutiny.

    Blockchain Analytics: Bitcoin and Ethereum transactions are not private. While wallet addresses do not reveal names, a wallet can be linked to a KYC exchange account, and analytics can track fund flows and historical transactions.

    FIU and PMLA Monitoring

    VDA service providers must register as reporting entities with FIU-IND under PMLA. Platforms are required to keep records and report suspicious transactions. Tax officials reported discovering Rs. 888.82 crore in undisclosed crypto transaction income during searches or arrests.

    Foreign Exchanges and Self-Custody

    Some visibility is lost with foreign exchanges, but not eliminated with self-custody wallets. Even when transactions occur through banks or P2P payments, movement of wallets and conversion to rupees may leave a trail. The OECD Crypto-Asset Reporting Framework may soon enhance cross-border information sharing.

    Why This Matters

    Crypto is not anonymous in India. Advanced tracking through KYC, TDS, blockchain analytics, and 44,000 issued tax notices makes accurate reporting under the flat 30% tax rate vital for investors to avoid severe legal scrutiny.

    What Indian Crypto Users Should Do

    Maintain exchange statements, wallet records, TDS certificates, bank transfer proofs, and transaction history. Report gains properly in Schedule VDA and disclose foreign holdings if necessary. Compliance is safer than assuming Bitcoin or other digital assets cannot be traced.

    FAQs

    1. Can the Income Tax Department track Bitcoin transactions in India? Yes, through exchange KYC, bank records, TDS filings, and blockchain analytics. Once a wallet is linked to a verified exchange account, past and future transactions become traceable.
    2. Is crypto income taxable in India? Yes, at a flat rate of 30% plus surcharge and cess, with 1% TDS on qualifying VDA transfers under Section 194S.
    3. How does 1% TDS help track crypto transactions? It creates a transaction trail linked to PAN. If gains are not reported in Schedule VDA despite TDS data, it triggers scrutiny.
    4. Can self-custody wallets hide crypto from tax authorities? They add pseudonymity but not invisibility. Wallet movements, exchange withdrawals, P2P payments, and rupee conversion can still create traces.
    5. What should Indian crypto users do for tax compliance? Maintain exchange statements, wallet records, TDS certificates, bank proofs, and transaction history.

    Disclaimer: This article is for informational purposes and does not constitute financial or investment advice. Cryptocurrencies involve risk; conduct your own research before investing.