Category: Finance

  • How to Choose the Best Travel Credit Card in India for 2026: A Complete Guide to Comparing and Saving

    How to Choose the Best Travel Credit Card in India for 2026: A Complete Guide to Comparing and Saving

    Airport lounges look great in credit card brochures. Priority boarding sounds impressive. Travel insurance feels like a safety net. But what nobody mentions upfront is that most people with travel credit cards don’t utilize them fully. They pay ₹5,000 annual fees for cards they barely use, chase reward points that expire before redemption, and assume their “travel insurance” covers everything—only to discover it doesn’t when they need it.

    The issue isn’t that travel credit cards are scams. It’s that people pick them based on marketing instead of math. A card that’s perfect for someone flying twice a month internationally becomes a terrible deal for someone taking one domestic trip annually. So, how do you choose the best travel credit card for yourself? This article answers that question.

    What Actually Matters When Choosing

    Travel credit cards offer a mix of features, and depending on how you travel, some matter much more than others.

    • Reward points: One card gives ₹0.20 per point. Another gives ₹0.50 for the same spending. And most expire within 2–3 years, whether you use them or not.
    • Airport lounge access: Everyone wants this feature, but entry-level cards cap you at 2–4 visits yearly. If you fly twice a year, you might use it twice. The other ten months, you’re paying for access you can’t use. Premium cards offer unlimited access, but they also charge ₹10,000+ annually. Are you going to lounges often enough to justify that?
    • Foreign currency markup: International travelers lose money quietly here. Regular cards charge 3–4% every time you swipe abroad. Travel credit cards reduce this to 1–2%, sometimes zero. On ₹2 lakh spent overseas, that’s ₹4,000–6,000 saved.
    • Travel insurance: Flight delays, lost baggage, medical emergencies, and trip cancellations are covered. But the catch is that coverage applies only if you booked that trip using the specific card.

    Types of Travel Credit Cards (and Who They’re Actually For)

    • General travel rewards cards: These cards provide flexibility. You can earn on everything, redeem for flights, hotels, or whatever.
    • Co-branded airline cards: With these, you fly with one carrier, earn miles, get free baggage, and priority boarding. Makes sense if you’re genuinely loyal. Waste of money if you switch airlines constantly based on whoever’s cheapest.
    • Premium travel credit cards: Expensive, with an annual charge of ₹10,000+. However, they offer unlimited lounge access, comprehensive insurance, concierge services, and high reward rates. These are only worth it if your annual travel spend exceeds ₹4–5 lakh.
    • Entry-level cards: Perfect for someone who wants to test the waters, cost ₹500–2,000 per year, and offer basic lounge access and moderate rewards.

    How to Compare Travel Credit Cards

    Start with your real travel spending from last year. If it’s under ₹1 lakh annually, premium cards will lose you money. Pick your top three priorities—say lounge access, low forex, and flexible redemption. You can’t optimize everything. Focus on what matches your actual travel behavior.

    Now calculate the benefit value:

    • Lounge visits you’ll realistically use: ₹600 per visit.
    • Reward points from your annual spend, multiplied by the redemption value per point.
    • Forex savings if you travel internationally.
    • Insurance value (compared to the standalone policy cost).

    Add it up. If the total value is less than the annual fee, you’re paying to lose money. Check redemption rules. Some cards make it deliberately complicated. If you can’t easily use rewards, they’re worthless.

    Quick Comparison Checklist

    • Route all travel spending through the card: flights, hotels, cabs, and parking. That’s how points accumulate fastest.
    • Track points quarterly. Set calendar reminders. Banks won’t warn you before they expire.
    • Compare redemption options. Sometimes points are worth ₹0.25 per point for flights, ₹0.50 for hotels. Same points, double the value depending on how you use them.
    • File insurance claims when eligible. Flight delayed 4+ hours? Claim it. Most people forget this benefit exists.
    • Pay balances in full monthly. Interest charges destroy any reward gains within weeks.

    Common Mistakes People Make While Choosing the Best Travel Credit Card

    • Paying high annual fees without enough travel spend.
    • Assuming all travel credit cards waive forex charges. They don’t.
    • Not reading insurance terms.
    • Letting points expire unused.
    • Overspending to hit milestone bonuses.

    Eligibility and Fees

    The application usually takes about 7–14 days. First, check eligibility, compare options, then apply with your documents (PAN, Aadhaar, and income proof).

    • Eligibility: Age 21–60. Minimum income of ₹3–5 lakh annually for basic cards (₹10 lakh+ for premium). Credit score of 750+ preferred.
    • Typical fees: Joining and annual fees ₹500–10,000 (sometimes waived for the first year). Forex markup 1–3.5%. Renewal fee may be waived with a minimum spend.

    Example: How the Best Travel Credit Card Can Save You Money

    Say you take three international trips a year and spend ₹1.5 lakh on flights, ₹1 lakh on hotels, and ₹80,000 on overseas.

    • Standard card (3.5% forex): ₹2,800 in forex charges. Rewards at 1 pt/₹100 return roughly ₹1,000–₹1,500 in value.
    • Mid-tier travel credit card (1.5% forex, 4X on travel): Forex charges drop to ₹1,200, saving ₹1,600. On ₹2.5 lakh in travel spends, you earn approximately ₹3,500–₹4,000 in redeemable value.

    That’s a clear value from forex savings and rewards: ₹5,000–₹6,000.

    The Bottom Line

    There’s no universal best travel credit card. Only the one matching your actual travel habits. Flying internationally quarterly? A premium card with zero forex and global lounge access makes sense. Two domestic trips yearly? Paying ₹5,000 annually for unused benefits is wasted money. Start with your real spending from last year. Then find the card whose benefits align with that reality, not with marketing fantasies about how you should travel.

    FAQs

    What should I prioritise when choosing the best travel credit card? Your actual travel frequency decides everything. Spending ₹2–3 lakh+ annually on travel? Prioritise reward rates, lounge access, and low forex. Only travelling occasionally? Focus on low fees and flexible redemption.

    Do all travel credit cards offer lounge access? No. Entry-level might give 2–4 visits per year. Premium cards may offer unlimited. Some only cover domestic lounges. Check which networks are included.

    What happens to unused reward points? They expire, usually after 2–3 years. Set reminders to check quarterly and redeem before they vanish.

    Is travel insurance included with all cards? No. Premium cards usually include it covering delays, lost bags, and medical emergencies. Read the actual policy terms.

    What’s the minimum income required? Entry-level cards need an annual income of ₹3–5 lakh. Premium cards need ₹10 lakh or more.

    Disclaimer: Analytics Insight does not provide financial advice or guidance on cryptocurrencies and stocks. This article is provided for informational purposes and does not constitute investment advice. You are responsible for conducting your own research (DYOR) before making any investments.


  • Nifty 50 and Sensex at Critical Juncture: Support and Resistance Levels Amid Mixed Global Signals

    Nifty 50 and Sensex at Critical Juncture: Support and Resistance Levels Amid Mixed Global Signals

    Indian equity markets are poised for a flat opening on Wednesday as global cues remain mixed. GIFT Nifty is trading near 23,994, down roughly 16 points from its previous close, signaling a lack of strong directional bias.

    On Tuesday, the Sensex slipped 249.70 points (0.33%) to close at 76,478.67, while the Nifty 50 declined 80.50 points (0.34%) to settle at 23,865.75. Midcap and smallcap indices outperformed, gaining 0.4% and 1% respectively. The rupee opened flat at Rs. 94.66 per dollar.

    Foreign institutional investors (FIIs) sold shares worth Rs. 2,556.75 crore on Tuesday, whereas domestic institutional investors (DIIs) bought stocks worth Rs. 6,842.34 crore, according to NSE data.

    Sensex Outlook

    Technically, the Sensex formed a small bearish candle on daily charts with non-directional intraday activity, indicating indecisiveness. Shrikant Chouhan, Head of Equity Research at Kotak Securities, said, “On the upside, 77,000 would act as a crucial resistance level. A successful breakout above 77,000 could push the market up to 77,500-77,700. On the flip side, if the market falls below the 50-day SMA or 76,300, selling pressure is likely to accelerate. Below the same, the market could retest levels of 75,800-75,500.”

    Nifty 50 Outlook

    The Nifty 50 ended lower for the third consecutive session and is approaching an important support zone. Bajaj Broking Research noted, “The 23,800-23,750 zone remains the immediate support area, coinciding with the previous gap region and lows recorded over the past two weeks. If the index holds above this level, it could witness a pullback towards 24,035 and subsequently 24,120 in the coming sessions.” The brokerage identifies the next major support around 23,500, with significant resistance between 24,500 and 24,600. They believe the overall bias remains positive and the current breather should be used as a buying opportunity.

    Bank Nifty Outlook

    Bank Nifty fell 184.45 points (0.32%) to close at 57,542.90, forming a small bearish candle. Bajaj Broking Research said the index is consolidating around April 2026 highs. A decisive move above last week’s peak could trigger fresh upside towards 59,200. However, failure to break resistance may keep the index range-bound between 57,000 and 58,500. The brokerage maintains a positive bias and recommends using the current breather as a buying opportunity.

    Disclaimer: This article is for informational purposes only and does not constitute investment advice. Analytics Insight does not provide financial guidance. Please conduct your own research before making any investment decisions.

  • MCX Gold Drops 0.76% to ₹1,41,444 as Strong Dollar and Rate-Hike Expectations Weigh; Brent Crude Edges Up 0.40%

    MCX Gold Drops 0.76% to ₹1,41,444 as Strong Dollar and Rate-Hike Expectations Weigh; Brent Crude Edges Up 0.40%

    Gold prices retreated on the Multi Commodity Exchange (MCX) on July 1, pressured by a stronger US dollar, rising Treasury yields, and growing expectations that the Federal Reserve will implement another interest rate hike in September. The precious metal’s decline reflects broader market uncertainty surrounding US monetary policy and global economic signals.

    August gold futures on MCX fell 0.76%, settling at ₹1,41,444 per 10 grams. July silver futures also slipped, declining 1.6% to ₹2,24,914 per kilogram. Meanwhile, Brent crude futures for August delivery edged up 0.40% to $73.24 a barrel, while US West Texas Intermediate (WTI) crude gained 0.40% to $69.78 a barrel.

    According to the CME FedWatch Tool, traders now assign a 67% probability to a rate hike by the US Federal Reserve in September, adding downward pressure on non-yielding assets like gold.

    Domestic Gold Prices

    In the Indian market, 24K gold declined by ₹126 to ₹1,40,780 per 10 grams, while 22K gold dropped by ₹115 to ₹1,29,050. Regional variations were minimal: Mumbai and Kolkata both quoted 24K gold at ₹1,40,780, Delhi at ₹1,40,930, and Chennai at ₹1,43,990.

    US Gold Prices

    In the international market, gold prices fell for a second session, hitting a seven-month low earlier this week. Spot gold was down 0.7% at $3,979.41 per ounce, while US gold futures for August delivery lost 1.1% to $3,992.70. The decline was fueled by lingering inflation concerns and uncertainty surrounding US-Iran peace talks, which continue to keep Fed rate hike expectations elevated.

    Spot silver declined 1.4% to $57.75 per ounce, platinum lost 0.6% to $1,542 (hitting its lowest since last November), and palladium edged 0.4% lower to $1,199.34.

    Key Levels to Watch

    “It looks like the pressure from higher yields is what’s getting gold lower. The US dollar is also a touch higher at the same time, which kind of confirms what’s going on,” said Ilya Spivak, Head of Global Macro at Tastylive.

    Internationally, gold has support at $3,994 and $3,955 per troy ounce, with resistance at $4,074 and $4,110. Silver support stands at $57.70 and $56, while resistance is at $61.20 and $62.80.

    On MCX, gold support levels are at ₹1,41,100 and ₹1,40,000, with resistance at ₹1,43,350 and ₹1,44,200. Silver on MCX has support at ₹2,25,500 and ₹2,22,000, while resistance lies at ₹2,31,000 and ₹2,34,400.

  • Wall Street Poised for Best Quarter in Years as Tech Stocks Rebound Amid Geopolitical Calm

    Wall Street Poised for Best Quarter in Years as Tech Stocks Rebound Amid Geopolitical Calm

    Wall Street is on track to close the second quarter with its strongest performance in years, even as ongoing US-Iran tensions continue to create geopolitical uncertainty. Investors have maintained buying momentum, buoyed by optimism over the upcoming earnings season and easing concerns about Middle East hostilities. Major indexes posted solid gains, with technology shares staging a recovery after a challenging June.

    Major US Indexes Target Strongest Quarterly Gains

    The S&P 500 and NASDAQ Composite are heading toward their best quarterly gains in six years, while the Dow Jones Industrial Average is on pace for its strongest quarter since 2022. In Tuesday trading, the S&P 500 rose 0.34%, the NASDAQ gained 0.76%, and the Dow traded nearly flat. These gains reflect continued investor confidence despite earlier volatility driven by semiconductor weakness.

    The Dow is also on track for its best first-half performance since 2021. The S&P 500 has posted more than an 8% gain during the first six months of 2026, while the NASDAQ has advanced over 11%. The Russell 2000 has outperformed larger indexes, climbing more than 21% in the same period.

    Technology Stocks Recover as Earnings Season Approaches

    Technology stocks helped lift markets after suffering sharp losses earlier in June. Investors are now shifting focus to the upcoming corporate earnings season, expecting strong results to support current valuations. Chipmakers led Tuesday’s rally: NVIDIA gained more than 1%, Advanced Micro Devices advanced about 3%, and Intel climbed roughly 4%.

    Semiconductor exchange-traded funds also delivered record quarterly gains. The VanEck Semiconductor ETF surged around 70% during the second quarter, while the iShares Semiconductor ETF gained approximately 94%. Micron was among the sector’s strongest performers, rising about 240% during the quarter.

    Despite Tuesday’s rebound, June remained challenging for several technology stocks. The S&P 500 and NASDAQ are still on track to end two consecutive months of gains as investors reassess AI-related valuations.

    Geopolitical Developments and Interest Rates Remain in Focus

    Investors continue monitoring US-Iran developments. Recent signs of reduced hostilities have improved market sentiment after both countries agreed to halt attacks and allow commercial shipping through the Strait of Hormuz. Oil prices remained relatively stable, with Brent crude trading near $73 per barrel and West Texas Intermediate around $70. Stable energy prices have helped ease concerns about additional inflation pressure.

    Markets are also focused on monetary policy expectations. Traders now anticipate at least one Federal Reserve rate hike before the end of 2026, following stronger economic data that shifted expectations away from earlier forecasts for rate cuts. Investors are awaiting comments from Federal Reserve Chair Kevin Warsh after fresh job openings and consumer confidence reports.

    Individual Stocks Post Mixed Performance

    Several individual companies recorded notable moves during Tuesday’s session. Concentrix shares fell more than 20% after lowering its full-year revenue and adjusted profit forecasts, pushing the stock to a record low. In contrast, AeroVironment surged about 22% after reporting a strong increase in quarterly revenue. Morgan Stanley slipped around 1% after Oppenheimer downgraded major Wall Street investment banks and encouraged investors to consider alternative asset managers.

    European markets also ended higher on the final trading day of June, with technology stocks leading regional gains. Major indexes in Germany, France, Italy, and the United Kingdom all closed in positive territory. Although analysts continue monitoring geopolitical developments and interest rate expectations, strong corporate earnings and resilient investor demand have kept Wall Street positioned for one of its strongest quarters in recent years.

  • Weekly IPO Preview: Knack Packaging and Aastha Spintex Lead India’s July Market Open

    Weekly IPO Preview: Knack Packaging and Aastha Spintex Lead India’s July Market Open

    India’s primary market remains active as the first week of July 2026 brings a slate of initial public offerings spanning packaging, textiles, logistics, and cybersecurity. Two mainboard IPOs—Knack Packaging and Aastha Spintex—anchor the calendar alongside several SME issues on BSE SME and NSE Emerge. Investors are advised to focus on fund usage clarity and profitability trends rather than headline issue sizes.

    Key Dates and Timeline

    • Aastha Spintex: Opened June 29, closes July 1.
    • Knack Packaging: Opens July 1, closes July 3 (anchor book closed June 30).
    • SME IPOs (Kratikal Tech, Sampark India Logistics, Atharva Polyplast, Seemax Resources): Opened June 30, close July 2, listing July 7.
    • Listings this week: Turtlemint Fintech Solutions and Anubhav Plast on June 30; Waterways Leisure Tourism on July 1; CSM Technologies on July 2.

    Knack Packaging – Capacity Expansion in Focus

    Gujarat-based Knack Packaging manufactures printed and laminated woven polypropylene (PLWPP) bags. The Rs. 439.5 crore IPO (Rs. 380 crore fresh issue + Rs. 59.5 crore OFS) values the company at roughly Rs. 2,080 crore at the upper price band. Key financials: Revenue rose from Rs. 747.38 crore in FY25 to Rs. 843.77 crore in FY26; profit increased from Rs. 73.81 crore to Rs. 92.72 crore. The company plans to deploy Rs. 320 crore of fresh proceeds toward a new manufacturing facility in Mehsana, Gujarat. Grey market premium stood at Rs. 17–Rs. 18 as of June 29, suggesting modest listing gains.

    Aastha Spintex – Acquisition-Driven Growth

    Aastha Spintex manufactures carded, combed, and compact combed cotton yarns and bales. The Rs. 170 crore fresh-issue IPO is priced at Rs. 125–Rs. 136 per share. Revenue grew 15.19% to Rs. 351.16 crore in FY25, while net profit jumped 40.7% to Rs. 22.92 crore. Funds will primarily finance the acquisition of Falcon Yarns Private Limited, expanding capacity to 17,457 MTPA. The IPO is fully valued at roughly 15x estimated FY27 PAT, leaving limited safety margin. Investors should weigh integration risk and raw material dependency.

    SME Issues to Watch

    • Kratikal Tech: Cybersecurity and rapid application development; raising Rs. 40 crore on BSE SME.
    • Sampark India Logistics: Logistics services across 18 states; raising Rs. 27.22 crore.
    • Atharva Polyplast: Precision plastics manufacturer from Satara; raising Rs. 27 crore for working capital and debt reduction.

    SME IPOs carry higher post-listing liquidity risk and wider bid-ask spreads. Investors should assess exit options carefully.

    Investor Outlook

    Knack Packaging presents a clearer investment case with steady growth, rising profitability, and a concrete capex plan. Aastha Spintex’s story hinges on successful M&A integration and margin expansion. Given favorable market conditions, institutional participation is expected, but issuer-specific due diligence remains critical. Monitoring subscription trends across QIB and retail categories, along with grey market premiums, will help gauge demand.

    For full details, refer to each company’s Red Herring Prospectus.

  • Big Tech’s Magnificent 7 Stocks Plunge $2.3 Trillion as AI Investment Doubts Mount

    Big Tech’s Magnificent 7 Stocks Plunge $2.3 Trillion as AI Investment Doubts Mount

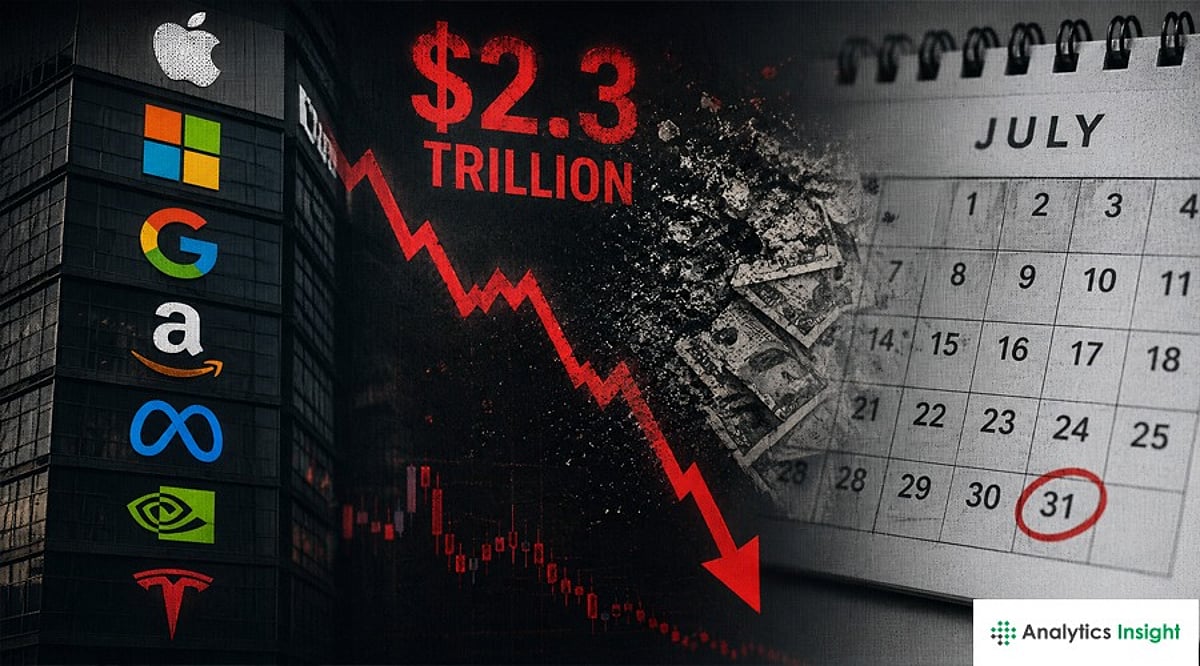
    June proved disastrous for the Magnificent 7 stocks as investor anxiety over massive AI spending and uncertain returns triggered a selloff that erased nearly $2.3 trillion in market value. The decline ranks among the steepest monthly losses ever recorded for Big Tech.

    The group—comprising Microsoft, NVIDIA, Apple, Alphabet, Amazon, Meta, and Tesla—had led the market for months on AI enthusiasm. However, June brought a sharp reversal as attention shifted from future promise to current spending and profitability.

    The Magnificent 7 Index fell roughly 10% in June, extending its decline to more than 13% from a mid-May peak. Investors now demand concrete evidence that billions poured into AI infrastructure will translate into higher earnings.

    Microsoft suffered the steepest drop among the seven, with its stock tumbling about 20% in June. NVIDIA lost nearly 13%, while Apple and Amazon each declined around 8%. The broad selloff reflects growing caution around companies investing heavily in AI without clear financial payoffs.

    Big Tech continues to pour capital into AI. Microsoft, Amazon, Alphabet, and Meta are expanding data centers and purchasing advanced AI chips to support future growth. Industry analysts estimate AI-related spending could exceed $700 billion in 2026. Such outlays have depressed free cash flow expectations, undermining investor confidence in valuations.

    Analysts believe the upcoming earnings season will be pivotal. Investors want to see that AI investments are boosting revenue rather than simply inflating costs. Wedbush analyst Dan Ives noted that the next earnings reports could clarify whether the AI investment cycle is on the right track.

    Recent market moves suggest a preference for tangible results over ambitious promises. Companies that successfully convert AI spending into stronger earnings may recover investor trust more quickly.

    Capital has also rotated toward AI hardware makers. Semiconductor and memory companies have outperformed the Magnificent 7 this month. The Philadelphia Semiconductor Index gained about 6% in June and is still up more than 90% year-to-date, indicating that investors currently favor businesses directly benefiting from AI demand.

    Many experts argue that the selloff does not signal the end of the AI story. Instead, the market is demanding clearer proof that expensive AI projects will generate improved profits. The coming round of earnings reports will be crucial in determining whether the Magnificent 7 rebound or remain under pressure for the rest of the year.

  • Indian Stock Market Today: Sensex Drops 155 Points, Nifty Slips to 23,886 as IT Stocks Drag; Small Caps Advance

    Indian Stock Market Today: Sensex Drops 155 Points, Nifty Slips to 23,886 as IT Stocks Drag; Small Caps Advance

    Indian benchmark indices ended lower on Tuesday, June 30, 2026, after a positive start gave way to caution over global geopolitical developments. The Sensex slipped 155.87 points to close at 76,572.50, while the Nifty50 fell 59.45 points to settle at 23,886.80. Weakness in IT, auto, and metal sectors dragged the market down, but small-cap stocks managed to stay in positive territory.

    Key Takeaways

    • Nifty50 falls 59.45 points to 23,886.80; Sensex drops 155.87 points to 76,572.50.
    • Nifty IT declines over 2%, becoming the worst-performing sector, with Infosys among top losers.
    • Five new IPOs open today, while Aastha Spintex, Adon Agro, Twinkle Papers, and Crazy Snacks continue subscriptions.

    Global Tensions Weigh on Investor Sentiment

    The primary trigger for today’s decline was uncertainty surrounding US–Iran negotiations. Investors adopted a cautious stance as the outcome of these talks could influence global trade, oil prices, and overall economic stability. Early morning gains evaporated as traders reacted to the risk-off mood.

    Top Losers: Eicher Motors, Tata Consumer, Infosys

    Several heavyweight stocks came under selling pressure. Eicher Motors and Tata Consumer Products were among the worst performers on the Nifty50. Infosys also recorded sharp losses, reflecting the broader weakness in the technology sector.

    Mixed Performance in Broader Market

    The broader market presented a contrasting picture. The Nifty MidCap index edged down 0.05%, indicating mild selling in mid-sized companies. In contrast, the Nifty SmallCap index rose 0.37%, showing selective buying interest in smaller names despite the overall market decline.

    Sectoral Roundup: IT Worst Hit, Chemicals and Realty Shine

    The Nifty IT index plunged more than 2%, making technology the day’s worst-performing sector. The Nifty Auto and Nifty Metal indices also traded lower. On the positive side, the Nifty Chemical and Nifty Realty indices outperformed, closing higher.

    Busy Day in the IPO Market

    Six new initial public offers opened for subscription on Tuesday: Kratikal Tech, Vinit Mobile, Sampark India Logistics, Seemax Resources, Atharva Polyplast, and Teja Engineering Industries. Meanwhile, ongoing IPOs for Aastha Spintex (targeting ₹170 crore), Adon Agro Commodities (₹44.03 crore), Twinkle Papers (₹27.52 crore), and Crazy Snacks (₹31.47 crore) entered their second day of subscription.

    Outlook

    Market participants remain focused on the US–Iran talks for near-term direction. Until clarity emerges, volatility is likely to persist. However, strength in select sectors and active primary market issuance could provide pockets of opportunity.

    FAQs

    1. Why did the stock market fall today?
    The market declined due to caution ahead of US–Iran negotiations, which dampened global sentiment and erased early gains.

    2. What is the Nifty50 level today?
    The Nifty50 fell 59.45 points (0.25%) to close at 23,886.80.

    3. Which sector performed the worst today?
    The technology sector (Nifty IT) dropped over 2%, making it the worst-performing sector.

    4. Which stocks were the top losers?
    Eicher Motors, Tata Consumer Products, and Infosys were among the biggest losers on the Nifty50.

    5. Which IPOs opened for subscription today?
    Six IPOs opened: Kratikal Tech, Vinit Mobile, Sampark India Logistics, Seemax Resources, Atharva Polyplast, and Teja Engineering Industries.

    Disclaimer: This article is for informational purposes only and does not constitute investment advice. Always conduct your own research before making investment decisions.

  • TCS Stock Drops Below Rs 2,050 as Nifty IT Hits Two-Year Low Amid Global Demand Worries

    TCS Stock Drops Below Rs 2,050 as Nifty IT Hits Two-Year Low Amid Global Demand Worries

    Tata Consultancy Services (TCS), India’s largest software exporter, saw its shares fall below the Rs 2,050 mark on Monday, extending a sharp correction from January highs. The decline reflects growing investor anxiety over slowing global enterprise technology spending and a cautious earnings outlook.

    The sell-off was not limited to TCS. Infosys, Wipro, HCLTech, Tech Mahindra, and LTIMindtree also traded lower, dragging the Nifty IT index to its lowest level since April 2023. The index’s heavy reliance on overseas clients makes it particularly vulnerable to global economic headwinds.

    TCS Sets the Tone for the IT Sector

    TCS is widely regarded as a barometer for India’s IT industry. Its performance often dictates investor sentiment toward the sector. The current correction stems from fears that corporations in the US and Europe are delaying technology spending. While major deals are still being announced, experts note that execution timelines have lengthened due to clients’ conservative stance.

    For investors, the focus has shifted from signing deals to converting them into revenue.

    Global Macroeconomic Headwinds Dominate

    The downward pressure on Indian IT stocks is largely external. Persistently high inflation in advanced economies increases the likelihood that the US Federal Reserve will keep interest rates elevated for an extended period. Higher rates typically prompt companies to delay investments in non-essential technologies, such as consulting engagements and digital transformations—areas that fuel Indian software exports. Demand in key foreign markets remains highly unpredictable heading into the quarter.

    Sector’s Dependence on Global Clients Amplifies Risks

    Unlike manufacturing and financial services firms, which are driven by domestic demand, Indian software companies rely heavily on a few foreign sectors. Banking, financial services, and insurance (BFSI) account for the largest share of revenue, followed by retail, technology, and manufacturing. A slowdown in any of these sectors directly affects Indian IT companies’ income, explaining why developments in the US economy impact domestic IT shares more than local events do.

    June-Quarter Earnings Could Decide the Sector’s Next Move

    The upcoming quarterly results will provide the clearest picture of the current demand environment. Along with financial numbers, investors will focus on management commentary about discretionary spending, order books, large deal closures, hiring, and the pace of AI monetization. A positive shift in client spending could spark a rally, but if management issues conservative guidance again, the sector’s earnings turnaround will likely be prolonged.

    Lower Valuations Alone May Not Attract Buyers

    The sharp retracement has improved valuations across large-cap IT stocks compared with earlier this year. However, analysts caution that attractive valuations do not guarantee a revival. Institutional investors are now favoring industries with greater visibility into domestic earnings, such as banking, defense, capital goods, and infrastructure. The export-dependent technology sector will continue to lag until global demand improves.

    Outlook

    TCS remains a barometer for the Indian tech sector. The prolonged decline stems from the global growth slowdown and concerns about enterprise tech investments and earnings visibility. For a recovery, the sector needs three things: clarity on US monetary policy, an improvement in global corporate technology budgets, and positive commentary from companies during the June-quarter earnings season. If discretionary spending improves in the second half of the fiscal year, India’s tech majors may regain investor confidence.

  • RWA Global Inc Forges $300M Tokenization Deal to Open China’s New-Energy Market to Global Investors

    RWA Global Inc Forges $300M Tokenization Deal to Open China’s New-Energy Market to Global Investors

    For over a decade, foreign investors have watched China’s electric-vehicle boom from a distance, locked out by capital controls and strict regulatory barriers. A new advisory agreement between RWA Global Inc and Golden Dolphin Trading L.L.C. aims to change that by tokenizing approximately $300 million in real-world assets tied to China’s new-energy mobility infrastructure.

    RWA Global Inc, a real-world asset tokenization consultancy based in the British Virgin Islands and the UAE, has signed a formal advisory engagement with Golden Dolphin Trading, a UAE-registered company that owns new-energy mobility assets in mainland China. The plan involves wrapping economic rights to assets such as EV charging stations into regulated digital securities that can be offered to global investors while staying within China’s compliance framework.

    The key enabler is a regulatory shift that occurred on February 6, 2026, when the People’s Bank of China, the CSRC, and six other agencies issued a notice (Yin Fa [2026] No. 42) and accompanying CSRC guidelines. While the document tightens rules on onshore tokenization and renminbi stablecoins, it also introduces for the first time a filing-based route for issuing tokens offshore that are backed by onshore Chinese assets, provided the issuer obtains prior CSRC approval. It is not an open door, but it is a real opening.

    The assets under consideration are substantial. China sold roughly 16.5 million new-energy vehicles in 2025, more than half of all new car sales in the country. The charging network has expanded to over 19 million points, and the domestic charging market is valued north of $25 billion. These physical, cash-generating assets are ideally suited for tokenization, which can broaden the investor base, reduce fundraising friction, and add liquidity to traditionally illiquid holdings.

    The global market for real-world asset tokenization is growing rapidly. Excluding stablecoins, tokenized real-world assets reached an estimated $24–30 billion on-chain by the end of 2025, more than tripling year-over-year. Including stablecoins, the broader figure surpassed $300 billion, according to CoinGecko’s 2026 report. Major financial institutions like BlackRock and Franklin Templeton are already active in the space.

    RWA Global Inc CEO Kevin Yunai stated: “China’s new-energy economy is among the most dynamic in the world, yet global investors have had few compliant ways to participate in it directly. This engagement is a first step toward a transparent, regulated bridge between international capital and Chinese real-world assets.” Donna Tang of Esquare Legal described the deal as “an early step toward a compliant offshore bridge between China’s industrial value and global capital,” offering a cleaner path for outside exposure to the country’s clean-energy push.

    Whether the model scales depends on how the CSRC handles filings in practice. Initial deals under any new regime tend to move slowly. But if successful, the template — onshore assets, offshore tokens, regulator in the loop — could extend far beyond a single $300 million deal.

    Disclaimer: This article is for informational purposes only and does not constitute an offer or solicitation to buy any security, token, or financial instrument. The advisory engagement described is indicative and subject to client decisions, qualified counsel, and regulatory approval. Market figures are from third-party sources and have not been independently verified.

  • FTSE 100 Rises 29 Points to 10,513 as UK GDP Growth Beats Expectations, Miners Lead Gains

    FTSE 100 Rises 29 Points to 10,513 as UK GDP Growth Beats Expectations, Miners Lead Gains

    The FTSE 100 opened 29 points higher at 10,513 on Tuesday, as fresh data showed the UK economy grew faster than expected in the first quarter. The rally was led by mining stocks amid a broader global market uplift, even as uncertainty lingers over the US-Iran peace deal.

    Brent crude futures fell 1.04% to $72.39 a barrel, while US West Texas Intermediate (WTI) rose 0.78% to $70.20.

    Gainers and Losers

    On the upside, Antofagasta jumped 3.12% to £3,864, and Anglo American advanced 3.09% to £3,739. Polar Capital Technology Trust gained 2.55% to £703, Glencore rose 2.43% to £523.40, Sainsbury’s added 2.34% to £323.20, and Rio Tinto climbed 1.94% to £7,213. On the downside, Persimmon fell 2.87% to £1,051, Coca-Cola HBC slipped 1.01% to £4,884, 3i Group declined 1% to £2,471, Coca-Cola Europacific Partners dropped 0.91% to £7,615, Severn Trent eased 0.61% to £2,948, and Games Workshop edged down 0.18% to £21,880.

    Smarter Web Company Posts £72 Million Loss

    The crypto firm reported a £72 million loss as Bitcoin fell below $60,000. The company, which once had a market cap of around £1 billion, has now fallen below £100 million. Despite the setback, the firm said it remains confident in Bitcoin’s long-term prospects, noting that volatility is a historical feature of the asset.

    Sainsbury’s Sales Jump 3.1%

    Sainsbury’s total sales rose 3.1% year-on-year to £8 billion, driven by strong demand for berries, barbecue, and deli products during record heat. Grocery sales increased 3.6% to £7.6 billion, but the company warned that the long-term impact on business and customers remains uncertain. General merchandise and clothing sales declined 3.7% to £438 million. Argos continued to struggle due to subdued consumer spending, with sales falling 0.5% to £1.1 billion, though a late spike in TV sales came as the World Cup began.

    UK Economic Growth Revised

    The UK economy grew 0.6% in the first quarter compared to the previous quarter, unrevised from the earlier estimate. However, year-on-year growth was revised down to 0.9% from 1.1%. Business investment rose 0.9% on the quarter, imports jumped 1.4%, household consumption grew 0.6%, and government spending increased 1.3%. Liz McKeown of the ONS said growth in Q1 was unchanged, but the 2025 growth figure was revised downward.

    Global Market View

    In the US, the Dow Jones added 0.6% to close above 52,000 for the first time, the Nasdaq rose 2.1%, and the S&P 500 gained 1.2%. In Asia, South Korea’s Kospi rose 0.97%, Japan’s Nikkei 225 gained 0.86%, and Taiwan’s TAIEX advanced 2.5%. India’s Nifty 50 and Sensex both fell slightly, by 0.04% and 0.15% respectively.

    Disclaimer: This article is for informational purposes only and does not constitute investment advice. Cryptocurrencies and stocks carry risk; readers should conduct their own research before investing.