Tag: Data & Analytics

  • Smart Mobility: The Core Technologies Transforming Transportation and Beyond

    Smart Mobility: The Core Technologies Transforming Transportation and Beyond

    Smart mobility is often described as the quiet engine driving modern transportation systems. While much of the attention goes to electric vehicles or autonomous cars, the real transformation lies in a combination of technologies that work together to make transportation safer, more efficient, and more sustainable. From connected platforms to intelligent infrastructure, these components form the backbone of smart mobility.

    Connected Vehicle Platforms

    Connected platforms link vehicles, infrastructure, and users, enabling real-time communication, navigation updates, predictive services, and smarter transportation decisions across cities.

    Advanced Sensors

    Sensors continuously gather information about surroundings, traffic, and vehicle conditions, helping mobility systems understand environments and respond intelligently to changing situations.

    Vehicle Software

    Software increasingly controls essential vehicle functions, allowing manufacturers to deliver updates, introduce features, and improve performance throughout a vehicle’s operational lifespan.

    Intelligent Infrastructure

    Connected roads, traffic signals, and charging networks exchange information with vehicles, helping coordinate movement while improving efficiency and reducing unnecessary congestion.

    Data Analytics

    Mobility platforms analyze enormous volumes of transportation data, revealing patterns that can improve route planning, maintenance schedules, traffic management, and services.

    Electric Mobility

    Electric vehicles rely on sophisticated software, batteries, and charging networks, creating interconnected ecosystems where energy management becomes central to everyday transportation.

    Autonomous Driving

    Autonomous systems combine sensors, computing power, mapping, and artificial intelligence to interpret surroundings, support driving decisions, and gradually automate transportation tasks.

    Smart Logistics

    Connected mobility technology helps logistics operators track vehicles, optimize routes, monitor deliveries, and coordinate fleets, improving operational visibility across complex transportation networks.

    Urban Mobility

    Smart mobility extends beyond private cars, connecting public transport, shared mobility, cycling infrastructure, and pedestrian systems to create more coordinated urban transportation.

    Together, these technologies form the foundation of a smarter, more connected transportation ecosystem that goes far beyond the vehicle itself.

  • Power BI Explained: Key Components, Features, and How It Drives Business Insights

    Power BI Explained: Key Components, Features, and How It Drives Business Insights

    In today’s data-driven landscape, collecting information isn’t enough. Organizations need the right tools to organize, analyze, and visualize data to make smarter decisions. Microsoft Power BI is one such business analytics service that empowers teams to turn raw data into actionable insights.

    What Is Power BI?

    Power BI is a suite of software, apps, and connectors that pulls data from multiple sources—such as Excel files, cloud services, and databases—and transforms it into interactive reports and dashboards. Users can then model, analyze, and share this information across their organization, enabling better decision-making without relying on manual data inspection.

    Core Components of Power BI

    Power BI’s ecosystem is made up of several components, each serving a distinct role in the analytics workflow.

    Power BI Desktop

    Power BI Desktop is a free Windows application used primarily by analysts and report developers. It provides tools for connecting to data sources, cleaning and shaping data, building data models, and designing visuals. Once a report is complete, it can be published to the Power BI Service for broader access.

    Power BI Service

    Power BI Service is the cloud-based sharing and publishing platform. It allows users to view dashboards in a browser, collaborate on reports, and schedule automatic data refreshes so teams always work with the latest information.

    Power BI Mobile

    With native apps for Android and iOS, Power BI Mobile keeps business intelligence accessible on the go. Users can interact with live dashboards and reports from anywhere, staying connected to key metrics and performance indicators.

    Power BI Gateway

    The Power BI Gateway acts as a secure bridge between on-premises data sources and the cloud-based service. This lets organizations keep sensitive data on local servers while still using Power BI’s analytics and reporting features.

    Power BI Report Server

    For organizations that need to keep reports behind their own firewall, the Power BI Report Server offers an on-premises option. It delivers the same reporting capabilities while allowing companies to maintain full control over their data infrastructure.

    Key Features and Capabilities

    Power BI is more than just a visualization tool. It offers a broad set of features that make business intelligence accessible to both technical and non-technical users.

    • Broad Data Connectivity: Power BI connects to Excel, SQL Server, Google Analytics, Salesforce, and many other sources, making it possible to combine data from every corner of the business.
    • Interactive Visualizations: Users can build charts, maps, and graphs that allow filtering and drill-down, making it easier to explore complex datasets.
    • Real-Time Dashboards: Dashboards can stream live data and update automatically, giving organizations up-to-the-minute visibility into sales, customer behavior, and operational performance.
    • Natural Language Queries: The AI-backed Q&A feature lets users ask plain-language questions like “total sales in July” and receive immediate visual answers. This opens the platform to team members without SQL or coding expertise.
    • AI-Powered Insights: Machine learning capabilities assist in detecting patterns, forecasting trends, and even performing image classification, enabling deeper analysis than basic reporting allows.
    • Advanced Data Modeling with DAX: Data Analysis Expressions (DAX) provides a powerful formula language for creating custom calculations and measures, enabling rich and precise business metrics.

    Why Organizations Choose Power BI

    Businesses of all sizes adopt Power BI because it centralizes data collection, modeling, analysis, and visualization into one cohesive platform. Its automatic refresh capabilities eliminate the need for manual report preparation, while role-based access and security controls keep information safe. From a small company tracking Excel spreadsheets to a large enterprise analyzing continuous data streams, Power BI scales to meet demand.

    As the importance of data grows, Power BI stands out as a practical way to turn massive volumes of raw information into clear, actionable reports.

    Frequently Asked Questions

    What is Power BI used for?

    Power BI is used to analyze data, build interactive reports, and share dashboards that support data-driven decisions.

    What are the main components of Power BI?

    The core components are Power BI Desktop, Power BI Service, Power BI Mobile, Power BI Gateway, and Power BI Report Server.

    Can Power BI connect to multiple data sources?

    Yes, Power BI supports connections to a wide variety of sources, including Excel, SQL Server, cloud services, and marketing tools.

    Does Power BI provide real-time updates?

    Yes, Power BI supports real-time dashboards that refresh automatically with streaming data sources.

    Is Power BI suitable for large organizations?

    Yes, Power BI is scalable and can serve the needs of both small businesses and large enterprises.

  • Power BI PL-300 Certification in 2026: Exam Cost, Skills, and Career Impact

    Power BI PL-300 Certification in 2026: Exam Cost, Skills, and Career Impact

    Why Power BI Certification Still Matters in 2026

    The Microsoft Certified: Power BI Data Analyst Associate credential remains one of the most respected analytics certifications for 2026. Candidates earn it by passing the PL-300 exam, which focuses on real-world skills needed to prepare, model, and visualize data in Power BI, as well as deploy and secure analytics solutions.

    PL-300 Exam Cost and Study Options

    The PL-300 exam is priced at about $165, though fees vary by country and region. In India, candidates typically pay between ₹8,000 and ₹12,000. Study options range from free Microsoft Learn modules to paid instructor-led courses and practice exams, so you can build your skills on almost any budget.

    Core Skills Measured by the PL-300

    The exam covers four major areas that mirror the daily work of a Power BI data analyst:

    • Prepare Data: Using Power Query for data extraction, transformation, and cleaning.
    • Model Data: Creating relationships, star schemas, DAX expressions, and performance-optimized models.
    • Visualize and Analyze: Designing reports, dashboards, filters, and AI-powered visuals.
    • Manage and Secure: Working with Power BI Service, workspaces, scheduled refreshes, sharing, governance, and row-level security.

    In 2026, familiarity with Microsoft Fabric and Copilot features is increasingly important for the PL-300 exam and on the job.

    Career Benefits and Salary Impact

    Earning PL-300 can strengthen your resume for roles such as data analyst, BI developer, and business analyst. Microsoft certification provides a clear, structured way to prove your Power BI skills and can make you stand out when employers list the credential as preferred or required.

    The certification may also support salary growth, though actual gains depend on experience, location, industry, and role. Some industry sources report a 5–15% salary premium for certified professionals. That value increases when certification is paired with hands-on Power BI projects.

    Who Should Take the PL-300?

    PL-300 is well suited for aspiring data analysts, Excel or SQL users moving into business intelligence, and professionals in finance, operations, marketing, or product analytics. The credential is valid for one year and can be renewed at no cost by completing Microsoft’s online renewal assessment.

    Whether you are starting a BI career or looking to formalize your current skills, Power BI certification is a practical investment for 2026.

  • How to Build a Decision-Centered Business Intelligence Strategy That Delivers Results

    How to Build a Decision-Centered Business Intelligence Strategy That Delivers Results

    A strong Business Intelligence (BI) strategy connects trusted data, clear metrics, semantic models, AI, and governance directly to business decisions. This approach helps companies improve accuracy, speed, insight, and measurable results. Without a decision-centric focus, even the most sophisticated BI program can produce hundreds of charts yet leave leaders without clear answers.

    Start with Business Decisions

    A practical BI strategy begins with the decisions that affect revenue, costs, risk, customers, and operations. Each major decision needs a clear owner, a defined time frame, reliable data, useful metrics, an action path, and a way to measure the outcome. For example, a sales forecast gains real value when a business leader uses it to set targets, adjust a market plan, or reallocate resources. This approach transforms BI from a report factory into a decision system. Gartner’s 2026 research confirms that analytics value depends on defined, governed, and operational decisions rather than insight alone.

    Put Data Quality First

    AI cannot repair weak source data. BARC’s 2026 Data, BI and Analytics Trend Monitor, based on responses from 1,579 professionals worldwide, ranks data quality at the top of its trend list. Data security and privacy follow closely at 7.9 out of 10. A reliable BI foundation requires accurate records, clear ownership, secure access, fresh data, strong definitions, and data lineage. These controls become even more critical when AI tools access large amounts of corporate information. Poor source data can spread errors across reports, forecasts, recommendations, and automated decisions.

    Create One Business Definition

    Different teams often use the same term for different measures. Revenue, active customer, churn, margin, and forecast can each have several definitions. A semantic layer brings these definitions together through common business terms, data fields, rules, relationships, and approved metrics. Gartner’s 2026 research identifies composite semantic layers as an important direction for data and analytics, helping reduce gaps between data systems and providing stronger context for accurate AI agent results. Major BI platforms now reflect this shift: Microsoft’s June 2026 Power BI update added Fabric Apps for semantic models, and Tableau’s August 2026 release included a Semantic Model Builder with AI tools.

    Add AI with Clear Guardrails

    Generative AI helps analysts ask questions in plain language, create measures, explain trends, and find patterns. AI agents can also support data workflows and routine analysis. However, these tools need clear limits, audit trails, access rules, human review, and measurable standards for accuracy. Gartner’s June 2026 outlook lists decision governance, AI governance, and agentic data streams among major trends. The firm forecasts that explicitly modeled business decisions could achieve five times higher trust and 80% faster execution than ungoverned decisions by 2029.

    Measure Business Value

    A BI strategy needs measures that connect analytics to business results. Dashboard counts offer little proof of value. Better measures include decision cycle time, forecast accuracy, data quality, use of approved metrics, time to insight, manual report hours removed, AI answer accuracy, and financial or operational results. A mature BI program shows a clear chain from trusted data to a metric, from the metric to a decision, from the decision to an action, and from the action to a measurable result.

    Build a Decision-Centered BI Model

    The modern BI model goes beyond reports and dashboards. A stronger structure connects business goals with decisions, governed metrics, semantic models, trusted data, AI tools, and measurable outcomes. Real-time data adds value when decision speed matters, and embedded analytics places useful insights inside daily business workflows. The latest research points to one clear lesson: AI can expand the reach of analytics, but trusted data and clear business definitions remain the foundation. A strong BI strategy gains value when technology serves specific business decisions and each major insight has a clear path to action.

    Frequently Asked Questions

    1. What is Business Intelligence strategy?
    Business Intelligence strategy is a structured approach that connects business goals, trusted data, analytics, technology, and decision-making.

    2. Why does data quality matter in BI?
    Poor data can create inaccurate reports, forecasts, and AI results, while reliable data supports better analysis and stronger decisions.

    3. What is a semantic layer in BI?
    A semantic layer creates shared definitions, relationships, rules, and metrics so different teams can work with consistent business information.

    4. How does AI affect Business Intelligence?
    AI can help analyze data, answer questions, explain trends, create measures, and support analytical workflows, but strong governance and reliable data remain essential.

    5. How can companies measure BI success?
    Companies can assess decision speed, forecast accuracy, data quality, time to insight, AI accuracy, report efficiency, and measurable financial or operational results.


  • Data Analytics Bootcamp: Build Job-Ready Skills and Boost Your Salary in 2026

    Data Analytics Bootcamp: Build Job-Ready Skills and Boost Your Salary in 2026

    Why Data Analytics Bootcamps Are on the Rise

    Data analytics has become one of the fastest-growing career fields, driven by companies across banking, healthcare, retail, and tech that rely on data for decision-making. A data analytics bootcamp offers a fast, structured path to gain skills like Python, SQL, Excel, and Tableau—often in 12 to 24 weeks, compared to years in a traditional degree program. For career changers and recent graduates, these programs have emerged as a practical bridge into a high-demand profession.

    What You Actually Learn in a Bootcamp

    Most bootcamps center their curriculum on core tools: Python for programming, SQL for database queries, Excel for analysis, and Tableau for visualization. Alongside these, students develop skills in data cleaning, trend identification, and clear communication of insights. Programs typically run 12–24 weeks, with 18 weeks being the sweet spot between depth and speed. Hands-on projects and a final capstone assignment build a portfolio that employers can review immediately after graduation. This project-based approach often stands out more than a transcript to hiring managers.

    Job Placement and Salary Outcomes

    Verified bootcamp trackers report an average job placement rate of about 79% within six months, with top programs hitting 85–89%. Career changers frequently see a median salary increase of roughly USD 35,000. Entry-level data analysts typically start in the USD 65,000–85,000 range, varying by location and industry. Common first roles include reporting analyst, insights analyst, and product analyst, while specialized roles like data engineering can surpass USD 100,000 with experience.

    How to Choose the Right Bootcamp

    Not every bootcamp fits every learner. Key factors to compare include program cost (free income-share agreements to USD 15,000+), mentorship availability, job guarantees, and partnerships with hiring companies. Online and hybrid formats now dominate, making it easier for working professionals to enroll without leaving their current job. Look for programs with live mentorship and transparent placement statistics.

    Why This Career Path Matters Right Now

    Unlike some tech roles facing automation pressure, data analysis work continues to grow as organizations collect more data and need skilled interpreters. A bootcamp offers a shorter, more affordable route into a well-paying career that spans industries from healthcare to finance to e-commerce. With strong placement rates and flexible formats, these programs provide a genuine opportunity to pivot without spending years in a classroom.

    Frequently Asked Questions

    What skills does a data analytics bootcamp teach?

    Most bootcamps cover Python, SQL, Excel, and Tableau, along with data cleaning, trend identification, and data communication. Students complete hands-on projects and a capstone for their portfolio.

    How long does a bootcamp take?

    Programs run 12 to 24 weeks, with 18 weeks being the most common length for balancing depth and speed.

    What salary can I expect after completing a bootcamp?

    Entry-level analysts start at USD 65,000–85,000; career changers often see a median increase of USD 35,000.

    What jobs can I get after a bootcamp?

    Common entry points include reporting analyst, insights analyst, and product analyst. With experience, roles like data engineering pay over USD 100,000.

    Are bootcamps worth the cost?

    Costs range from free to over USD 15,000. Given placement rates up to 89% and strong salary growth, many find the investment worthwhile if the program offers solid mentorship and hiring support.

  • Time Series Analysis Explained: Methods, Real-World Examples, and Key Applications

    Time Series Analysis Explained: Methods, Real-World Examples, and Key Applications

    Time series analysis helps businesses understand how data evolves over time. By examining trends, seasonal patterns, and other changes, analysts uncover useful insights and make more accurate forecasts.

    Overview

    • Time series analysis studies data collected over a period of time.
    • Trends, seasonality, cycles, and random changes are the main components of time series data.
    • Methods such as moving averages, exponential smoothing, and ARIMA help analysts examine past data.
    • Time series analysis is used in sales, finance, healthcare, weather, energy, and technology.

    Time series analysis goes beyond turning old numbers into charts. These methods help various sectors understand the changes they have experienced over a specific period. Businesses can study pattern shifts, identify causes, and take appropriate action. In simple terms, time series analysis involves studying data collected over time. The data can be recorded every minute, hour, day, week, month, or year. Analysts look for patterns to understand what has happened and, in some cases, estimate what might happen next. However, it’s important to note that a forecast is never a guarantee. A sudden event can alter demand, prices, traffic, or customer behavior. Good analysis must account for uncertainty and continuously check new data. The goal is not merely to predict the next number but to understand the movement behind the numbers. When used properly, time series analysis can transform years of data into actionable information for today’s decisions and tomorrow’s plans. For businesses, this aids planning. For example, a retailer can study historical sales data before deciding how much stock to order. Similarly, a streaming service can analyze viewing data to understand audience habits before a major show release. The principle is simple: the past cannot tell us everything about the future, but it can offer valuable insight.

    Understanding the Main Parts of Time Series Data

    A time series can contain several types of movement. Knowing each one makes the data easier to interpret. The first is trend. A trend shows the general direction of data over a longer period. For instance, a smartphone company may see monthly sales fluctuate, but when looking at five years of data, it may observe steady growth. Short-term changes matter, but the larger trend provides a better view of growth. The second is seasonality. This refers to patterns that repeat at fixed times. For example, during festive seasons, online stores often experience order surges, and travel companies see booking increases during holidays. Ice cream sales rise during summer months. These patterns repeat annually as seasons arrive. Cycles are another component. They can resemble seasonal patterns but do not follow a fixed schedule. Economic booms and recessions are common examples. Demand may rise during strong economic periods and fall during slowdowns. Finally, random changes occur. Not every data movement has a clear reason. A sudden news event, supply issue, product launch, or natural disaster can cause unexpected shifts.

    Common Time Series Methods and Real-Life Applications

    Once data is prepared, analysts choose a method based on their analysis goals. One simplest method is the moving average. It calculates the average of a fixed number of recent values and moves forward as new data arrives. For example, a retailer might use a seven-day moving average to study daily sales. An unusually busy Saturday may spike sales, but the moving average smooths out these daily jumps, making the wider trend clearer. Another useful method is exponential smoothing, which assigns greater weight to recent data while still incorporating older numbers. Recent changes thus have a stronger impact on the result. A retailer could use this to estimate product demand: if phone sales have increased in recent weeks, those recent numbers influence the forecast more. More advanced methods include ARIMA, which uses past values and past changes in data to make forecasts. It is applied in areas such as sales, economic data, and demand planning. Machine learning has also become part of modern forecasting. AI models handle large datasets and consider multiple factors simultaneously. Some businesses use these tools to forecast demand, website traffic, energy usage, and customer activity. Time series analysis is widely applicable in real-life scenarios. In finance, it helps understand stock prices, interest rates, and trading activities. Analysts identify patterns from past data, though unpredictable events can alter outcomes. In healthcare, time series analysis helps hospitals study patient numbers over time. If cases rise continuously, hospital authorities can plan staffing accordingly. In the energy sector, electricity companies use these methods to track power consumption across hours and seasons, preparing for periods of high demand.

    Frequently Asked Questions

    What is time series analysis?
    Time series analysis is the study of data collected over time. It helps identify trends, repeated patterns, and changes in data.

    What are the main parts of time series data?
    The main parts are trend, seasonality, cycles, and random changes. Together, they explain how data moves over time.

    What is time series forecasting?
    Time series forecasting uses past data to estimate future outcomes. Businesses use it for sales, demand, traffic, and other areas.

    Where is time series analysis used?
    It is used in finance, healthcare, retail, energy, weather forecasting, technology, and many other fields.

    What are common time series analysis methods?
    Common methods include moving averages, exponential smoothing, and ARIMA. Machine learning is also used for more complex forecasting tasks.

  • How Amrita Online’s MBA in Artificial Intelligence Creates Data-Driven Leaders

    How Amrita Online’s MBA in Artificial Intelligence Creates Data-Driven Leaders

    Why Data-Driven Leadership Is the New MBA Baseline

    Business decisions today rarely happen without a dashboard, a model, or a forecast behind them. Organizations across banking, technology, consulting, and manufacturing are pushing decision-making down to managers who can read data directly instead of waiting for a separate analytics team to translate it. The Online MBA in Artificial Intelligence from Amrita Online is built to answer that shift. Rather than treating AI and analytics as an elective bolt-on to a traditional MBA, the curriculum weaves machine learning, deep learning, and data visualization into core management training, along with a strong emphasis on responsible AI and ethics.

    Inside the AI and Analytics Curriculum

    The program’s applied, tool-based approach starts with foundations such as a first-semester elective on computer systems, then builds into machine learning, deep learning, and natural language processing. This is not AI taught as a business case study to read about; it is AI taught as a set of working techniques students apply directly to business problems.

    Layered onto this technical core is a strong data visualization component, giving students the advanced analytical skills needed to turn raw data into decision-ready insight. The goal is for graduates to lead AI transformation in their organizations, not just understand it from the sidelines.

    Key technical areas covered include:

    • Programming and computer systems foundations
    • Machine learning and deep learning techniques
    • Natural language processing for unstructured data
    • Business intelligence-style data visualization for communicating results

    Capstone-Style Projects: Where Tools Meet Business

    Technical tools only build career-ready leaders when applied to real business problems. That is where the program’s project-based structure comes in. The curriculum combines videos, case studies, and projects developed by faculty and industry leaders, giving students applied, capstone-style assignments rather than purely theoretical coursework.

    The semester structure opens with foundational management subjects such as Fundamentals of Management and Organizational Behaviour, Human Resources and Organizational Development, and Marketing and Consumer Behaviour. Students then apply AI and analytics tools inside real management contexts, from HR analytics to marketing forecasting to operational decision-making.

    Measurable Career Outcomes and Placement Support

    Amrita Online is the online learning division of Amrita Vishwa Vidyapeetham, ranked 8th by India’s National Institutional Ranking Framework (NIRF 2025). The program reports an average salary growth of 33.94 percent among recent Online MBA graduates, based on a graduate survey.

    Beyond the classroom, students receive mentorship from industry experts, soft skills and aptitude training, resume building, and mock interviews. Placement assistance connects graduates with hiring partners including Honeywell, HDFC Bank, Amazon, Deloitte, Philips, BNY Mellon, Apple, Grant Thornton, and Exide.

    Program at a Glance

    • Duration: Minimum 2 years, extendable up to 4 years, across 4 semesters
    • Accreditation: UGC-recognized and AICTE-approved; NIRF rank #8 in India
    • Quality: NAAC A++ accredited, values-driven institution
    • Outcomes: Alumni report an average 33.94% salary growth
    • Global Credibility: WES-recognized credentials with study abroad pathways at premier US and European universities
    • Startup Ecosystem: Access to Amrita TBI, recipient of the National Award for Best Startup Incubator (2017)
    • Community: Learners across more than 50 countries and 28 Indian states

    Eligibility Criteria

    • A minimum of 50 percent marks in undergraduate studies
    • Completion of 10+2
    • An undergraduate degree of at least three years
    • Final-year students may apply with their last completed semester results
    • Work experience is an added advantage, reflecting the program’s design for working professionals

    Fees and Payment Options

    For Indian students: The total tuition fee for the Online MBA in Artificial Intelligence is Rs. 2,44,000, split as Rs. 61,000 per semester across four semesters. Paying the full one-year fee upfront brings a 5 percent discount, reducing the one-year fee to Rs. 1,15,900. A zero-cost EMI option is available at Rs. 10,625 per month.

    For foreign nationals: The semester fee is Rs. 73,000, with a discounted one-year fee of Rs. 1,38,700 and a total tuition fee of Rs. 2,92,000. All students additionally pay a registration fee of Rs. 700 and an examination fee of Rs. 2,750 per semester.

    Global Exposure Alongside the Technical Curriculum

    Students can access international exposure through Amrita’s global university partnerships, including Oakland University, University of New Mexico, Institut Mines-Télécom, and the University of Barcelona. Opportunities include student exchange programs, study abroad semesters, and summer programs, often without paying tuition fees at the host university.

    Same Degree, Same Recognition

    The curriculum, faculty, and academic standards for the online program mirror those of the on-campus MBA, with the online mode of study noted only on the back of the certificate. Graduates also join the Amrita alumni network, connecting them with a global community of professionals across industries.

    Is the Amrita Online MBA in AI Worth It?

    For working professionals and graduates who want an MBA that builds real fluency in AI, machine learning, and data visualization rather than just business theory, the program makes a strong, evidence-backed case. The tool-based curriculum, applied project work, and structured placement support are designed to convert technical fluency into measurable career growth. For entrepreneurs and professionals seeking flexibility without sacrificing institutional prestige, Amrita’s NAAC A++ grade and NIRF ranking add credibility.

    Note: Fees, deadlines, and program details can change. Confirm the latest information directly on the official Amrita Online website before applying.

  • SQL or Python? 7 Essential Differences Every Data Analyst Needs to Know

    SQL or Python? 7 Essential Differences Every Data Analyst Needs to Know

    SQL and Python are two of the most valuable tools in a data analyst’s toolkit. They solve different problems, and knowing where each excels can make your analysis faster, more accurate, and more efficient. This guide breaks down seven core differences between SQL and Python to help you choose the right tool for the right task.

    1. Core Purpose

    SQL is built specifically for working with structured data stored in relational databases. It helps analysts retrieve, filter, sort, and combine large datasets with precision. Python, on the other hand, is a general-purpose programming language that goes far beyond data queries—it handles data cleaning, automation, statistical analysis, machine learning, and visualization.

    2. Database Strengths

    When your data lives in a database, SQL is the natural starting point. You can query millions of records directly without moving the entire dataset elsewhere. Python can also interact with databases, but it shines after the data has been extracted, when deeper processing is needed.

    3. Beyond Queries

    SQL specializes in data retrieval and manipulation. Python, however, opens the door to advanced analytics and automation. Libraries such as pandas, NumPy, Matplotlib, and scikit-learn allow analysts to transform data, build predictive models, and create rich visualizations—all in one environment.

    4. Learning Curve

    SQL has a relatively straightforward syntax for common analytical tasks. Beginners can quickly pick up commands like SELECT, WHERE, GROUP BY, and JOIN to start exploring business data. Python requires understanding broader programming concepts such as variables, functions, loops, and library management, making the learning curve steeper. Yet that extra effort pays off as analytical challenges become more complex.

    5. Data Retrieval vs. Deeper Analysis

    SQL’s biggest strength lies in accessing and transforming database data. It answers questions like: Which products sold the most? Which customers spent the most? How did performance change over time? Python becomes especially useful when you need statistical modeling, predictive analytics, or automation—tasks that go beyond simple queries.

    6. Tooling and Libraries

    SQL is a query language with a focused ecosystem. Python offers a vast collection of libraries and frameworks for every stage of the data workflow, from data manipulation (pandas, NumPy) to visualization (Matplotlib, Seaborn) and machine learning (scikit-learn, TensorFlow). This makes Python a more flexible, all-in-one platform for end-to-end analysis.

    7. Integration and Flexibility

    SQL is generally confined to database operations. Python, meanwhile, can connect with APIs, files, other databases, and machine-learning frameworks. This flexibility means Python can automate entire pipelines, pull data from multiple sources, and deliver production-ready models—something SQL alone cannot do.

    Final Thoughts

    Both SQL and Python are essential for modern data analysis. SQL is your go-to for efficient database querying, while Python enables deeper analysis, automation, and machine learning. By mastering both tools, you can work smarter and handle a broader range of analytical challenges.

  • Leverage AI to Transform Instagram Insights Into a 30-Day Content Calendar

    Leverage AI to Transform Instagram Insights Into a 30-Day Content Calendar

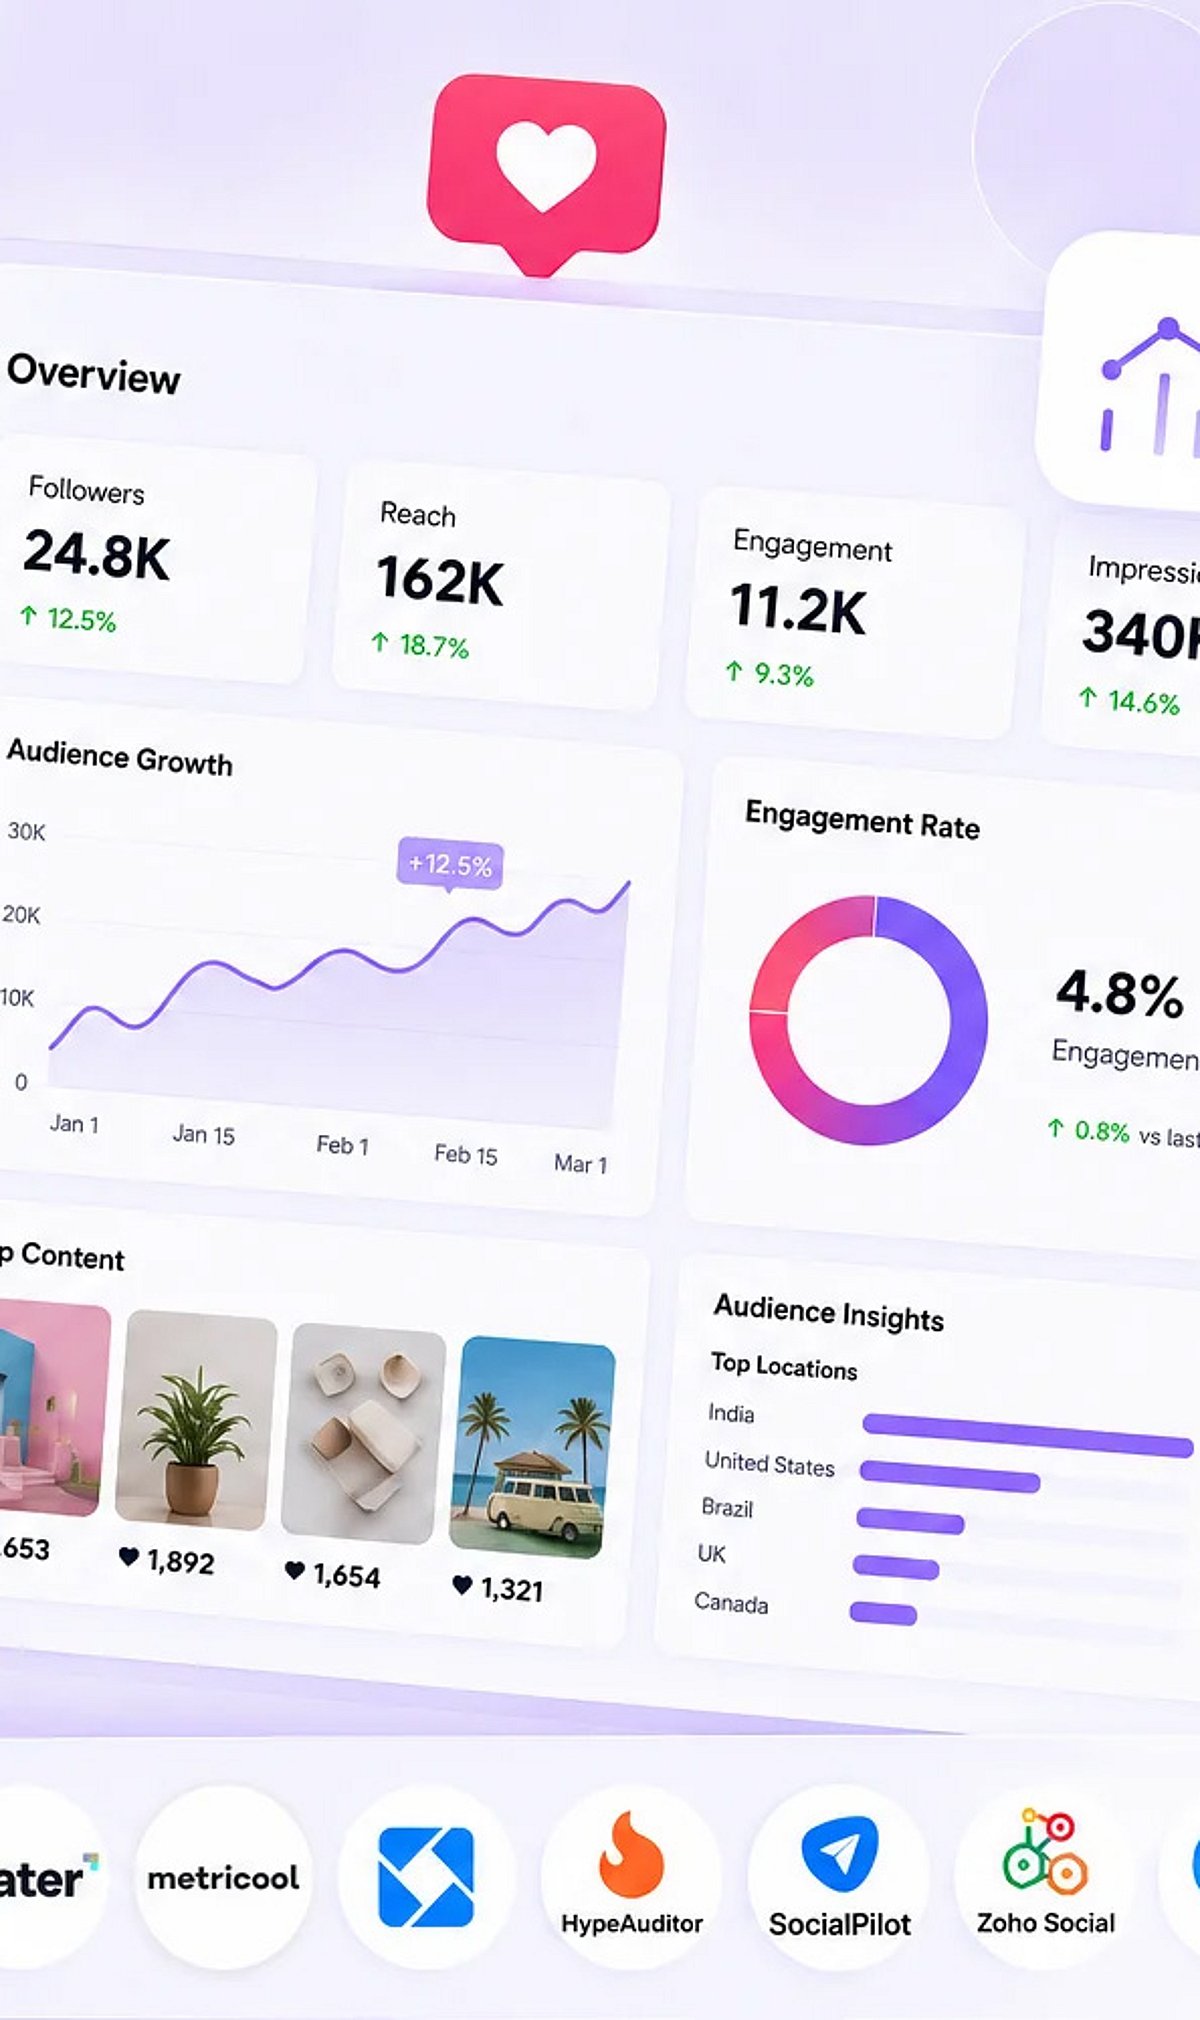
    Instagram Insights holds a wealth of data about your audience and content performance. By applying artificial intelligence, you can turn these raw numbers into a structured, month-long content plan that drives engagement and growth. Here’s how AI can help you every step of the way.

    Start With Instagram Insights

    AI reviews your Instagram Insights to identify top-performing posts, audience activity patterns, engagement trends, and preferred content formats before building a monthly plan.

    Find Your Best Content

    Using AI, you can spot your highest-performing Reels, Stories, carousels, and images. This allows you to create more of the content your audience already loves, consistently.

    Understand Audience Behavior

    AI studies audience demographics, active hours, interests, and engagement trends to recommend the optimal posting schedule for each week.

    Discover Winning Topics

    By analyzing recurring themes from successful posts, AI helps you build content around proven ideas instead of guessing what might work.

    Plan Content Variety

    AI balances educational, promotional, entertaining, and community-focused posts. This ensures your 30-day calendar stays fresh and engaging throughout the month.

    Suggest Captions and Hashtags

    AI generates captions, hashtags, and calls to action that match your audience. This saves time while improving visibility and interaction on every post.

    Predict Strong Posting Times

    Using historical engagement data, AI recommends ideal publishing times to increase reach, impressions, and overall audience engagement daily.

    Track Performance Weekly

    AI measures weekly performance, compares results, and adjusts upcoming content recommendations to improve engagement across the remaining monthly schedule.

    Build a Smarter Monthly Strategy

    With AI and Instagram Insights working together, creators can confidently follow a structured 30-day content plan that grows engagement and consistency. Start turning your data into a winning strategy today.

  • 6 Best AI Agents for Data Analytics and Business Intelligence in 2026

    6 Best AI Agents for Data Analytics and Business Intelligence in 2026

    Business intelligence (BI) has evolved far beyond static dashboards and manual reports. In 2026, AI agents are transforming how organizations interact with data—automating reporting, generating insights, and enabling faster, smarter decision-making. These tools can monitor key metrics, write SQL queries, explain trends, detect anomalies, and recommend actions, all through natural language interactions.

    Here are six standout AI agents that leading enterprises and growing startups are adopting this year.

    1. Microsoft Power BI Copilot

    Microsoft Power BI Copilot integrates AI directly into the company’s BI platform. Users can ask questions in plain English, generate reports, create DAX formulas, and summarize dashboards without manual effort. Its tight integration with Microsoft Fabric, Excel, and Teams makes it a practical choice for organizations already using the Microsoft ecosystem.

    2. ThoughtSpot Sage

    ThoughtSpot Sage is built around search-driven analytics. Users simply type business questions and receive charts, explanations, and follow-up insights. The platform identifies unusual trends and suggests additional areas to explore, making it popular with sales, finance, and marketing teams that need quick answers without relying on technical experts.

    3. Databricks AI/BI Genie

    Databricks AI/BI Genie is designed for organizations with large data volumes. The application converts human language into SQL code, enabling users to analyze data without writing any code themselves. Built on the Databricks Lakehouse platform, it provides a seamless experience for data-heavy workflows.

    4. Tableau Agent

    Tableau has extended its visual analytics platform with AI-based assistance. Tableau Agent helps users create dashboards faster, summarize reports, and explain trends using natural language. The visualization process becomes quicker without compromising Tableau’s rich analytical capabilities.

    5. Google Looker AI

    Google Looker AI combines business intelligence with Gemini-powered AI. Users can query enterprise data conversationally while working within a governed semantic model, ensuring consistent metrics across teams. It is especially useful for organizations already relying on Google Cloud for data storage and analytics.

    6. Tellius AI

    Tellius AI focuses on finding answers rather than just displaying data. It investigates changes in business performance, identifies likely causes, and highlights the factors driving results. The platform also delivers predictive insights, helping decision-makers respond to issues before they affect business outcomes.

    Final Thoughts

    The biggest shift in business intelligence in 2026 is the move from AI assistants to AI agents. These platforms do more than generate reports—they analyze data, investigate anomalies, and surface insights with minimal user input. Whether it’s Power BI Copilot for enterprise reporting, ThoughtSpot Sage for self-service analytics, or Tellius AI for automated investigations, businesses now have tools that make data analysis faster, more accessible, and more actionable.