Tag: Data & Analytics

  • Your Complete Data Analytics Cheat Sheet: Excel, SQL, Python, and Power BI

    Your Complete Data Analytics Cheat Sheet: Excel, SQL, Python, and Power BI

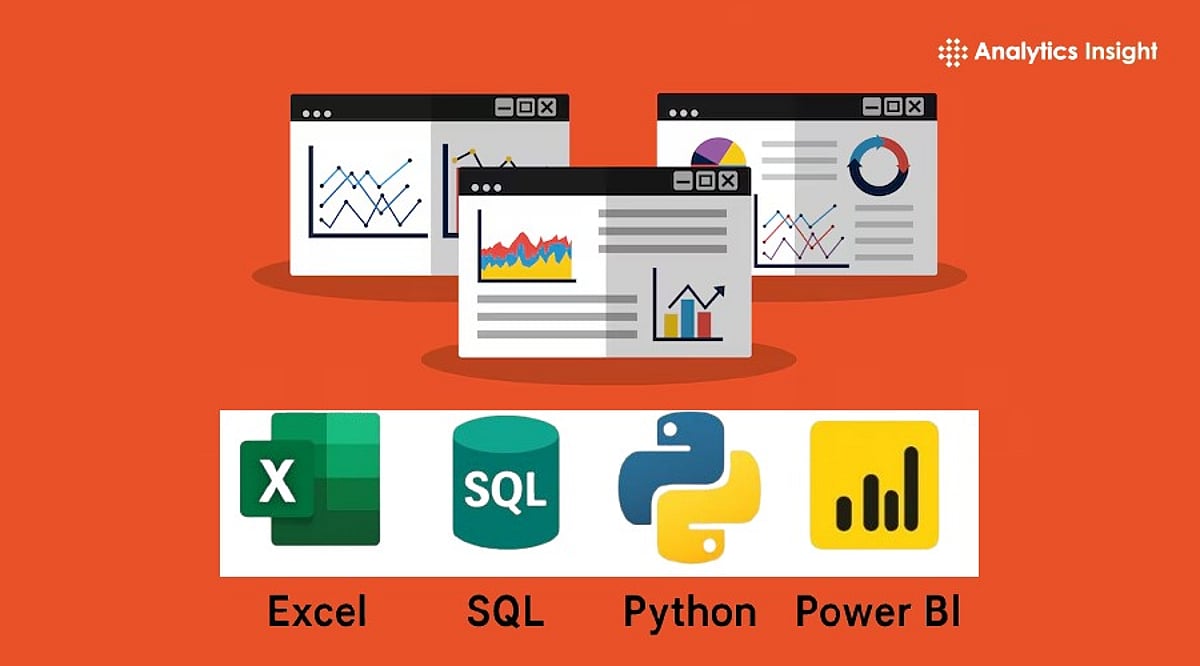
    Data analytics is the process of examining data to uncover useful insights. Every organization collects vast amounts of information daily—sales figures, customer feedback, website traffic, and growth metrics. Companies leverage this data to make smarter decisions and plan ahead. Mastering data analytics is a highly sought-after skill, and employers increasingly value professionals who can work across multiple tools. The four most popular tools in this domain are Excel, SQL, Python, and Power BI. Each serves a distinct purpose: Excel handles calculations and reporting; SQL retrieves data from databases; Power BI transforms data into visual dashboards; and Python manages large datasets and complex analyses. This guide provides a concise cheat sheet covering essential formulas, commands, and functions for these tools.

    Excel Cheat Sheet

    Excel remains a staple for everyday data analysis due to its simplicity and versatility. It is widely used for creating reports, analyzing numbers, and organizing information. Key formulas include SUM, AVERAGE, COUNT, MIN, and MAX for basic calculations; IF for conditional logic; XLOOKUP and VLOOKUP for searching large tables; and INDEX and MATCH for advanced lookups. Essential features include Pivot Tables to summarize data, Conditional Formatting to highlight key values, Power Query for data cleaning, and Data Validation to prevent input errors. Industry surveys indicate that over 75% of data professionals still use Excel daily.

    SQL Cheat Sheet

    SQL (Structured Query Language) is the standard for working with relational databases. Most businesses store critical data in databases, and SQL enables quick and efficient retrieval. Core commands include SELECT, FROM, WHERE, ORDER BY, GROUP BY, HAVING, DISTINCT, and LIMIT. Joins are crucial: INNER JOIN returns matching records; LEFT JOIN returns all records from the left table; RIGHT JOIN returns all from the right; and FULL OUTER JOIN returns all from both. Advanced features include Common Table Expressions (CTEs), CASE statements, subqueries, window functions (ROW_NUMBER, RANK, DENSE_RANK, LEAD, LAG). SQL remains indispensable because most business data resides in databases.

    Python Cheat Sheet

    Python is a powerful programming language for data analysis, valued for its readability and extensive library ecosystem. The top five libraries are Pandas (data manipulation), NumPy (numerical operations), Matplotlib and Plotly (visualization), and Scikit-learn (machine learning). Key Pandas commands include read_csv(), head(), info(), describe(), shape, columns, groupby(), merge(), sort_values(), drop_duplicates(), and fillna(). Python excels at data cleansing, automation, statistical analysis, and building AI models.

    Power BI Cheat Sheet

    Power BI, a Microsoft business intelligence tool, converts raw data into interactive charts, reports, and dashboards. Core components include Power Query (data preparation), Data Model (table relationships), DAX (formulas), Visualizations (charts), Dashboards, and Power BI Service (cloud sharing). Common chart types are bar, line, column, pie, maps, KPI cards, matrix tables, and slicers. According to Microsoft, Power BI is used by over 375,000 organizations and has more than 30 million monthly active users, reflecting its widespread adoption.

    Latest Trends in Data Analytics

    Data analytics continues to evolve with emerging technologies. Artificial intelligence accelerates analysis, enabling tools to answer business questions via natural language instead of code. Cloud technology facilitates storage and processing of massive datasets. Real-time reporting is increasingly common as organizations demand up-to-the-minute insights. Enhanced data security and self-service analytics are also top priorities. Industry experts highlight AI-powered analytics, robust data governance, and accessible business intelligence as the biggest current trends.

    Final Thoughts

    A comprehensive data analytics cheat sheet saves time and streamlines workflows. Excel handles numerical tasks and reporting; SQL retrieves database information; Python manages large-scale and advanced analysis; Power BI creates clear visual dashboards. Together, these four tools cover every essential aspect of data analytics. Mastering them builds a solid foundation for a successful career in today’s data-driven world.

    Frequently Asked Questions

    1. What is a data analytics cheat sheet? A quick reference guide summarizing important formulas, commands, and functions for popular analytics tools.
    2. Why is Excel important for data analytics? It helps organize data, perform calculations, create reports, and identify trends using simple formulas and built-in features.
    3. Why should SQL be part of data analytics skills? SQL enables access, filtering, and analysis of data stored in databases, which most businesses rely on daily.
    4. What is Python used for in data analytics? Python is used for data cleaning, task automation, visualization, statistical analysis, and building machine learning models.
    5. Why do companies use Power BI? Power BI transforms raw data into clear dashboards and reports, helping businesses understand information and make better decisions.
  • How AI and Data Analytics Are Reinventing Sleep Apnea Care

    How AI and Data Analytics Are Reinventing Sleep Apnea Care

    Roughly one billion people worldwide are estimated to live with obstructive sleep apnea, and a large share of them don’t know it. For those who do get diagnosed and treated, the experience of managing the condition looks nothing like it did a decade ago. Sleep medicine has quietly become one of the more compelling case studies in applied health data analytics, and the transformation offers a useful window into how AI is reshaping at-home healthcare more broadly.

    What was once a field defined by overnight lab studies, tangled wires, and manual chart review by a technician is now being reshaped by connected devices, real-time data streams, and machine learning models that can detect and respond to breathing irregularities as they happen. For an industry historically plagued by poor patient adherence, that shift matters enormously.

    From Overnight Labs to Continuous Data Streams

    For decades, diagnosing sleep apnea meant a night in a clinical sleep lab, wired to sensors, followed by a specialist manually reviewing hours of recorded data the next morning. It was accurate, but slow, expensive, and difficult to scale to the scope of the problem. Today, a growing share of that diagnostic and monitoring work happens at home, generating continuous streams of breathing, oxygen saturation, and movement data that machine learning models can analyze automatically rather than reviewed frame by frame by a human.

    This shift toward continuous, at-home data collection is exactly the kind of trend that tends to accelerate technology adoption once it takes hold. Sleep therapy providers are increasingly building products around it, and patients researching treatment options are now just as likely to compare data features and app connectivity as they are price when shopping for CPAP machines.

    Smarter Machines: AI-Driven Pressure Adjustment

    One of the more significant advances in sleep apnea therapy has been the move from fixed-pressure devices to auto-adjusting systems. Rather than delivering a static level of air pressure all night, modern devices use onboard algorithms to analyze breathing patterns in real time and adjust pressure automatically, responding to changes in sleep position, airway resistance, or apnea events as they occur, often hundreds of times over a single night.

    This is applied machine learning quietly improving a health outcome, one micro-adjustment at a time. These algorithms don’t make headlines, but they meaningfully improve therapy comfort and effectiveness, which in turn improves the single strongest predictor of treatment success: whether a patient actually keeps using the device. It’s also why compliance data, tracked automatically and often synced to a companion app, has become a core feature rather than an afterthought in newer machines.

    6 Ways Data and AI Are Reshaping Sleep Apnea Care

    • Automatic pressure titration. Algorithms adjust air pressure breath by breath, replacing the old model of a fixed setting determined once during a lab visit.
    • Cloud-synced compliance tracking. Machines now upload nightly usage data automatically, giving both patients and clinicians a clear picture of adherence without manual logs.
    • Predictive maintenance alerts. Connected devices can flag filter changes, mask leaks, or performance drift before they become a problem the patient notices on their own.
    • Facial-mapping-informed mask design. Manufacturers use aggregated fit and return data to refine mask shapes, reducing the trial-and-error patients used to face.
    • Remote clinician monitoring. Physicians can review a patient’s therapy data remotely between appointments, catching adherence drop-off or efficacy issues earlier.
    • Personalized therapy recommendations. As more usage data accumulates, some platforms are beginning to surface individualized comfort and setting suggestions rather than generic defaults.

    Personalization Extends to Fit, Not Just Function

    Data-driven design hasn’t stopped at the machine itself. Mask design has undergone a similar transformation, moving away from one-size-fits-most models toward options informed by facial mapping data, materials testing, and patient feedback loops that manufacturers use to refine fit and seal quality. Since mask leaks are one of the most common reasons patients abandon therapy altogether, this kind of iterative, data-informed design has a direct and measurable impact on outcomes.

    Patients today have considerably more choice when selecting a sleep apnea mask, with options tailored to sleep position, facial structure, and comfort preferences. That range of choice is itself a byproduct of manufacturers using real-world usage and return data to identify exactly where older, generic designs were failing patients.

    Why This Matters Beyond Sleep Medicine

    The broader lesson here extends well past sleep apnea treatment. It’s a case study in what happens when a chronic condition management category moves from episodic, clinic-based monitoring to continuous, data-rich, at-home tracking. Adherence goes up, personalization improves, and providers get a feedback loop they never had before. Similar shifts are playing out across diabetes management, cardiac monitoring, and remote patient care generally, all built on the same underlying pattern: more granular data, analyzed continuously, feeding back into better-designed devices and more responsive care.

    Sleep therapy providers navigating this shift are having to think less like traditional medical equipment suppliers and more like connected health companies. Local providers such as Rockingham CPAP reflect that broader trend, offering the newer generation of data-enabled machines and masks alongside the fitting and support services that continuous, at-home therapy increasingly depends on.

    Looking Ahead

    As wearable sensors get cheaper and machine learning models get better at parsing noisy, real-world physiological data, the line between “medical device” and “connected health platform” will keep blurring, in sleep medicine and well beyond it. For an industry that has spent decades trying to solve a stubbornly low patient adherence problem, that shift, driven by better data rather than dramatic new hardware, may end up being the more consequential story of the next few years.

  • Top Data Analytics Tools for Social Media Marketing in 2025

    Top Data Analytics Tools for Social Media Marketing in 2025

    Data analytics has become indispensable for social media marketing. By leveraging the right tools, businesses can track performance, understand audience behavior, and optimize campaigns for better ROI. Below is a curated list of the best data analytics applications for social media, each offering unique features to help marketers succeed.

    Google Analytics

    Tracks website traffic originating from social platforms, helping marketers understand user behavior, conversions, and campaign effectiveness across multiple digital channels.

    Sprout Social

    Provides audience analytics, engagement tracking, publishing tools, and detailed performance reports for managing multiple social media accounts efficiently.

    Hootsuite Analytics

    Monitors campaign performance, audience growth, content engagement, and competitor activity using customizable dashboards and comprehensive reporting capabilities.

    Buffer Analyze

    Measures post performance, audience engagement, and content effectiveness while offering actionable insights for improving future social media strategies consistently.

    Brandwatch

    Delivers advanced social listening, sentiment analysis, trend monitoring, and consumer intelligence for brands seeking deeper market understanding and reputation management.

    Talkwalker

    Uses AI-powered analytics to monitor conversations, identify trends, analyze brand sentiment, and evaluate campaign performance across numerous social platforms.

    Keyhole

    Tracks hashtags, influencers, campaign reach, and engagement metrics, making it valuable for social media marketing and influencer performance evaluation.

    HubSpot Analytics

    Combines CRM data with social media performance, enabling businesses to measure lead generation, customer engagement, and marketing ROI effectively.

    Zoho Social

    Offers detailed analytics, publishing, audience monitoring, and collaboration features for businesses managing multiple social media channels from one platform.

    These tools empower marketers to make data-driven decisions, improve engagement, and maximize the impact of their social media efforts. For more insights, join our WhatsApp Channel to get the latest news, exclusives, and videos.

  • How Data Analytics Reveals Hidden Infrastructure Risks: Paulson Geo Philip’s Approach

    How Data Analytics Reveals Hidden Infrastructure Risks: Paulson Geo Philip’s Approach

    An experienced project manager outlines three ways to identify risks before they impact critical infrastructure operations. As data volumes surge, organizations struggle to act on insights—65% of teams still make decisions without leveraging available data, according to the Sisense State of Analytics report. The question is: how can organizations turn information into a tool for risk management and operational reliability?

    Paulson Geo Philip, a Project & Maintenance Manager at UAE Television & Radio (Channel 4 Group), has tackled this challenge for over 14 years. He has applied analytics-driven approaches to infrastructure initiatives valued at more than AED 120 million, leading teams of over 800 professionals and improving project efficiency and cost performance by nearly one-third. Philip is also an author of multiple scientific publications, an invited evaluator at the AITEX Summit Winter 2026, and a Senior Member of the Institute of Electrical and Electronics Engineers.

    Philip believes that the most important project risks reveal themselves through patterns. “I have learned to look at information as a connected system,” he explains. “The most valuable insights rarely come from a single metric. They emerge when you understand how different parts of a project influence one another. Analytics helps create that perspective and allows leaders to make decisions with greater confidence.”

    At UAE Television & Radio, Philip oversaw infrastructure projects worth over AED 120 million, coordinating multidisciplinary teams of engineers, contractors, and technical specialists. His analytics-driven approach helped major infrastructure projects move faster and operate more efficiently, improving schedule performance and reducing costs by 20–30%.

    The role of the infrastructure project leader is evolving beyond managing schedules and budgets. Today’s leaders are expected to make sense of growing volumes of information and translate it into better operational decisions. Another key issue is the high cost of unplanned equipment and infrastructure failures. As infrastructure assets become more connected, maintenance is evolving into a data-driven discipline. Operational data can reveal how equipment performance changes over time, allowing organizations to improve asset utilization, extend service life, and make more informed maintenance decisions.

    Drawing on his experience, Philip has explored these questions through publications. In The American Journal of Engineering and Technology, he introduced concepts such as a Multi-Layer Cognitive Energy Twin and an Adaptive Predictive Resilience Index to forecast system conditions and evaluate infrastructure resilience. In his paper “Artificial Intelligence and Machine Learning Applications in Project Schedule Forecasting” (Earth Science Research Network, SSRN), Philip presented a predictive framework to identify schedule risks before they affect project outcomes.

    “Today, more and more organizations view operational data not as a record of past performance, but as a tool for forecasting future conditions,” notes Philip. “That shift from reactive management to predictive management is becoming one of the defining trends across infrastructure and operations.”

    Philip also served on the judging panel at the AITEX Summit Winter 2026, an international forum for artificial intelligence, digital technologies, innovation, and sustainable development. He holds Senior Member status in the IEEE. “I would encourage organizations to create more opportunities for collaboration between practitioners, researchers, and technology specialists,” he says. “Some of the best ideas I have come across were developed by people working in very different fields.”

    Looking ahead, Philip sees analytics becoming an increasingly important part of how organizations manage risk and reliability. His experience points to three priorities: recognizing patterns before problems escalate, using data to anticipate future conditions, and carefully evaluating the technologies that guide operational decisions. Together, these capabilities transform information from a byproduct of operations into a tool for managing reliability and performance.

  • Predictive Targeting: How Data Informata Finds Customers Before They Search

    Predictive Targeting: How Data Informata Finds Customers Before They Search

    Most advertising waits for customers to raise their hands. They sit on platforms, hoping the right person wanders by. By the time someone searches for a product, they’ve already seen three or four competitors. Phil Anderson’s Data Informata has built a system that flips the timing: it finds the customer before the customer goes looking.

    The core challenge is that the entire advertising industry is designed to compete for people who are already shopping. Every platform auctions off the same hand-raisers, driving up costs and diluting impact. Data Informata asks a different question: instead of who’s searching right now, who’s about to?

    How the System Works

    Data Informata’s targeting infrastructure identifies IP addresses of consumers showing specific behavioral signals – searching relevant keywords, visiting physical locations that indicate purchase intent, or engaging with related content. It then matches those signals to all devices within a household: phones, laptops, tablets. This continuous household-level tracking ensures the advertising narrative follows the buying journey across screens and across family members who influence decisions.

    By the time the consumer types a search, they’ve already been exposed to a tailored message. The system doesn’t wait for the auction; it gets in front of the person while they’re still forming the decision.

    Cultural Intelligence in Creative

    Finding the right person is only half the battle. Data Informata also adapts the creative itself – colors, fonts, design elements shift based on cultural and demographic data. A generic ad that looks the same to everyone often signals ‘not for me’ to most audiences. Calibrated creative builds immediate trust. ‘Color is not decoration. Color is a signal,’ Anderson explains. The system handles this at scale, serving a version shaped for each household’s context.

    Real‑World Proof

    The most compelling test came from a single‑location Thai restaurant on a limited budget. Data Informata identified local households showing dining‑out signals, matched them across devices, and served neighborhood‑calibrated creative. Sales jumped 38% in 24 hours. The result demonstrated that the technology works end‑to‑end on a real business, not just enterprise campaigns.

    Anticipatory vs. Reactive

    Standard programmatic advertising is reactive – it waits for declared intent and then bids for an impression. Data Informata is anticipatory: it reads pre‑intent signals and reaches the consumer before the search. ‘We’re not interested in the line. We want to be the first name the customer ever associates with the thing they’re about to buy,’ says Anderson. That head start compounds, because the first brand encountered shapes how every subsequent competitor is judged.

    The Competitive Advantage

    The system was built in partnership with Los Angeles developers who worked on the underlying advertising infrastructure. This deep engineering knowledge allows Data Informata to operate beneath the dashboards that limit most agencies. ‘There’s a difference between knowing how to drive the car and knowing how the engine was built,’ Anderson notes. This foundational expertise is difficult to replicate and provides a durable edge.

    Conclusion

    Data Informata’s core belief is that the data already contains the answer. Signals about who will buy, what they will respond to, and where to reach them exist today. Companies that read those signals early win; those that wait to react pay to compete in a crowded auction. The system is proven at small scales – a single Thai restaurant – and is ready for larger deployment. It shifts the advertising paradigm from waiting for the hand to go up to finding the customer first.

  • Best Hadoop Platforms for Big Data in 2026: Vendors, AI Integration, and Cloud Flexibility

    Best Hadoop Platforms for Big Data in 2026: Vendors, AI Integration, and Cloud Flexibility

    As organizations race to harness artificial intelligence, predictive analytics, and real-time insights, managing large volumes of data has become more critical than ever. While cloud-native platforms have transformed the data landscape, Hadoop remains a foundational technology for processing and storing massive datasets. Today’s leading Hadoop vendors offer far more than distributed storage, combining analytics, security, machine learning, and hybrid-cloud capabilities into comprehensive data platforms.

    Leading Hadoop Vendors for 2026

    Cloudera: Enterprise-Grade Hybrid Cloud Platform

    Cloudera remains one of the most reliable brands in the Hadoop market, offering data engineering, analytics, machine learning, and AI services across private, public, and hybrid clouds. Its unified governance architecture helps businesses securely govern data across different environments. Enhanced AI solutions enable building complex models using large datasets, making Cloudera a top choice for enterprises handling complex workloads and compliance needs.

    AWS EMR: Simplified Big Data Processing

    Amazon Web Services Elastic MapReduce (EMR) has gained traction as a popular tool for firms wanting to leverage Hadoop in a managed way. Companies can create and scale workloads in an AWS environment with support for Hadoop, Spark, Hive, HBase, and Presto, handling large volumes of data without difficulty.

    Microsoft Azure HDInsight: Enterprise Analytics Strengthened

    Microsoft Azure HDInsight is a strong option for enterprises already on the Azure platform. It is compatible with Hadoop and Spark clusters, Azure Data Lake, Power BI, and Azure AI. Key advantages include security and governance capabilities, allowing enterprises to set up analytics processes compliant with regulations. Synergy with Microsoft cloud services makes HDInsight attractive for large digital transformation projects.

    Google Cloud: AI-Focused Big Data Platforms

    Google Cloud actively expands its big data services by adding Hadoop capabilities, analytics, and AI. Combined with BigQuery, it enables efficient analysis of large datasets. For custom AI solutions, Google Cloud machine learning services are available. The increasing integration of AI into big data strategies has made Google Cloud popular.

    IBM: Governance and Security at Scale

    IBM provides enterprise data management solutions relying on Hadoop and analytics, well-suited for banking, healthcare, and government sectors due to emphasis on governance, security, and compliance. IBM solutions manage both structured and unstructured data and control information assets. Its hybrid cloud enables infrastructure upgrades without removing legacy solutions. For regulated industries, IBM’s focus on trust and governance is unique.

    Oracle: Connecting Traditional Databases with Big Data

    Oracle positions itself as an intermediate solution between traditional enterprise databases and big data environments. Integration services with Hadoop technology help organizations conduct transactions and analytics simultaneously. Analytic services and data integration enable consistent analysis from different sources, especially for organizations using Oracle applications and databases, streamlining big data work without structural changes.

    Choosing the Right Hadoop Vendor

    The selection of a Hadoop provider depends on the company’s technological context, scalability needs, and data strategies. Hybrid cloud-friendly companies should choose Cloudera. Cloud-based application companies should choose AWS EMR for scalability and ease of use. Companies integrated with Microsoft should go for Azure HDInsight. AI companies should go for Google Cloud. IBM is best for governance situations, while Oracle offers competition due to its database-big data platform integration.

    The Future of Hadoop

    The Hadoop market is now different from 2006. The race no longer lies in storage and processing abilities; vendors are assessed on how well they integrate AI, cloud computing, security, governance, and deployment into their products. Given the large volumes of data businesses generate, those combining scalability with analytics and AI will dominate the big data market.

  • Big Data Insights: Key Trends, Tools, and Industry Impact in 2025-2026

    Analytics Insight’s Big Data section curates essential articles exploring the transformative power of data analytics across industries. From open-source tools to predictive market analysis, these pieces uncover how organizations leverage big data for strategic advantage.

    Top Headlines

    • Best Open-Source Big Data Tools in 2026: A comprehensive guide to the most effective open-source platforms for handling massive datasets.
    • What is Big Data Analytics? (2026 Guide): Explains the meaning, types, tools, and real-world applications of big data analytics.
    • The Growing Role of Big Data in Predictive Market Analysis: How data-driven models forecast market trends with increasing accuracy.
    • Big Data in Telehealth and Remote Diagnostics: Transforming patient care through real-time data processing and remote monitoring.
    • Gartner’s Essential Features for BI Platforms (2025): Key capabilities business intelligence tools must offer in the modern data landscape.
    • Top Free Scala Courses for Big Data (2025): Learning resources for mastering Scala, a language critical for big data frameworks.
    • Drinksworld Uses Big Data for Business Growth: A case study on how data analytics drives strategy in the beverage industry.
    • Big Data Reshaping the Automotive Industry: From autonomous driving to supply chain optimization, data is revolutionizing mobility.
    • Big Data Revolution in Healthcare: Predictive analytics and precision medicine are becoming standard through big data.
    • Top 10 Data Lakes for Big Data Analytics: A detailed overview of leading data lake solutions for scalable analytics.
    • Big Data Analytics Trends to Watch in 2025: Emerging patterns that will define the next wave of data analytics.
    • Why the World Would End Without Data: A thought piece on the catastrophic consequences of a data-less society.

    These articles provide a rich resource for professionals, researchers, and enthusiasts looking to stay ahead in the rapidly evolving world of big data.

  • Jotform AI Transforms Data Collection with Conversational Form Building

    Jotform AI Transforms Data Collection with Conversational Form Building

    Jotform has launched a new conversational AI tool that lets users create, edit, and deploy forms simply by describing what they need — either by typing or speaking. The tool, called Jotform AI, is designed to eliminate manual configuration and speed up form creation.

    Users can go from an idea to a live form in seconds. By describing the desired form through a persistent chat interface in the Jotform Workspace, the AI assistant named Podo generates a fully structured form complete with fields, conditional logic, and design styling. The assistant can also handle editing tasks like renaming fields or adding multi-step conditional logic.

    A companion feature, the Form Copilot, works inside the Form Builder itself. Instead of manually adjusting settings, users can ask the Copilot to reorder questions, add conditional fields, generate scoring calculations, or create notification and autoresponder email workflows.

    Jotform AI includes several exclusive capabilities not commonly found in other form-building tools: AI-generated calculations for scoring, totals, and field calculations; AI-driven notification email generation; AI-generated test submissions; and an AI assistant that answers product questions with guidance across a broader feature set.

    Users can upload spreadsheets or documents and have Jotform AI automatically convert the content into a structured form. Uncommon branding tools allow teams to match form styling to an existing website or brand kit by simply supplying a URL or image file.

    Aytekin Tank, Founder and CEO at Jotform, said: “Jotform AI represents the next stage of our evolution, inspiring people to create any form experience they can imagine, however they like. Jotform has shifted from a traditional form and productivity tool to an intelligent data management platform that executes at the request of a prompt.”

    The practical applications cover industry, team, device, and use types. Adaptive forms with conditional logic can dynamically adjust based on user responses without manual rule configuration. High-volume form testing allows teams to simulate realistic submissions and validate logic before distribution. On-brand styling updates colors, fonts, and backgrounds conversationally. Integrated workflows streamline data to storage, CRM, or management solutions. Mobile-ready creation lets users build forms on the go by talking to the AI or uploading pictures.

    Jotform AI combines end-to-end conversational creation with advanced automation inside an enterprise-ready ecosystem, setting a new bar for form builders.