Tag: interest rates

  • Bitcoin Under Pressure: Rising Oil Prices, High Interest Rates, and Regulatory Uncertainty Weigh on Market

    Bitcoin Under Pressure: Rising Oil Prices, High Interest Rates, and Regulatory Uncertainty Weigh on Market

    Bitcoin is facing a challenging period as rising oil prices fuel inflation concerns, elevated interest rates reduce risk appetite, and ongoing regulatory uncertainty keeps investors cautious. Despite these headwinds, institutional support through spot Bitcoin ETFs continues to provide a long-term foundation for the cryptocurrency.

    Key Takeaways

    • Rising oil prices have renewed inflation fears, increasing pressure on Bitcoin.
    • High interest rates are shifting investor capital toward safer assets.
    • Institutional demand via spot Bitcoin ETFs remains a positive factor for long-term confidence.

    Higher Oil Prices Stoke Inflation Worries

    Bitcoin’s recent weakness is largely tied to the surge in oil prices. Brent crude has climbed back to $100 per barrel amid escalating tensions in the Middle East. Higher oil costs ripple through the economy, raising transportation, manufacturing, and service expenses — costs that are ultimately passed on to consumers. This inflationary environment makes central banks hesitant to cut interest rates, which in turn dampens appetite for riskier assets like Bitcoin.

    Interest Rates Dampen Demand for Cryptocurrencies

    Central banks worldwide have kept borrowing costs high to combat inflation, making government bonds and money market funds more attractive due to their reliable, low-risk returns. Consequently, capital that might have flowed into cryptocurrencies has moved into traditional financial products. Investors are closely monitoring central bank meetings, with many expecting rates to remain elevated if inflation stays above target — especially with oil prices continuing to rise.

    Regulatory Uncertainty Lingers

    Governments around the globe are still crafting new rules for cryptocurrencies, covering taxation, stablecoins, exchange operations, anti-money laundering, and investor protection. While many investors welcome clear regulations — which could boost confidence and attract institutional money — the current uncertainty creates caution. Any major policy announcement can quickly move Bitcoin prices as traders react to the latest developments.

    Market Sentiment Remains Cautious

    Bitcoin has held relatively steady near $66,000, but volatility persists. Trading volumes are lower than in previous bull markets, indicating a wait-and-see stance among many investors. They are unlikely to re-enter the market until inflation slows, interest rates fall, or economic conditions improve. Analysts note that Bitcoin is now more sensitive to macroeconomic data — such as inflation, unemployment, and central bank decisions — than in earlier years.

    Institutional Investors Provide a Buffer

    Despite short-term pressures, institutional demand remains a strong pillar. U.S. spot Bitcoin ETFs have recently reported fresh inflows after periods of withdrawals. These regulated products make it easier for pension funds, wealth managers, and large financial institutions to gain exposure to Bitcoin without directly holding the asset. This steady institutional participation helps support Bitcoin even during uncertain times.

    What’s Next for Bitcoin?

    The coming months will be crucial. Investors will watch central bank decisions, inflation reports, oil market developments, and regulatory updates closely. Continued inflows into spot Bitcoin ETFs could provide additional support. The balance between these positive and negative factors will likely determine Bitcoin’s next major price move.

    Why This Matters

    Bitcoin has become a significant part of the global financial system, so changes in oil prices, interest rates, and government policies now affect millions of investors. Understanding these risks helps investors interpret Bitcoin’s performance and prepare for future market shifts.

    Outlook

    Several factors are currently working against Bitcoin: oil prices above $100, high interest rates limiting risk appetite, and regulatory hurdles. However, institutional adoption via spot Bitcoin ETFs has helped cushion losses from previous shocks. The near-term direction depends on inflation trends, interest rate decisions, oil prices, and regulatory signals.

    Frequently Asked Questions

    1. Why do higher oil prices affect Bitcoin? Higher oil prices can increase inflation, making investors less willing to buy riskier assets like Bitcoin.
    2. How do interest rates impact Bitcoin prices? Higher interest rates make safer investments more attractive, reducing demand for cryptocurrencies.
    3. Is Bitcoin still attracting institutional investors? Yes. Spot Bitcoin ETFs continue to draw institutional investment despite short-term volatility.
    4. Why does regulation matter for Bitcoin? New regulations can affect how cryptocurrencies are traded, taxed, and adopted by financial institutions.
    5. What could help Bitcoin recover? Lower inflation, interest rate cuts, stable oil prices, and greater regulatory clarity could improve market confidence and support Bitcoin prices.
  • MCX Gold Slips 0.48% to ₹1,44,984 as Profit Booking Emerges; Brent Crude Jumps 2.30% to $96.23

    MCX Gold Slips 0.48% to ₹1,44,984 as Profit Booking Emerges; Brent Crude Jumps 2.30% to $96.23

    Gold prices on the Multi Commodity Exchange (MCX) experienced a decline on July 23, driven by profit booking after a 2% surge in the previous session. The retreat comes amid ongoing geopolitical tensions and rising crude oil prices.

    August gold futures fell 0.48% to ₹1,44,984 per 10 grams, while September silver futures dropped 0.40% to ₹2,26,090 per kilogram. Meanwhile, Brent crude futures climbed 2.30% to $96.23 per barrel, and US West Texas Intermediate (WTI) advanced 1.81% to $88.40 per barrel.

    Domestic Gold Prices

    In the Indian market, 24K gold rose by ₹77 to ₹1,47,280 per 10 grams, while 22K gold increased by ₹70 to ₹1,35,000. City-wise prices showed Mumbai and Kolkata at ₹1,47,280, Delhi at ₹1,47,420, and Chennai at ₹1,46,520.

    US Gold Prices

    In the United States, gold prices held steady on Thursday, pulling back from two-week highs reached in the previous session. The escalating Middle East conflict, particularly the US-Iran tensions, continued to push oil prices higher. Spot gold was little changed at $4,132.01 per ounce, while US gold futures for August delivery fell 0.4% to $4,134.60.

    Spot silver gained 0.3% to $59.90 per ounce, platinum rose 0.7% to $1,656.24, and palladium advanced 0.8% to $1,301.25.

    Key Levels and Analyst Insights

    “Oil continues to be up, adding to pressures of inflation and expectations of Fed interest rate hikes, capping a positive undertone in gold as the dollar weakens,” said Jigar Trivedi, a senior research analyst at IndusInd Securities.

    According to the CME FedWatch Tool, traders now see a 77% chance of a September rate hike by the US Federal Reserve. Key support levels for MCX gold are at ₹1,44,400 and ₹1,43,350, while resistance stands at ₹1,46,800 and ₹1,48,000. For silver, support is at ₹2,24,400 and ₹2,22,000, with resistance at ₹2,29,100 and ₹2,31,000.

    “We suggest long-term investors must hold their long positions in gold and silver, but traders can book profits in every market rise in gold around ₹1,47,000 and ₹1,48,000 range and in silver around ₹2,31,000 and ₹2,33,000 range,” advised Manoj Kumar Jain of Prithvifinmart Commodity Research.

    Disclaimer: This article is for informational purposes only and does not constitute financial advice. Readers should consult with a qualified financial advisor before making investment decisions.

  • How Your Employment Type Affects Loan Approval and Interest Rates

    How Your Employment Type Affects Loan Approval and Interest Rates

    Employment type is a critical factor lenders evaluate when reviewing a borrower’s financial profile. While income matters, lenders also assess the stability, consistency, and reliability of the income source. This is especially important for personal loans, where repayment capacity is scrutinized. Salaried employees, self-employed professionals, and business owners are often evaluated differently based on their income structure and financial records. Understanding these differences can help you prepare a stronger application and secure better loan terms.

    Salaried Employees at Large Corporations

    Employees of large corporations, listed companies, and established public sector organizations are typically viewed favorably by lenders because of stable income and predictable employment. This can lead to competitive loan terms and higher eligible amounts. For these borrowers, meeting basic requirements such as minimum job tenure, income criteria, and a healthy credit score is usually sufficient. Maintaining a strong credit profile further improves options. Standard documents include salary slips, Form 16, and bank statements.

    Salaried Employees at Small or Newer Companies

    Employees of smaller or newer companies may face a slightly different assessment. Lenders examine employment tenure, salary consistency, and credit history more closely because the employer lacks a long track record. This does not automatically disqualify you or result in higher interest rates. You can improve your chances by maintaining stable employment, a good credit score, and a clean banking record. If the company shows steady growth, that can also support your application. Having documents ready and providing accurate financial details helps lenders assess your profile better.

    Self-Employed Professionals

    Self-employed professionals such as doctors, chartered accountants, lawyers, architects, and consultants are assessed differently from salaried applicants. Lenders review income tax returns (ITR) for the last two to three years, profit and loss statements, and business bank statements instead of salary slips. Eligibility depends on the consistency of income across ITR filings, business trends, and bank statement quality. Professionals with a stable practice, consistent ITR-declared income, and clean bank statements often receive competitive terms comparable to those of salaried employees at large corporations. Newer practices or those with declining trends may face more scrutiny.

    Self-Employed Business Owners

    Business owners of proprietorships, partnerships, or private companies are evaluated on both business financial performance and personal profiles. Lenders review business ITR, audited or CA-certified financial statements, and business bank statements. The stability and growth of the business directly influence loan terms. Business owners with two to three years of consistent operations, growing ITR-declared income, and clean banking behavior can access competitive personal loans. Businesses in their first two years face tighter assessments due to limited track records. Some lenders have minimum vintage requirements specifically for business owners.

    Documentation Differences by Employment Type

    Employment type directly determines the required documentation:

    • Salaried: Aadhaar, PAN, three months’ salary slips, Form 16, three to six months of bank statements.
    • Self-employed professionals: Aadhaar, PAN, two to three years of ITR filings, profit and loss statements, twelve months of bank statements.
    • Business owners: All of the above, plus business ITR, audited financial statements, and business bank statements.

    Self-employed categories require more documentation, but the assessment can be equally favorable if documents are strong. Preparing a larger document set carefully reduces friction in the process.

    How Employment Type Affects Interest Rates

    Personal loan interest rates can vary by 0.5% to 2% based on employment type for otherwise similar profiles. Salaried employees at large corporations typically receive the lowest rates. Self-employed applicants often see rates 0.5% to 1% higher. However, this differential can be offset by exceptional credit profiles, strong business financials, and long-standing banking relationships. Employment type sets the starting point, not the final outcome.

    Strengthening Your Application by Category

    • Large corporation salaried: Maintain a strong credit profile and minimize debt-to-income ratio.
    • Small company salaried: Build tenure at your current employer and strengthen credit behavior.
    • Self-employed professionals: Ensure consistent ITR filings and maintain clean business banking.
    • Business owners: Build business vintage, align ITR with bank statements, and maintain quality financial statements.

    Focusing on the levers relevant to your situation yields better outcomes than generic preparation.

    Choosing the Right Lender for Your Employment Type

    Not all lenders assess employment types equally. Some have more experience with self-employed applicants, while others are better suited for salaried borrowers. Before applying, compare lenders based on eligibility criteria, repayment options, documentation requirements, and loan terms for your profile. For example, leading institutions like Tata Capital consider income, credit history, and repayment capacity across all employment categories. Reviewing eligibility and available options beforehand helps you understand what works best for your financial situation.

    Conclusion

    Employment type influences how lenders assess your loan application, but it does not determine the outcome. Whether you are salaried, self-employed, or a business owner, maintaining a strong credit profile and preparing the right documents can improve your approval chances. Understanding these factors strengthens your personal loan application and helps you access suitable terms.

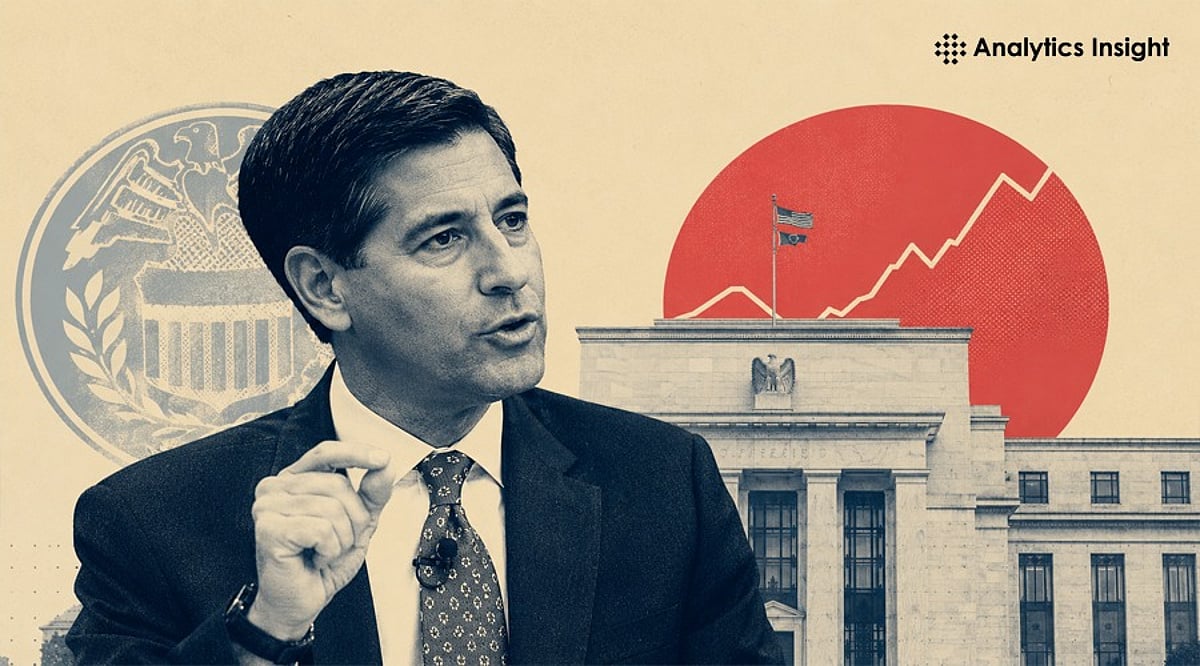
  • Kevin Warsh Labels Fed’s 2020 Inflation Strategy a Costly Error, Launches Policy Review

    Kevin Warsh Labels Fed’s 2020 Inflation Strategy a Costly Error, Launches Policy Review

    Federal Reserve Chair Kevin Warsh has publicly criticized the central bank’s 2020 inflation framework, calling it a costly policy mistake. During testimony before the House on July 14, Warsh announced the creation of five task forces to reassess how the Fed sets monetary policy. He emphasized a firm commitment to returning inflation to the 2% target, though he offered no clear signals on the timing of future interest-rate changes.

    Rejection of the 2020 Inflation Framework

    The Fed adopted flexible average inflation targeting in 2020, which allowed policymakers to aim for inflation moderately above 2% after periods of below-target price growth. The framework also prioritized employment shortfalls before withdrawing policy support. Warsh told lawmakers this approach was a mistake, stating that the Fed asked for a little more inflation and received much more. Inflation has remained above the 2% goal since 2021, and Warsh stressed that policymakers have no tolerance for persistently elevated inflation.

    The framework was revised in August 2025, before Warsh became chair, replacing the average-inflation makeup strategy with flexible inflation targeting. The update also shifted from a focus on employment shortfalls to a balanced approach considering both inflation and employment gaps.

    Five Task Forces to Review Fed Policy

    Warsh has established five task forces to examine monetary policy operations. These groups cover Fed communications, balance-sheet policy, economic data, productivity and jobs, and inflation frameworks. External advisers will collaborate with Fed staff and present findings to the Federal Open Market Committee (FOMC). The inflation group will study how the Fed identifies and responds to price growth, while the communications group will review how officials explain decisions during uncertain periods. Another panel will assess the timeliness of economic data, and the balance-sheet group will evaluate the Fed’s asset holdings and operating system.

    Warsh has not specified when the reviews will produce proposals. Any new framework would require support from other Fed policymakers. The FOMC makes rate decisions through votes, and members remain divided on whether rates should rise, stay unchanged, or fall later in 2026.

    Uncertain Interest-Rate Path

    June inflation data provides the Fed more time to assess its next move. The Consumer Price Index fell 0.4% for the month, and annual inflation slowed to 3.5% from 4.2%. Core inflation held flat monthly and eased to 2.6% year-over-year. Warsh warned lawmakers against treating one report as proof that inflation is defeated, saying, “There might be some that look at this morning’s data and say, ‘mission accomplished.’ That is not my view.” He offered no clear guidance on whether the Fed will raise rates at its July 28-29 meeting.

    The federal funds rate remains in a 3.5% to 3.75% range after the Fed held it steady in June. Warsh’s second congressional appearance is scheduled for July 15 before the Senate Banking Committee, where lawmakers may seek details on the task forces, the 2% target, Fed independence, and how future policy changes will balance inflation control with maximum employment.

  • XRP Gains Momentum as Fed Rate Cut Hopes Rise: Key Drivers Explained

    XRP Gains Momentum as Fed Rate Cut Hopes Rise: Key Drivers Explained

    XRP has moved higher in recent days as investors react to shifting expectations about U.S. interest rates. The latest economic reports point to slower inflation and weaker job market growth, prompting many market experts to anticipate that the Federal Reserve will lower borrowing costs later this year instead of maintaining high rates. This shift has created fresh demand for assets that typically perform well when financial conditions ease, with cryptocurrencies—and XRP in particular—standing out among the leading digital assets.

    Lower Rate Expectations Support Crypto Prices

    Interest rates play a crucial role in the economy. When rates are high, investors tend to move money into safer assets like Treasury bonds. When rates are expected to fall, the opposite occurs: investors seek assets with high growth potential. Recent U.S. economic data confirmed that the Fed is likely to adopt a more lenient monetary policy, causing Treasury yields to decline and allowing many cryptocurrencies to recover from earlier losses.

    Bitcoin Rally Lifts the Entire Crypto Market

    Bitcoin often sets the direction for digital assets. As Bitcoin rallies, confidence spreads to other cryptocurrencies. The latest Bitcoin surge has created a positive atmosphere, with higher trading activity as investors prepare for possible rate cuts. Better liquidity supports risk assets, and XRP has delivered stronger gains than several other large cryptocurrencies during this recovery.

    Ripple Continues to Build Its Network

    XRP’s rise isn’t solely tied to macroeconomic news. Ripple has expanded its payment network and blockchain services, adding partnerships focused on faster and cheaper international money transfers. The XRP Ledger has also grown through projects in decentralized finance, tokenized real-world assets, and business blockchain solutions. These developments reinforce confidence that XRP has practical uses beyond trading.

    Better Regulatory Outlook Boosts Confidence

    Regulatory clarity is a key contributor to XRP’s resurgence. After years of legal ambiguity in the U.S., the situation now appears more favorable. Many analysts believe clearer regulations could bring banks, financial institutions, and hedge funds into the crypto sector, removing uncertainties and encouraging institutional adoption.

    Institutional Interest Continues to Grow

    Large financial institutions have shown increasing interest in digital assets. XRP remains part of this conversation, with growing expectations that investment products linked to the cryptocurrency—such as exchange-traded funds—may become available. Although regulatory approval is still needed, optimism has built, and many analysts believe institutional investment could become an important demand driver.

    Technical Picture Shows Positive Momentum

    Market charts indicate stronger buying activity. XRP has held above important support levels while trading volume has increased during the recent rally. These signals suggest buyers have returned. Traders are watching key resistance levels; a successful move above them could attract even more demand. However, cryptocurrencies remain highly volatile, and short-term swings can still occur.

    Risks Have Not Disappeared

    Despite positive developments, risks remain. Strong economic data or an unexpected rise in inflation could cause the Fed to postpone rate cuts, potentially reducing demand for cryptocurrencies. Political events, sudden regulatory changes, or shifts in investor sentiment are also factors to consider.

    Outlook for XRP

    XRP has received support from multiple positive developments: softer U.S. economic data, a stronger crypto market, continued growth of Ripple’s ecosystem, rising institutional interest, and better regulatory conditions. The coming months could prove important. If interest rates move lower and Ripple continues expanding its network, market conditions may remain favorable. While price fluctuations are likely, the combination of improving economic conditions and stronger project fundamentals creates a positive outlook for XRP in the current market cycle.

  • Ethereum Surges as Fed Rate Worries Subside: Institutional Demand and Network Upgrades Fuel Rally

    Ethereum Surges as Fed Rate Worries Subside: Institutional Demand and Network Upgrades Fuel Rally

    Ethereum has been gaining momentum as concerns over prolonged high U.S. interest rates fade. Cooling inflation has shifted expectations toward a softer Federal Reserve stance, prompting investors to rotate capital into higher-growth assets like ETH. This macroeconomic tailwind, combined with strong institutional demand, ongoing network upgrades, and expanding Layer-2 adoption, is bolstering Ethereum’s long-term outlook.

    Lower Interest Rate Concerns Support Ethereum

    Interest rates heavily influence financial markets. Recent inflation data has eased fears that the Fed will maintain elevated rates for an extended period. This shift in sentiment has drawn fresh money back into risk assets, including Ethereum.

    Institutional Investors Continue to Show Interest

    Growing institutional demand is a key driver of Ethereum’s price movement. Major investment firms are increasing their exposure through spot Ethereum ETFs. While weekly inflows fluctuate, the overall trend points to rising institutional backing.

    Ethereum Network Remains Strong

    Ethereum maintains its position as the largest smart contract blockchain. Thousands of decentralized finance (DeFi) platforms, blockchain applications, and stablecoin projects rely on its network daily. Developers continue building new products on Ethereum, drawn by its robust infrastructure and large user base. This steady growth supports long-term demand for ETH.

    Staking Reduces Supply

    Ethereum’s proof-of-stake system allows holders to lock their coins to secure the network and earn rewards. As more investors stake their ETH, fewer coins remain available for trading. This supply reduction often supports prices when demand stays strong, giving Ethereum an advantage over many other cryptocurrencies.

    Network Upgrades Improve Performance

    Years of upgrades have boosted processing efficiency, validator performance, wallet security, and transaction speeds. These technical improvements attract developers, enterprises, and financial institutions, making Ethereum a more attractive long-term investment.

    Layer-2 Networks Help Ethereum Grow

    The rapid growth of Layer-2 networks makes transactions faster and cheaper. Lower costs encourage broader use of DeFi platforms, blockchain games, digital collectibles, and other services. Since these Layer-2 systems rely on the main Ethereum blockchain, increased network activity benefits ETH directly.

    Strong Market Position Supports Price Growth

    Ethereum’s total market capitalization exceeds $214 billion, with a circulating supply of about 120.7 million ETH. Daily trading volume regularly surpasses $10 billion, indicating strong engagement from both retail and institutional participants. This liquidity attracts major investment firms.

    Better Economic Outlook Helps Risk Assets

    U.S. Treasury yields have stabilized compared to the period of aggressive rate hikes, reducing pressure on growth-focused investments. Anticipation of a less restrictive Fed posture, assuming inflation trends toward target, typically fuels gains in tech stocks and crypto tokens. Ethereum has historically performed well under such conditions.

    Tokenization Creates New Opportunities

    Real-world asset tokenization is gaining traction. Banks and financial institutions are exploring ways to place traditional assets like bonds and funds on blockchain networks, opening new use cases for Ethereum.

    Risks Still Remain

    Despite the rally, Ethereum remains volatile. Economic reports, Fed statements, ETF flows, and sentiment changes can cause sharp price swings. However, the easing of interest rate concerns has created a more favorable environment for cryptocurrencies.

    Final Thoughts

    Ethereum’s recent rise reflects a convergence of factors: easing Fed rate fears, strong institutional participation via spot ETFs, network upgrades, Layer-2 growth, expanding blockchain adoption, and tokenization. With a market cap above $214 billion and daily trading volume over $10 billion, Ethereum remains a dominant digital asset. While short-term volatility persists, the combination of improved economic conditions and solid network fundamentals supports its long-term growth.

  • Wall Street Surges as June Jobs Data Softens Fed Rate Hike Outlook

    Wall Street Surges as June Jobs Data Softens Fed Rate Hike Outlook

    U.S. stocks moved higher on Thursday after a weaker-than-expected June employment report eased concerns that the Federal Reserve might raise interest rates in the near term. The Dow Jones Industrial Average reached a new record intraday high above 52,800, while the S&P 500 also advanced. Investors shifted focus to labor market data that pointed to slower hiring while unemployment remained relatively stable.

    The report pushed Treasury yields lower and lifted expectations that the Fed may leave rates unchanged at its next policy meeting. Gains in materials and consumer staples helped offset continued weakness in semiconductor stocks, allowing major indexes to climb.

    June Payrolls Miss Forecasts as Unemployment Holds Steady

    The U.S. economy added 57,000 nonfarm payroll jobs in June, well below economists’ expectations of around 110,000 to 115,000. Despite slower hiring, the unemployment rate came in at 4.2%, slightly better than the forecasted 4.3%. The softer data interrupted several months of stronger hiring and was seen as a sign that the labor market is cooling without broad weakness, reducing the need for the Fed to tighten monetary policy further.

    Florian Ielpo, head of macro at Lombard Odier Investment Managers, described the report as “the best number we could hope for,” noting that the job market remains fine but not hot enough to accelerate inflation. Bret Kenwell, US investment analyst at eToro, added that while the report doesn’t signal labor-market trouble, it does cool the hawkish narrative.

    Markets Trim Expectations for Another Fed Rate Hike

    Following the employment data, traders lowered odds of a near-term Fed rate increase. The two-year Treasury yield, which closely tracks policy expectations, fell. Market pricing shifted toward a greater probability that policymakers would keep rates unchanged later this month.

    Fed Chair Kevin Warsh had noted on Wednesday that inflation risks had eased, reaffirming the central bank’s 2% target. The latest jobs figures shifted attention to the labor side of the Fed’s dual mandate. Bradford Smith, portfolio manager at Janus Henderson Investors, said the print “takes some of the pressure off” the Fed to hike near term, especially with moderating oil prices and softer hiring.

    Dow Reaches Another Record While Chip Stocks Lag

    The Dow Jones Industrial Average set a fresh intraday record above 52,800, and the S&P 500 traded higher. However, the Nasdaq underperformed as semiconductor shares extended recent losses. The VanEck Semiconductor ETF declined, with Teradyne, KLA, Nvidia, and Micron trading lower.

    Despite chipmaker weakness, market participation broadened. Materials and consumer staples led S&P 500 sector gains, and advancing stocks outnumbered decliners on both the NYSE and Nasdaq. Ielpo noted that investors are finding value outside AI and technology, favoring a broader market approach.

    Investors Monitor Inflation Risks and Broader Trends

    Although the jobs report eased immediate rate-hike fears, investors continue watching inflation and geopolitical developments, particularly oil price volatility tied to tensions involving Iran and the Strait of Hormuz. Indirect U.S.-Iran talks showed little progress, but oil prices moved lower on hopes that tensions would remain contained.

    Active fund managers posted stronger June performance as market breadth improved. According to Jefferies strategist Steven DeSanctis, about 70% of active managers beat their benchmarks, with nearly 88% of small-cap managers outperforming as leadership expanded beyond high-growth stocks. Investors also monitored AI-related shares after recent volatility, with analysts noting that improving breadth has allowed gains to spread across sectors.

    Disclaimer: This article is for informational purposes only and does not constitute investment advice. Always conduct your own research before making investment decisions.

  • Bitcoin and Gold Sink Together in 2026 as Market Pressures Mount

    Bitcoin and Gold Sink Together in 2026 as Market Pressures Mount

    Bitcoin and gold have both declined as higher interest rates, tighter liquidity, and market uncertainty reduced demand for traditional and digital stores of value. The rare move has raised attention because the two assets often follow different paths during market stress.

    Bitcoin and gold have fallen sharply in 2026, marking an uncommon period when two assets often viewed as stores of value declined together. Market strategist Charlie Bilello reported that Bitcoin is down 31% while gold has lost 6% this year, making them the weakest-performing major asset classes so far.

    The unusual move has drawn attention because the two assets have historically performed differently during periods of market stress.

    Bitcoin and Gold Record an Unusual Year

    Charlie Bilello reported that Bitcoin and gold have become the two worst-performing major asset classes in 2026. He described the development as something ‘we havenʼt seen before in any calendar year.’

    The simultaneous decline suggests investors have reduced exposure to both digital and traditional stores of value. Instead, capital has moved toward other asset classes that have delivered stronger returns during the year.

    Several factors have contributed to the shift. Market conditions have become more challenging in 2026 as investors respond to higher interest rates, tighter liquidity, geopolitical uncertainty and a rise in crypto-related security incidents. These factors have weakened demand for both Bitcoin and gold.

    Analysts also point to the stronger US dollar and the Federal Reserve’s restrictive monetary policy as key drivers behind the downturn. Higher borrowing costs have encouraged investors to shift toward income-generating assets, reducing interest in investments that do not produce regular yields.

    Correlation Between Bitcoin and Gold

    Bitcoin climbed above $110,000 during the second half of 2025 while gold continued to post steady gains. Even though both assets advanced, they responded to different market conditions and showed only a limited price correlation.

    The relationship changed during 2026. Bitcoin dropped from around $90,000 to nearly $60,000 after February. Gold held up better at first but later moved lower as well. By June, both assets were declining at the same time, pushing their price correlation into positive territory for one of the rarest periods on record.

    Data from CryptoQuant also showed noticeable changes in the Bitcoin-gold price correlation between June 2025 and June 2026. The correlation moved between positive and negative readings before strengthening as both assets declined together.

    Bitcoin researcher Adam Livingston commented on the trend, stating that “2026 is officially the most oversold year for Bitcoin versus gold ever recorded.” At the same time, the Bitcoin-to-gold ratio continued to weaken, reflecting Bitcoin’s larger decline compared with gold.

    Gold Outlook Remains Mixed as Market Uncertainty Continues

    Investor Robert Kiyosaki recently shifted his focus from Bitcoin to precious metals after discussing both assets earlier in June. On June 25, he announced that gold had “made the turn” and predicted a longer-term bull market for gold and silver while maintaining a $35,000 long-term price target.

    Days later, however, he revised his short-term view after gold extended its decline. On June 29, Kiyosaki admitted, “I was wrong. Gold still crashing.” Despite the setback, he maintained his longer-term bullish outlook for the metal.

    Gold has also faced pressure from changing geopolitical developments. Reports surrounding US-Iran nuclear negotiations reduced demand for safe-haven assets as some investors shifted toward riskier investments. At the same time, uncertainty over future Federal Reserve policy has continued to influence both gold and Bitcoin prices.

    Market participants are now watching central bank decisions, US dollar strength and geopolitical events for signs of whether the recent weakness in both assets will continue or begin to reverse.

  • Bitcoin Crashes to 21-Month Low: 5 Critical Catalysts Behind the $58,980 Plunge

    Bitcoin Crashes to 21-Month Low: 5 Critical Catalysts Behind the $58,980 Plunge

    Key Takeaways

    • Bitcoin dropped over 50% from its October 2025 peak of $126,080, reaching nearly $58,980.
    • More than $6 billion left Bitcoin ETFs in six weeks, signaling weak institutional confidence.
    • Analysts warn Bitcoin may fall toward $48,000 if market conditions continue to worsen.

    Bitcoin has entered a severe downturn, plunging to its lowest price in nearly 21 months. On June 26, 2026, the leading cryptocurrency slipped below $60,000 and touched approximately $58,980—a dramatic decline from its all-time high of $126,080 in October 2025. In less than a year, Bitcoin has lost more than half its value, sending shockwaves through the crypto market.

    This sudden collapse surprised many investors who expected Bitcoin’s 2025 momentum to carry into 2026. However, a combination of economic pressures, institutional selling, and widespread market panic has driven prices down at an alarming pace. Below are the key factors behind the crash.

    Persistent High Interest Rates Squeeze Risk Assets

    The Federal Reserve has indicated that interest rates will remain elevated for an extended period. Historically, high borrowing costs push investors away from risky assets like cryptocurrencies. Fresh inflation data from June showed U.S. consumer inflation at 4.2% year-over-year—higher than market expectations—dashing hopes for imminent rate cuts. As a result, capital flowed out of crypto and into safer havens.

    Record ETF Outflows Signal Institutional Retreat

    Spot Bitcoin exchange-traded funds (ETFs) were a major driver of Bitcoin’s rally in 2024 and early 2025. But sentiment has reversed sharply. During the first half of June 2026, Bitcoin ETFs recorded over $4.4 billion in withdrawals across a 13-day outflow streak. Total outflows have now surpassed $6 billion in the past six weeks, reflecting a loss of confidence among large financial players.

    Corporate Bitcoin Sell-Off Sparks Fear

    Market jitters intensified after Strategy—the world’s largest corporate Bitcoin holder—sold 32 BTC earlier this month. Although the sale was small relative to the company’s total holdings, the symbolic move alarmed traders. Strategy had long championed a “buy and never sell” philosophy, so even a modest sale raised concerns that more companies might reduce their Bitcoin exposure if prices continue to slide.

    $3 Billion in Liquidations Wipe Out Leveraged Traders

    Between June 4 and June 6, Bitcoin crashed from nearly $67,000 to around $59,100, triggering forced liquidations across exchanges. Over $3 billion in leveraged positions evaporated in just 48 hours. Approximately 85% of those liquidations affected traders who had bet on rising prices (long positions), deepening the downward spiral.

    Technical Analysis Points to More Downside

    Market indicators now show Bitcoin in an “extreme fear zone.” The Crypto Fear and Greed Index has fallen sharply, often a sign of panic. Historical bear cycles suggest Bitcoin typically retraces more than 61.8% from its bull-market peak. If current support fails, analysts project a potential drop toward $48,000.

    The broader crypto market is bleeding value as well. Ethereum has dipped near $1,530, and the total cryptocurrency market cap has lost nearly $2 trillion from its 2025 peak. Bitcoin itself has fallen more than 30% since the start of 2026, making it one of the worst-performing major assets this year.

    FAQs

    1. Why has Bitcoin fallen so sharply in 2026?

    Persistent 4.2% inflation keeps U.S. interest rates high, driving investors away from risky assets. This economic pressure combined with massive ETF outflows and $3 billion in sudden market liquidations.

    2. What is Bitcoin’s current price level?

    Bitcoin plummeted to a 21-month low, trading near $58,980 on June 26, 2026. This sudden drop marks a steep decline from its previously strong momentum throughout 2025.

    3. How much has Bitcoin fallen from its all-time high?

    Bitcoin has lost over 50% of its value since peaking at $126,080 in October 2025. This rapid downward correction has pushed the market into an extreme fear zone.

    4. Are institutions selling Bitcoin right now?

    Yes, institutional sentiment has shifted significantly. Spot Bitcoin ETFs recorded a massive $4.4 billion in withdrawals over a 13-day streak, totaling over $6 billion in the last six weeks.

    5. Could Bitcoin fall even lower?

    If current support levels fail to hold, technical indicators suggest further downside. Historical market cycles indicate Bitcoin could drop toward $48,000 before finding a firm bottom in 2026.

  • Gold Drops Over 1% on MCX as Strong Dollar and Fed Rate-Hike Expectations Pressure Bullion

    Gold Drops Over 1% on MCX as Strong Dollar and Fed Rate-Hike Expectations Pressure Bullion

    Gold prices on the Multi Commodity Exchange (MCX) fell sharply on June 30, undermined by a strengthening U.S. dollar and weak global cues, as traders priced in the likelihood of multiple Federal Reserve rate hikes this year. August gold futures declined by 1.16% to settle at Rs. 1,40,757 per 10 grams, while July silver futures slipped 0.55% to Rs. 2,18,200 per kilogram.

    The pressure on precious metals extended across global markets. Spot gold dropped 1.5% to $3,956.92 per ounce, putting it on track for its steepest monthly decline since October 2008—a fall of 12.7% in June alone, marking the fourth straight monthly retreat. U.S. gold futures for August delivery lost 1.7% to $3,969.30 per ounce. Spot silver slid 2% to $57.13 per ounce, platinum eased 1.1% to $1,557.21, and palladium edged down 0.4% to $1,208.17.

    According to the CME FedWatch Tool, traders now anticipate three rate hikes from the U.S. Federal Reserve this year, with a 64% probability of a move in September. The strong dollar and elevated interest rate expectations continue to weigh on gold, which offers no yield and competes with interest-bearing assets.

    “You have high inflation, high interest rate expectations, and a strong dollar, and that’s overriding all other bullish factors that are typically associated with a gold rally,” said Edward Meir, an analyst at Marex.

    In the domestic market, 24-karat gold fell by Rs. 180 to Rs. 1,40,130 per 10 grams, while 22-karat gold declined by Rs. 165 to Rs. 1,28,450. City-wise, Mumbai and Kolkata quoted Rs. 1,40,130, Delhi at Rs. 1,40,280, and Chennai at Rs. 1,45,080. Meanwhile, crude oil also trended lower, with Brent futures down 0.87% at $72.51 a barrel and West Texas Intermediate (WTI) dropping 0.62% to $70.31 a barrel.

    Key Levels to Watch

    On the international front, gold has support at $3,994 and $3,955 per troy ounce, with resistance at $4,074 and $4,110. Silver support is at $57 and $55.40, while resistance stands at $60 and $61.60 per troy ounce. On MCX, gold finds support at Rs. 1,41,100 and Rs. 1,40,000, with resistance at Rs. 1,43,600 and Rs. 1,44,800. Silver has support at Rs. 2,16,600 and Rs. 2,14,000, and resistance at Rs. 2,22,400 and Rs. 2,25,000.