Tag: S&P 500

  • US Stocks Slip as Treasury Yields Climb: Nasdaq and S&P 500 Give Back Gains

    US Stocks Slip as Treasury Yields Climb: Nasdaq and S&P 500 Give Back Gains

    US equities closed lower on Friday as rising Treasury yields weighed on investor sentiment, unwinding most of the gains posted Thursday after the latest rate hike. The tech-heavy Nasdaq Composite slipped 0.1%, the broad S&P 500 index lost 0.2%, and the Dow Jones Industrial Average dropped 0.4%.

    Bond Yields Surge

    The move came as US government bond yields climbed across the curve. The two-year Treasury yield rose 1.5% to 4.75%, marking its highest level since June 2024. Meanwhile, the benchmark 10-year Treasury yield pushed above the 5.00% threshold.

    The Federal Reserve’s 25-basis-point rate hike on Wednesday continued to reverberate through markets. Japan’s central bank also raised rates by 25 basis points overnight, underscoring a global shift toward tighter monetary policy.

    Higher bond yields typically make equities less attractive relative to fixed-income assets and raise borrowing costs for corporations. Sectors with heavy debt loads, such as materials and utilities, felt the pressure, while financial and real estate names also struggled.

    Analysts also noted that the ongoing artificial intelligence rally and hyperscalers’ heavy capital expenditure have contributed to increased bond issuance, adding further upward pressure on yields.

    Triple Witching Adds to Market Turbulence

    Friday was also the third Friday of September — a quarterly triple witching day when stock options, stock index futures, and stock index options all expire at the close. Such sessions often bring above-average trading volume and sharper volatility as investors adjust or roll over their positions. The final hour of trading, from 15:00 to 16:00 EST, can be especially turbulent, with triple witching days frequently recording double the typical daily volume.

    S&P 500 Tests Key Support

    The S&P 500 opened sharply higher before reversing course to test the June 2 high at 7,621. According to FXStreet’s technical analysis, the index appeared to find support at the 50-day simple moving average during the morning session. A sustained break below 7,621 could open the door to Wednesday’s low near 7,508, while a move higher might face resistance around 7,800 next week or before the end of September.

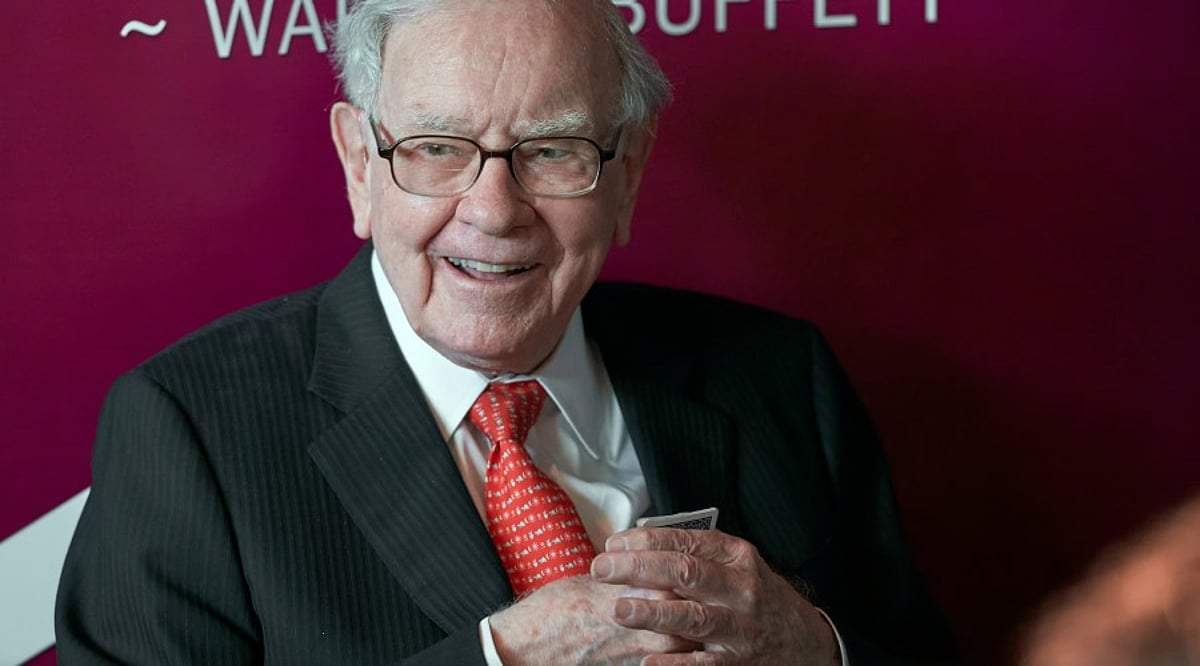
    In other news, Warren Buffett stepped down as Berkshire Hathaway chairman after 61 years, with his son Howard Buffett taking over the role. Greg Abel remains CEO of the conglomerate.

    Market participants now turn their attention to upcoming economic indicators and corporate developments before making their next investment moves.

  • Oil Price Slide Lifts Wall Street Futures as Inflation Worries Cool

    Oil Price Slide Lifts Wall Street Futures as Inflation Worries Cool

    US stock futures moved higher on Friday, led by the NASDAQ 100, as falling oil prices helped ease inflation concerns after a volatile week for financial markets.

    Futures Rally at the Open

    At 7:00 a.m. ET, NASDAQ 100 E-minis were up 166.25 points, or 0.56%. S&P 500 E-minis rose 21.5 points, or 0.13%, while Dow E-minis added 83 points, or 0.16%. The gains followed Thursday’s rebound, when major US indexes recovered part of the losses triggered by the Federal Reserve’s latest rate increase.

    Oil Prices Ease for a Third Straight Session

    Brent crude and US West Texas Intermediate futures dropped nearly 2% each on Friday. Although tensions between Saudi Arabia and Yemen’s Iran-backed Houthis kept supply risks in focus, lower crude prices helped reduce pressure on inflation expectations. Energy costs are closely watched because higher fuel and transport expenses can feed into consumer prices.

    Oil had already weakened on Thursday, with US crude closing 0.51% lower at USD 101.91 per barrel and Brent falling 0.95% to USD 104.82. Reports that Saudi Arabia would make more crude cargoes available to Asian refiners also eased concerns about near-term supply.

    Treasury yields also retreated. The 10-year US Treasury yield fell more than seven basis points to 4.93% on Thursday after moving above 5% following the Fed’s rate decision.

    Tech Stocks Anchor the Recovery

    Technology stocks remained a key source of strength. NVIDIA rose about 1% in premarket trading on Friday, while Alphabet gained around 2%. Apple slipped 0.2%. On Thursday, NVIDIA and Amazon added more than 2% each, Microsoft advanced 1.5%, Intel jumped 7% and Qualcomm rose about 2%.

    The Dow Jones Industrial Average ended Thursday up 316.14 points, or 0.61%, at 51,778.04. The S&P 500 climbed 1.14% to 7,637.76, while the NASDAQ Composite rose 1.69% to 26,418.30.

    AI Spending and Earnings Concerns

    Investors continued to assess the outlook for artificial intelligence spending after several industry executives called for slower development of advanced AI systems. Goldman Sachs chief US equity strategist Ben Snider said concerns had emerged that strong corporate earnings could represent an “earnings bubble.” However, he wrote that the firm’s base case expects S&P 500 earnings growth to “decelerate, not collapse” in coming years.

    Mixed Fund Flows and Market Breadth

    Investor positioning presented a mixed picture. Bank of America data showed investors added a net USD 79.3 billion to stocks in the week through Wednesday, including USD 63.8 billion directed toward US equities. However, separate LSEG Lipper data showed global equity funds recorded USD 23.21 billion in net withdrawals in the week through September 16 — the largest weekly outflow in nine months. US equity funds recorded USD 31.44 billion in withdrawals.

    Technology, financial and consumer discretionary funds still attracted new money, with combined sector inflows helping equity sector funds record their strongest weekly demand in six weeks. Market breadth remained uneven: just over half of S&P 500 companies were trading below their 200-day moving averages, showing that gains in major indexes remained concentrated in a smaller group of stocks.

    Trading activity could also increase on Friday because of “triple witching,” the quarterly expiry of stock options, index options and futures contracts.

  • US Stock Futures Climb Ahead of August CPI Report; Oracle Surges, Adobe Slides

    US Stock Futures Climb Ahead of August CPI Report; Oracle Surges, Adobe Slides

    US stock futures moved higher on Friday as investors prepared for the August consumer price index report. Oil prices eased from recent highs, while Treasury yields stayed close to multiyear peaks. Markets remained cautious after Wall Street recorded four straight sessions of losses.

    At 5:31 a.m. ET, Dow E-minis rose 276 points, or 0.53%. S&P 500 E-minis gained 0.54%, while NASDAQ 100 E-minis increased 0.57%. The gains followed another weak session on Thursday, when the Dow fell more than 300 points, the S&P 500 dropped 0.6%, and the NASDAQ Composite declined 0.7%.

    Investors now await the August CPI report. Economists expect consumer prices to rise 0.4% from July and 3.4% from a year earlier. Core CPI is expected to rise 0.2% monthly and 2.4% annually. The data arrives after a hotter producer price index, which increased 0.4% in August and rose 5.4% from a year earlier.

    The inflation readings come ahead of the Federal Reserve’s Sept. 15-16 meeting. Futures markets assign roughly a two-thirds to 70% chance of a 25-basis-point rate increase. Christopher Hodge, chief US economist at Natixis CIB Americas, said an inflation reading near expectations could reduce pressure on the Fed to raise rates.

    Oil prices moved lower on Friday but remained above $104 a barrel for Brent and near $100 for West Texas Intermediate. Shipping activity through the Strait of Hormuz has fallen sharply, and markets continue to monitor Middle East tensions. Bill Adams, chief US economist at Fifth Third Commercial Bank, noted that the surge in energy prices creates new upside risk for inflation.

    Treasury yields stayed elevated, with the 10-year near 4.94% after approaching 5% on Thursday. The 30-year yield reached about 5.3%. Higher bond yields can reduce demand for stocks as investors shift to lower-risk fixed-income assets.

    Oracle shares jumped about 7% in premarket trading after the company reported stronger quarterly revenue and profit. Its cloud infrastructure sales more than doubled, and it added more than $30 billion in AI cloud contracts during the quarter. Remaining performance obligations reached $664 billion. Adobe shares fell more than 2% after issuing a fourth-quarter revenue forecast below Wall Street expectations, though its adjusted earnings of $6.13 per share beat estimates.

    Nvidia gained in premarket trading, while ACV Auctions surged after Copart agreed to acquire it for nearly $1.9 billion. Friday’s market direction will depend heavily on the CPI reading as investors assess inflation, Treasury yields, oil prices, and expectations for the Federal Reserve’s next move.

  • Large-Cap Stocks: Understanding Their Risk Profile in 2026

    Large-Cap Stocks: Understanding Their Risk Profile in 2026

    What Are Large-Cap Stocks?

    Large-cap stocks represent shares of major companies with substantial market capitalization—calculated by multiplying the current share price by the total number of outstanding shares. These firms are typically industry leaders with established track records, diverse revenue streams, and significant financial resources.

    How Large-Cap Stocks Compare to Smaller Companies

    Investors often view large-cap stocks as a safer bet than small-cap stocks due to their stability and lower volatility. However, the 2026 market performance illustrates that size alone does not guarantee superior returns or immunity from downturns. As of September 8, 2026, the S&P 500—a benchmark for large-cap U.S. stocks—closed at 7,673.52, down 0.58% for the day but still up 12.1% year-to-date. In contrast, the Russell 2000, which tracks small-cap companies, gained a stronger 19.3% over the same period. This divergence highlights that while large-caps may offer more stability, they can lag in growth phases.

    Market Capitalization and Index Composition

    The S&P 500 provides a clear picture of the large-cap landscape. As of August 31, 2026, the index comprised 503 companies, with a median market value of $44.73 billion. The largest company in the index boasted a market cap of approximately $5.35 trillion. Notably, the top 10 companies accounted for 37.8% of the index’s total value, with heavyweights like NVIDIA, Apple, Microsoft, Amazon, Alphabet, Broadcom, Meta, Micron, and Tesla leading the pack.

    Why Size Can Mitigate Certain Risks

    Large-cap companies typically enjoy several advantages that can reduce business-specific risks:

    • Stronger cash reserves and better access to credit markets
    • Diversified product lines and geographic presence
    • Established brand loyalty and customer bases
    • Greater resilience during economic downturns

    These factors can help large firms weather storms that might sink smaller competitors. However, they do not eliminate market risk, valuation concerns, or sector-specific vulnerabilities.

    The Concentration Problem in the S&P 500

    A new risk has emerged in the large-cap space: concentration. According to BlackRock, the top 20 S&P 500 companies now represent 49% of the index’s value and contributed 64% of its five-year return. This means that a broad index fund holding 503 stocks can still see its performance heavily influenced by just a handful of mega-cap firms. The information technology sector, comprising 73 companies in the index, posted a 22.44% year-to-date price return through August 31, 2026, driven largely by AI demand. But this same momentum carries significant valuation risk if earnings fail to meet lofty expectations.

    Real-World Market Shocks Still Hit Large-Caps

    Even the largest companies are not immune to sudden market shocks. On September 8, 2026, the S&P 500 fell 0.58% as oil prices surged and fresh concerns about AI valuations hit software stocks. Salesforce, Intuit, and ServiceNow each dropped between 4% and 5%. Brent crude approached $100 per barrel, reigniting inflation fears. Additionally, the U.S. 10-year Treasury yield hovered near 4.8%, raising borrowing costs for corporations and making bonds more attractive relative to equities—pressures that affect even the biggest firms.

    Analyst Outlook and Risks

    HSBC projects the S&P 500 could reach 8,100 by the end of 2026, citing expectations of more than 25% earnings-per-share growth in the second half of the year, supported by strong corporate results and AI infrastructure spending. However, the bank also flags risks from persistent inflation, interest rate volatility, geopolitical tensions, and stretched stock valuations.

    Conclusion: Large-Cap Means Lower Risk, Not No Risk

    Large-cap stocks can provide a more stable foundation for an equity portfolio compared to small-caps, thanks to their financial strength, market reach, and liquidity. Yet, they are not risk-free. Valuation, debt levels, sector exposure, and broader economic conditions all play critical roles in determining performance. For investors, the key takeaway is to look beyond the “large-cap” label and examine the underlying composition of their holdings. A portfolio that appears diversified may still be heavily concentrated in a few mega-cap tech names, amplifying risk. As always, thorough research and a clear understanding of your risk tolerance are essential before making any investment decisions.

    Frequently Asked Questions

    1. What are large-cap stocks?

    Large-cap stocks are shares of companies with very high market capitalization, calculated by multiplying the share price by the total number of outstanding shares.

    2. Are large-cap stocks less risky?

    Generally, large-cap stocks are less volatile than smaller companies, but they still carry significant market risk and can experience sharp declines.

    3. Why can large-cap stocks still fall sharply?

    High valuations, weak earnings, economic shocks, rising interest rates, sector problems, and geopolitical events can all push large-cap shares lower.

    4. Is the S&P 500 a large-cap index?

    Yes. The S&P 500 provides broad exposure to major U.S. companies and serves as a key benchmark for the large-cap market.

    5. Does large-cap mean safe?

    No. Large-cap status can indicate greater business strength and stability, but it does not guarantee protection from investment losses.

  • S&P 500 Holds Steady as Chip and Software Declines Offset Broader Market Gains

    S&P 500 Holds Steady as Chip and Software Declines Offset Broader Market Gains

    The S&P 500 traded near the flatline on Thursday as steep losses in chip and software stocks offset gains across most other sectors. Investors weighed corporate earnings, labor data, and ongoing negotiations over reopening the Strait of Hormuz.

    At 11:20 a.m. ET, the S&P 500 slipped 0.08% to 7,723. The Dow Jones Industrial Average added 0.49% to 54,350, while the Nasdaq Composite edged up 0.05% to 26,380.

    Western Digital and Sandisk Shares Tumble

    Western Digital shares fell 18.5% in early trading despite reporting fourth-quarter results above Wall Street estimates. Its fiscal first-quarter forecast disappointed investors. Sandisk shares dropped 11.3% after releasing its fiscal fourth-quarter results. Both companies forecast quarterly revenue above estimates, driven by demand for artificial intelligence infrastructure. However, investors focused on valuations after significant gains earlier this year — Western Digital had climbed about 200%, and Sandisk had gained around 400%.

    Hank Smith, investment strategy director at Haverford Trust, noted that expectations had reached demanding levels, calling the price action “some digestion going on in the market.”

    The Philadelphia Semiconductor Index declined 1.5% during early trading. Intel and AMD also traded lower, adding pressure to the technology sector. However, several chip stocks later recovered: Broadcom gained nearly 2%, Marvell Technology rose about 3%, and NVIDIA moved higher during the session.

    Software Earnings Add Pressure to Technology

    Software stocks also recorded steep declines following several earnings reports. Atlassian, Salesforce, Adobe, and Zscaler traded lower. AppLovin shares fell about 17% after missing quarterly revenue estimates. The stock had previously benefited from investor demand for AI-linked companies. Datadog dropped roughly 17% after management forecast slower revenue growth in the third quarter, raising questions about enterprise software demand and valuations.

    Peloton shares fell more than 14% after forecasting lower sales in the coming fiscal year, citing higher prices for equipment and subscriptions. Still, Microsoft and Amazon each gained around 1%, helping limit broader losses across major indexes.

    Most S&P 500 Sectors Trade Higher

    Despite technology weakness, nine of the S&P 500’s 11 sectors traded higher during the morning session. Energy, consumer staples, and healthcare led the gains. Parker-Hannifin rose 8.5% after forecasting annual profit above analysts’ estimates. Albemarle gained 6.7% after beating quarterly profit estimates. Diageo rose about 6% after announcing a three-year plan targeting $1.2 billion in savings.

    Restaurant Brands International reported adjusted earnings of $1.07 per share, above the expected $1.03. Revenue reached $2.52 billion, matching estimates. Burger King recorded an 8.5% increase in comparable restaurant sales, though other brands within the group delivered weaker results.

    Labor Data Sets Up July Jobs Report

    New applications for unemployment benefits increased slightly to 199,000 for the week ending August 1, below the Dow Jones estimate of 204,000. Layoffs fell to their lowest level in two years during July. Second-quarter productivity increased 1.4% (versus 0.8% prior), while unit labor costs rose 1.3% (below the 2.1% estimate). Investors will now examine Friday’s July employment report for clues about the Federal Reserve’s policy path. Fed Chairman Kevin Warsh has reduced forward guidance, increasing the market’s focus on incoming economic data.

    Iran Talks Keep Oil and Gold in Focus

    Brent crude traded near $80 per barrel as investors monitored negotiations involving Iran and Oman focused on reopening shipping routes through the Strait of Hormuz. An Iranian official said a temporary agreement would allow ships to travel without fees or tolls, but final conditions had not been settled. Deutsche Bank strategist Jim Reid noted “unresolved questions” about whether Iran could later charge vessels.

    Gold rose for a fourth consecutive session as geopolitical uncertainty supported demand. Spot gold gained 0.6% to $4,271.33 per ounce, and US gold futures rose 0.6% to $4,330.20. Earlier, spot prices reached their highest level since June 18.

    Conclusion

    Technology losses kept the S&P 500 near the flatline, despite gains across nine of its 11 sectors. Western Digital, Sandisk, AppLovin, and Datadog recorded the sharpest declines following earnings updates. Meanwhile, investors monitored Iran-Oman shipping talks and Friday’s July employment report, both of which could shape energy prices and Federal Reserve rate expectations.

  • Bitcoin Holds Near $64,600 as S&P 500 Surges $2.1 Trillion on AI Rally

    Bitcoin Holds Near $64,600 as S&P 500 Surges $2.1 Trillion on AI Rally

    The S&P 500 has added $2.1 trillion in market value this month, driven by an AI-led rally, while Bitcoin trades near $64,600 with limited gains. Crypto-specific pressures, rising bond yields, shrinking stablecoin supplies, and uneven ETF demand have restrained Bitcoin’s upside despite stronger sentiment across US equities.

    The S&P 500 has gained 3.12% this month, boosting its market cap by about $2.1 trillion—almost matching the entire global cryptocurrency market. Bitcoin, however, has risen only 2% in the same period, hovering near $64,600. Analysts attribute the divergence to AI-focused stock demand, crypto market headwinds, higher bond yields, and cautious trader positioning.

    AI Stocks Drive Wall Street’s Gains

    The S&P 500 now holds a record market value near $70.5 trillion, with the index around 7,723 points. The Nasdaq and Dow have also advanced as investors pour capital into large technology companies.

    Adam Haeems, head of asset management at Tesseract Group, noted that the equity rally centers on sectors with limited ties to Bitcoin. “Partly because the equity rally is being driven by areas to which bitcoin has little direct exposure, particularly AI and semiconductor stocks,” he said.

    Lower oil prices have provided additional support to listed companies through reduced operating costs. Haeems suggested Bitcoin may benefit later from softer inflation expectations and potential Federal Reserve policy changes, though uncertainty around the September outlook limits that path.

    Paul Howard, senior director at Wincent, linked the gap to concentrated equity demand. “The stock rally is biased towards AI and mega-caps which doesn’t necessarily translate into crypto flows,” he said.

    Crypto Pressures Limit Bitcoin Demand

    Bitcoin faces sector-specific challenges that do not affect equities directly, including the $120 million Coldcard exploit, uncertainty surrounding the CLARITY Act, and Strategy’s recent Bitcoin sales.

    Haeems said these events have weakened sentiment without triggering a wider credit crisis or forced selling cycle. Strategy has sold Bitcoin for three consecutive months, adding concern for traders monitoring corporate demand.

    Rising bond yields also make government debt more attractive than non-yielding crypto assets. Real Treasury returns are at their highest since 2008, encouraging some capital to stay outside digital asset markets.

    Stablecoin supplies reflect the same pressure. Haeems noted that USDT supply dropped from about $190 billion in April to $183 billion, while USDC supply declined from $79.5 billion to $72 billion over the same period.

    Traders Watch October, ETF Flows

    Markus Thielen, founder of 10x Research, said many traders expect Bitcoin’s four-year cycle to produce an October bottom, prompting them to wait rather than build positions during the equity rally.

    However, Thielen said Bitcoin’s ability to hold steady despite the Federal Reserve’s firm stance could support another reading. “Traders are underestimating the upside risk from a less hawkish Fed, and overlooking the possibility that the four-year cycle has already bottomed,” he said.

    ETF activity has been mixed. US spot Bitcoin funds recently recorded $61.53 million in outflows, ending three weeks of modest inflows. They then attracted $626 million this week, their strongest total since early May.

    Giottus CEO Vikram Subburaj said several consecutive inflow days would help confirm stronger institutional demand. He identified Bitcoin support between $63,000 and $63,400, with resistance from $64,500 to $66,000.

    Wintermute noted that some ETF demand may reflect arbitrage rather than direct bullish positioning. Analysts expect possible fourth-quarter catalysts from regulatory progress and renewed stablecoin growth.

  • Global Stock Markets Recap: How Major Indices Performed in 2026

    Global Stock Markets Recap: How Major Indices Performed in 2026

    Global stock markets in 2026 have experienced a dynamic year, with major indices reflecting diverse economic trends and sector-specific drivers. Here’s a concise overview of how the world’s top benchmarks have fared.

    S&P 500

    The S&P 500 continues to reflect the strength of leading U.S. companies, navigating market volatility while maintaining overall resilience. Investor confidence in corporate earnings and economic fundamentals has kept the index on a steady course.

    Nasdaq Composite

    Technology stocks remain key drivers of the Nasdaq’s performance throughout the year. Innovation in AI, cloud computing, and semiconductor sectors has fueled continued investor interest, though periodic pullbacks have occurred amid valuation concerns.

    Dow Jones

    The Dow Jones highlights steady performance from major industrial and blue-chip companies. Defensive sectors such as healthcare and consumer staples have provided stability, while cyclical industrials have benefited from infrastructure spending.

    Nifty 50

    India’s benchmark index continues attracting global investors through strong economic growth. Favorable demographics, digital transformation, and policy reforms have supported the Nifty 50’s upward trajectory, making it one of the best-performing emerging market indices.

    Sensex

    The Sensex remains supported by banking, IT, and manufacturing sector gains. Robust domestic consumption, coupled with export growth in technology services, has underpinned the index’s performance.

    FTSE 100

    The UK’s FTSE 100 reflects energy, financial, and multinational company performance. High commodity prices have boosted energy stocks, while a weaker pound has benefited exporters listed on the index.

    Nikkei 225

    Japan’s Nikkei continues benefiting from technology exports and corporate reforms. The Tokyo Stock Exchange’s governance improvements and a weaker yen have enhanced the competitiveness of Japanese exporters.

    Hang Seng

    Hong Kong’s Hang Seng remains influenced by Chinese economic developments. Regulatory shifts in mainland China and geopolitical tensions have created headwinds, but the index has shown resilience in select sectors such as technology and healthcare.

    Stay informed on global market trends by following our updates.

  • Wall Street Hits Fresh Records as Strong Earnings and Easing Geopolitical Tensions Fuel Five-Day Rally

    Wall Street Hits Fresh Records as Strong Earnings and Easing Geopolitical Tensions Fuel Five-Day Rally

    Wall Street opened higher on Wednesday, reaching record highs as strong corporate earnings and easing geopolitical concerns in the Middle East buoyed investor sentiment. The S&P 500 and Dow Jones Industrial Average both hit fresh intraday highs, extending a five-day rally.

    The S&P 500 rose 0.61% to 7,783.50 shortly after the opening bell. Meanwhile, the Dow advanced 450 points to 54,536.68, and the Nasdaq Composite added 0.41% to 26,694.42.

    US Stocks Extend Five-Day Rally

    US stocks continued their five-session winning streak, which began with renewed demand for technology and consumer shares. All three major indexes are on track for their strongest five-day performance since April 2025. Over the past week, the S&P 500 has gained more than 6%, the Dow has risen over 5%, and the Nasdaq has climbed more than 9%. In the previous session, the S&P 500 closed above 7,700 for the first time, while the Dow gained more than 900 points and secured another record close.

    Market breadth remained positive during early trading. On the New York Stock Exchange, advancing stocks outnumbered declining ones by 1.26 to one, and the ratio on the Nasdaq was 1.13 to one.

    Disney and Eli Lilly Lead Major Stock Moves

    Disney shares rose 2.9% after the company reported better-than-expected fiscal third-quarter profit, helping lift the Dow. Eli Lilly climbed 7.3% after beating second-quarter revenue and earnings estimates and raising its full-year revenue forecast. Healthcare led the S&P 500 sectors with a 1.9% gain.

    Arista Networks jumped 7.3% after forecasting third-quarter revenue above market estimates. Microsoft and Alphabet each gained about 1%, supporting the broader technology sector. However, Uber fell 5.5% after forecasting current-quarter adjusted earnings below estimates, and utilities lagged the broader market, losing nearly 1%.

    According to FactSet, more than 84% of S&P 500 companies have beaten earnings estimates this season, helping investors look past weaker economic data.

    SpaceX and AMD Fall as NVIDIA Rallies

    SpaceX shares dropped 12.5% following its first quarterly report since its June public listing. While the company nearly doubled revenue and narrowed operating losses, a sixfold increase in capital spending to $18.4 billion, largely for AI projects and infrastructure, raised concerns. Nic Puckrin, founder of Coin Bureau, described AI spending as “getting out of hand,” adding that companies showed “no signs of slowing down anytime soon.” AMD shares fell 6.5%, despite forecasting quarterly revenue above analyst estimates, as investors expected a stronger outlook after the stock had gained 142% this year.

    In contrast, NVIDIA rose 3.4% after Elon Musk confirmed that SpaceX would use its processors for AI infrastructure. Musk called NVIDIA’s product “the best AI computer” during the earnings call.

    Hormuz Hopes Support Wall Street

    Oil prices held near recent levels as investors monitored talks involving Iran, Oman, and the Strait of Hormuz. Brent crude rose 1% to $80.22 per barrel, while West Texas Intermediate futures gained 0.46% to $76.12. Prices rose after Houthi militants claimed an attack on a Saudi tanker in the Red Sea.

    Reuters reported that Iran and Oman were discussing a framework covering inbound ship traffic through Hormuz. However, regional sources questioned claims that an agreement was close. One source noted that “the concession has already been made regarding some form of control over Hormuz,” but other details still required negotiation.

    Jobs and Services Data Enter Focus

    US private employers added 44,000 jobs in July, according to ADP, below June’s 95,000 increase and the 75,000 forecast. Investors now await Friday’s official nonfarm payrolls report, which could affect expectations for Federal Reserve interest-rate policy in the coming months.

    Meanwhile, the ISM Services PMI reached 54.1 in July, compared with 54.0 in June, with a reading above 50 signaling expansion. The employment component fell to 47.4, its lowest level since March, while the prices index rose to 70.3, pointing to persistent service-sector inflation.

    Strong corporate earnings and easing geopolitical concerns have kept Wall Street’s record-breaking rally intact despite weak hiring data. Investors now look to Friday’s nonfarm payrolls report for fresh clues on the Federal Reserve’s next policy moves, with earnings momentum and AI-driven growth remaining key drivers of market sentiment.

  • Why Warren Buffett Touts Low-Cost S&P 500 ETFs as the Ultimate Wealth Builder

    Why Warren Buffett Touts Low-Cost S&P 500 ETFs as the Ultimate Wealth Builder

    Warren Buffett, one of the world’s most successful investors, has long advised the average investor to follow a simple investment strategy: invest in a low-cost S&P 500 index fund and hold it for the long term. Contrary to the idea that Buffett invests only in individual stocks, he believes most retail investors are better served by passive investing rather than trying to outperform the market.

    His insights have become especially relevant as exchange-traded funds (ETFs) continue to attract record inflows from investors seeking diversified, low-cost exposure to the US stock market.

    The Simple Investment Philosophy of Buffett

    Buffett has repeatedly said that most investors don’t need to research individual companies or try to beat professional managers. Instead, he recommends purchasing a low-cost S&P 500 index fund, which holds 500 of the largest publicly traded US companies. During Berkshire Hathaway’s annual meeting, he stated, “For most people, the best thing to do is to own the S&P 500 index fund.”

    His confidence is backed by a famous 2008 bet: Buffett wagered $1 million that an S&P 500 index fund would outperform a portfolio of five hedge funds over 10 years. The result was decisive—the S&P 500 delivered roughly 126% returns, while the hedge funds managed only about 36%.

    Why Low-Cost ETFs Stand Out

    Buffett frequently highlights the Vanguard S&P 500 ETF (VOO), which carries an expense ratio of just 0.03%—one of the lowest available. Over the past 10 years (as of late July 2026), VOO has generated a total return of about 303%. The ETF also provides instant diversification across sectors like technology, healthcare, financial services, consumer goods, energy, and industrials, reducing the risk of owning just a few stocks.

    The Power of Long-Term Compounding

    Buffett’s core rule is to let compound returns work. The S&P 500 has historically averaged about 10% annual returns over long periods, though yearly results vary. Disciplined investing and reinvestment in an S&P 500 ETF could grow an initial sum to over $1 million after 40 years, based on historical averages. Market analysts note that the S&P 500 has delivered positive total returns over every rolling 20-year period since 1919, underscoring the benefit of staying invested through market cycles.

    Why Buffett Prefers Passive Investing

    Despite decades of beating the market, Buffett admits it is extremely difficult to do so consistently. Most actively managed funds underperform the S&P 500 over the long term after expenses. That’s why Buffett has publicly stated he would invest 90% of his wife’s cash inheritance into a low-cost S&P 500 index fund and the remaining 10% into short-term government securities.

    Conclusion

    Buffett’s investment advice remains consistent: value low costs, diversify, invest regularly, and hold for the long term. For most people, a low-cost S&P 500 ETF offers a simple and proven path to building wealth. While advanced investors may succeed with individual stocks, Buffett’s passive investing mantra continues to be one of the most straightforward ways to achieve long-term financial security.

    Frequently Asked Questions

    1. Why does Warren Buffett recommend S&P 500 index funds? Buffett believes most investors cannot consistently beat the market. A low-cost S&P 500 index fund provides broad diversification, low fees, and long-term exposure to America’s largest companies.
    2. Which ETF does Warren Buffett recommend? Buffett has frequently highlighted the Vanguard S&P 500 ETF (VOO) because of its extremely low expense ratio, broad market exposure, and strong long-term performance.
    3. Are S&P 500 ETFs suitable for beginners? Yes. They offer instant diversification, passive management, and historically strong long-term returns, making them one of the simplest investment options for beginners.
    4. What is the biggest advantage of investing in an S&P 500 ETF? The biggest benefit is long-term wealth creation through diversification and compound growth, without the need to research or actively manage individual stocks.
    5. Can an S&P 500 ETF guarantee positive returns? No. Like all equity investments, S&P 500 ETFs can decline over shorter periods. However, history shows they have delivered strong returns over long investment horizons, making them popular among long-term investors.
  • Wall Street Hits New Highs as AI Stocks Surge and Oil Prices Slide

    Wall Street Hits New Highs as AI Stocks Surge and Oil Prices Slide

    The S&P 500 and Dow Jones Industrial Average reached record intraday levels on Tuesday, driven by strong earnings from AI-linked companies and optimism over potential US-Iran talks that pushed oil prices lower.

    The S&P 500 gained 0.58% to 7,644.56, its first intraday record since June. The Dow rose 647 points (1.22%) to 53,825.50, also hitting a new all-time high. The NASDAQ Composite added 1.16% to 26,213.57, supported by technology and semiconductor stocks. Wall Street has recovered from July losses, fueled by robust earnings from major tech firms like Amazon and Microsoft, which reinforced confidence in AI spending. The Philadelphia Semiconductor Index climbed about 4% as chip stocks rebounded.

    Palantir Technologies shares surged 17.4% after raising its annual revenue forecast, citing stronger demand for artificial intelligence services. CEO Alex Karp described the quarterly performance as “otherworldly” and linked growth to sovereign AI systems. Caterpillar shares rose 12% after reporting higher second-quarter profit and raising its annual revenue growth forecast, driven by demand from AI data center projects for power-generation equipment. The company also indicated tariff costs would be near the lower end of its earlier estimate.

    Oil prices fell as US Treasury Secretary Scott Bessent signaled progress in talks with Iran to reopen the Strait of Hormuz, stating there was “a chance” of an agreement within two days. West Texas Intermediate crude dropped about 4% to near $76 per barrel, while Brent crude fell to around $80. The S&P 500 energy sector declined 2.5% as crude prices slid, but lower oil costs eased concerns about transport and production expenses for other industries.

    Corporate earnings have broadly exceeded expectations, with 85.2% of S&P 500 companies beating analyst estimates—well above the long-term average of 67.5%. Investors remain focused on whether AI spending can generate sustainable revenue. Eric Parnell, Chief Market Strategist at Great Valley Advisor Group, noted that while AI earnings have performed well, the key question is sustainability. Coherent gained 14% and Lumentum rose 7.8% on reports of potential US limits on Chinese data center components. McDonald’s added 1.2% despite weak results, while Pfizer fell about 1% after its quarterly report. US job openings dropped to 7.36 million in June, below forecasts. Advancing shares outnumbered decliners on both major exchanges, with the NYSE at a 1.36-to-1 ratio and NASDAQ at 2.04-to-1. Investors also awaited SpaceX’s first earnings report since its public listing.