Tag: Technical Analysis

  • Meme Coin Market Cools: Dogecoin, Shiba Inu, and Pepe Slide as Traders Eye Support Levels

    Meme Coin Market Cools: Dogecoin, Shiba Inu, and Pepe Slide as Traders Eye Support Levels

    The meme coin market hit a wall on Tuesday as last week’s rally ran out of steam. Dogecoin (DOGE) pulled back after hitting heavy resistance, while Shiba Inu (SHIB) remained trapped under a long-standing descending trendline. Meanwhile, Pepe (PEPE) faced a wave of profit-taking from traders cashing in on its recent double-digit run. On-chain data and chart patterns are mixed, leaving traders questioning whether current support levels will hold.

    Dogecoin Tests Support After Resistance Rejection

    DOGE is feeling the heat after getting rejected at $0.0782, dropping 1.5% to sit below $0.0745 this Tuesday. If the decline continues, the next stop could be the yearly lows near $0.0695. The indicators present a mixed picture. The daily Relative Strength Index (RSI) is scraping 35, indicating heavily oversold conditions, while the Moving Average Convergence Divergence (MACD) still holds onto its July 3 bullish crossover, suggesting buyers haven’t completely left the building.

    Market analyst Ali Charts reported that Dogecoin’s network activity climbed to roughly 50,000 active addresses on July 5. The analyst noted, ‘Something is brewing,’ as higher address activity reflected stronger user participation across the network. Large investors holding more than one billion DOGE increased their combined holdings to 73.85 billion tokens. Although whale transactions dropped to 12 on Sunday, the broader accumulation trend remained intact.

    Derivatives Data and Technical Levels Stay in Focus

    Coinglass data showed Dogecoin derivatives trading volume rose 31% to $1.26 billion, while open interest edged down 0.32% to $1.04 billion, indicating only limited new leveraged positions entered the market. Technical indicators presented a balanced picture. The RSI registered 51.52, reflecting neutral momentum, while the Chaikin Money Flow indicator remained positive at 0.08, pointing to modest but steady capital inflows.

    Analyst Jesse Peralta said DOGE continued trading inside an ascending channel and approached the channel’s lower boundary. According to the analysis, the $0.075 to $0.076 range now serves as the primary support zone. Maintaining support above $0.075 could expose the next upside target at $0.081. After that, analysts identified $0.090, $0.10, and $0.12 as potential recovery levels. A break below $0.075 could shift attention toward the $0.070 to $0.068 support zone. Market technician Celal Kucuker also reported that Dogecoin broke above its long-term downtrend line before retesting it. A successful retest could create a path toward the $0.12 target.

    Shiba Inu Faces Trendline Resistance While PEPE Retreats

    Shiba Inu gained more than 6% during the previous week before testing a descending trendline near $0.0000045. That level also aligned closely with daily resistance. SHIB failed to close above the resistance area on Sunday. It then declined more than 3% over the following two days and traded below $0.0000043 on Tuesday. If the correction continues, SHIB could revisit its yearly low around $0.0000040. Like Dogecoin, SHIB displayed mixed technical signals. Its RSI remained below the neutral level, while the MACD continued showing a bullish crossover that suggested improving underlying momentum.

    Besides the weakness in meme coins, the broader cryptocurrency market expanded by 1.04% to $2.19 trillion during the previous 24 hours. Bitcoin, Ethereum, XRP, and Solana also recorded modest gains during the same period, while PEPE pulled back as traders secured profits after last week’s strong advance.

    What’s Next?

    Dogecoin, Shiba Inu, and Pepe retreated after last week’s rally as buying momentum eased. DOGE and SHIB approached key support levels while technical indicators delivered mixed signals. Meanwhile, whale accumulation, network activity, and broader market strength remained important factors for traders monitoring the next price movement.
  • Solana Unified Trading Interface Teaser Drives Market Buzz as Network Breaks Activity Records

    Solana Unified Trading Interface Teaser Drives Market Buzz as Network Breaks Activity Records

    The Solana community is buzzing after a teaser from @jtx_trade hinted at a unified trading interface that would aggregate all markets on the blockchain. While the post lacked technical specifics, traders quickly speculated about potential shifts in liquidity and trading dynamics. The broader crypto market remains sideways, but Solana’s underlying network metrics continue to strengthen as the community awaits official details.

    Trading Surface Teaser Ignites Speculation

    The announcement suggests Solana is developing a single trading interface covering all blockchain markets, aiming to simplify access and improve efficiency. However, with no launch window or feature specifications revealed, traders are holding off on major moves. Reported trading volume has flatlined, reflecting a wait-and-see approach. Beyond the platform tease, Solana is expanding into stablecoins, AI-driven payments, and other decentralized applications, with the Solana Foundation leading discussions on stablecoins in emerging markets.

    Network Activity Hits New Milestones

    Solana achieved a historic milestone: weekly non-vote transactions exceeded one billion for the first time, excluding validator consensus votes and representing genuine user activity, dApp interactions, and trading operations. Active wallet addresses surged from 16.8 million to 29.7 million in two weeks—a 76.8% increase. Solana also ranked first among Layer 1 and Layer 2 blockchains in both 24-hour and seven-day DApp revenue, and led decentralized exchange volume across those periods. It secured second place globally in total trading activity for the second consecutive week, processing $12.25 billion across centralized and decentralized exchanges, surpassing Bybit’s $10.57 billion.

    Technical Outlook: Support and Targets

    Crypto analyst Michaël van de Poppe noted that Solana has returned to its established trading range, with a modest pullback possible before an upward move. He identified $75–$77 as critical support; holding that zone could open a path toward $100 and potentially $120. SOL is trading above its 20-day, 50-day, and 100-day moving averages, and the MACD histogram remains bullish. However, momentum has cooled after a 15% gain the prior week.

    What’s Next for Solana?

    With a unified trading interface teased alongside record-breaking network activity and growing ecosystem adoption, Solana remains in the spotlight. Rising active wallets and leading DEX volumes, combined with bullish technical signals, have traders focused on the next platform update to gauge future momentum.

  • Dogecoin 2026 Price Forecast: Can DOGE Surpass Key Resistance Levels?

    Dogecoin 2026 Price Forecast: Can DOGE Surpass Key Resistance Levels?

    Key Takeaways

    • DOGE faces major resistance between $0.088 and $0.10.
    • DogeOS development could improve Dogecoin’s long-term utility.
    • Analysts expect $0.12–$0.22 if market conditions remain favorable.

    Dogecoin (DOGE) continues to attract attention in 2026 as one of the best-known cryptocurrencies. What started as a meme coin has become a major digital asset with a large community and regular market activity. Many investors now watch Dogecoin because of its strong brand, active trading, and growing ecosystem.

    The biggest question this year is whether DOGE can move above an important resistance level and begin a stronger upward trend. Market experts believe this price zone could decide the next major move for the coin.

    Current Dogecoin Price Trend

    In 2026, Dogecoin has remained within a stable price range for most of the time. As per the latest available market data, the price of Dogecoin has been within the range of $0.07 and $0.10. This suggests buyers and sellers remain cautious as they wait for a clearer market direction.

    The range of $0.088 and $0.10 has become quite difficult for DOGE to overcome successfully. This is because every time the price goes to this level, it encounters enormous selling pressure. If it succeeds in crossing this level, then there will be chances of more buyers coming in and gaining market confidence.

    There is an increase in the trading volume during the recent uptrends. It suggests that the buyers are buying DOGE every time it approaches important support levels. The technical indicators suggest that the market has become more balanced during the recent weeks, thereby opening up chances for a breakout anytime soon.

    Why Resistance Matters

    Resistance is a price level where many traders decide to sell their holdings. For Dogecoin, the first important resistance sits near $0.088, close to its 50-day moving average. This level has stopped several recovery attempts during 2026.

    The next major barrier is $0.10, a price that many traders closely watch. If DOGE closes above this level and stays there, the market could become much more positive.

    Some analysts believe that a strong breakout could open the path toward $0.12 to $0.15. On the other hand, if buyers fail once again, the price could return to the support area near $0.07.

    Recent News Supports Long-Term Growth

    Dogecoin is back in the spotlight due to some recent developments on the Dogecoin blockchain. One of the major upgrades being made is an additional layer of smart contracts called DogeOS, which will create many new possibilities for utilizing Dogecoin in real-world applications.

    DogeOS also received additional funding for applications in Decentralized Finance (DeFi), Web3 gaming, and AI. These developments could help Dogecoin evolve beyond a payment-focused cryptocurrency into a broader blockchain ecosystem.

    Additionally, after Bitcoin has shown signs of a resurgence, the entire Cryptocurrency Market also tends to recover along with Bitcoin. With Bitcoin moving to new highs, the entire market and therefore Doge would be positively affected.

    While there are now hundreds of new meme coins in circulation, Dogecoin still represents about half of the total value of all meme coins. Dogecoin continues to be considered one of the brightest stars in the universe of memecoins.

    Institutional Investors Remain Careful

    Recent reports show that some Dogecoin investment products recorded small capital outflows. This means a few institutional investors reduced their exposure despite positive network developments.

    At the same time, blockchain data shows that several large holders purchased millions of DOGE during price declines. This type of buying often reflects confidence in future price growth. Similar activity has supported previous market recoveries, although no pattern guarantees the same result every time.

    Technical Signals Show Better Momentum

    The Relative Strength Index (RSI) remains close to neutral, which means the coin is neither heavily overbought nor oversold. The MACD indicator also points toward improving momentum.

    Higher trading volume during price increases also supports the bullish case. Strong volume often confirms that buyers believe the price can continue to rise. However, many analysts still wait for several daily closes above resistance before they confirm a true breakout.

    Risks Still Exist

    Dogecoin has an inflationary supply because billions of new coins enter circulation every year. This constant supply creates extra selling pressure and requires steady demand to support higher prices.

    The coin also depends heavily on overall crypto market sentiment. A decline in Bitcoin or negative economic news could quickly affect DOGE.

    Competition from newer blockchain projects also remains strong. Many modern networks offer advanced features, which means Dogecoin must continue to improve its ecosystem to stay competitive.

    Why This Matters

    Dogecoin dominates half the meme coin market. Its ability to break resistance and add real-world utility via DogeOS dictates whether retail capital rallies across the broader crypto landscape or pulls back entirely.

    Dogecoin Forecast for 2026

    Current market forecasts suggest Dogecoin could trade between $0.12 and $0.22 during 2026 if market conditions remain favorable. However, cryptocurrency prices can change very quickly, so forecasts may also change.

    For this bullish outlook to become reality, Dogecoin must first break above the $0.088 to $0.10 resistance zone. Continued ecosystem development, stronger investor confidence, and better overall crypto market conditions would also support higher prices.

    At present, Dogecoin stands at an important point. Technical indicators have improved, new development projects continue to move forward, and buyer interest has returned. A successful move above resistance could mark the beginning of a stronger rally. Until that happens, the market will likely remain cautious and closely follow both Bitcoin’s direction and progress within the Dogecoin ecosystem.

    FAQs

    1. What is the main resistance level for Dogecoin in 2026?

    The primary resistance zone sits between $0.088 and $0.10. Breaking above this heavily watched psychological barrier is crucial for sparking a sustainable upward market trend.

    2. Why is DogeOS important for Dogecoin?

    DogeOS introduces smart contracts to the blockchain. This expands Dogecoin beyond a basic payment method into utility-focused sectors like DeFi, Web3 gaming, and artificial intelligence.

    3. Can Dogecoin reach $0.15 in 2026?

    Yes, if buyers clear the $0.10 resistance with strong trading volume, analysts expect the price could quickly rally toward a target range of $0.12 to $0.15.

    4. What are the biggest risks for Dogecoin?

    An inflationary supply creates constant selling pressure. Additionally, DOGE remains highly vulnerable to broader crypto market downturns and intense competition from newer utility blockchains.

    5. What could trigger a Dogecoin rally?

    A decisive daily close above $0.10, sustained ecosystem development, returning institutional interest, and an overall market resurgence led by Bitcoin could trigger a strong rally.

  • XRP Price Analysis: Will the $1 Support Level Hold or Break in 2026?

    XRP Price Analysis: Will the $1 Support Level Hold or Break in 2026?

    XRP has reached one of the most pivotal points of 2026. The $1 price level has become the main area that traders and investors now watch daily. This level has historically acted as strong support, with many buyers entering around this price. After several months of volatility, XRP now sits close to this critical mark. The coming weeks could determine whether the token begins a new recovery or suffers a deeper decline.

    As of early July 2026, XRP trades just above $1 after a nearly 20% drop during June. This decline occurred despite Ripple achieving several positive milestones this year. The broader cryptocurrency market remains cautious, with many investors shifting to safer assets, reducing demand for digital currencies.

    Why the $1 Support Level Matters

    The $1 level is more than a round number. It has become a strong psychological support area because buyers have stepped in near this price multiple times before. If XRP stays above $1, confidence could gradually return, potentially pushing the price toward $1.15 and then testing the $1.20 resistance.

    However, if XRP falls below $1 and closes there for several days, more selling may follow. Many traders place stop-loss orders near this support zone. Once triggered, the price could drop quickly, with the next major support near $0.80 becoming the likely target.

    Ripple Shows Strong Business Growth

    Despite XRP’s price struggles, Ripple has made solid progress in 2026. The company expanded its payment network and continued developing new products for banks and financial institutions. Activity on the XRP Ledger has increased significantly, with daily transactions now reaching nearly three million. More businesses use the network for tokenized real-world assets, automated market maker pools, and RLUSD settlements. Tokenized assets on the blockchain now represent hundreds of millions of dollars, demonstrating that Ripple continues to build useful services even when XRP’s price performance remains weak.

    XRP ETFs Bring Institutional Money

    One of the biggest developments for XRP came with the launch of spot XRP exchange-traded funds (ETFs) in late 2025. These products have attracted around $1.48 billion in total inflows, opening the door for more institutional investors to gain exposure to XRP without directly buying the cryptocurrency. This steady flow has supported market confidence for much of the year. However, recent sessions recorded the first notable outflows after months of steady demand, indicating that large investors have also become more cautious amid recent market weakness.

    Regulation Could Shape XRP’s Future

    Government rules remain a major factor affecting XRP. Investors closely watch new cryptocurrency laws in the United States. Clear regulations could make it easier for financial companies to invest in digital assets with greater confidence. Several proposals have raised hopes for better legal clarity during 2026, but delays in new legislation have tempered market excitement. Many experts believe stronger regulatory support could attract more institutional money into XRP, though market conditions and the overall economy will still play a major role in future price movements.

    Technical Charts Show Mixed Signals

    Technical indicators suggest selling pressure has started to ease. The Relative Strength Index (RSI) has recovered from oversold levels, often meaning sellers may lose strength after a sharp decline. Trading volume has also decreased during recent price drops, which can indicate fewer traders are willing to sell at current prices. However, XRP still trades below several important moving averages, so analysts have not confirmed a long-term bullish trend.

    The first resistance area stands between $1.08 and $1.10. If buyers push above this range, XRP may move toward $1.18 and then $1.20. A stronger rally could later send the token into the $1.30 to $1.45 range. Conversely, failure to defend $1 may increase selling pressure and pull the price closer to $0.80.

    The Overall Crypto Market Still Controls XRP

    Ripple’s business growth has improved during 2026, but XRP still follows the direction of the wider cryptocurrency market. Bitcoin and other major digital assets have faced heavy pressure as investors remain cautious about global economic conditions and interest rate expectations. This cautious mood has reduced the amount of money entering cryptocurrencies. Positive news about Ripple has helped support confidence but has not been strong enough to create a lasting rally. Many market experts believe XRP needs both stronger market sentiment and continued business growth before a major recovery becomes possible. Institutional demand through ETFs has provided some support, but that alone may not push prices much higher unless the overall crypto market also turns positive.

    Why This Matters

    XRP hovering near the $1 psychological threshold represents a make-or-break crossroads for 2026. While Ripple utility expands via three million daily ledger transactions and $1.48 billion in spot ETF inflows, broader macroeconomic risk aversion threatens a breakdown toward $0.80 if this pivotal support fails.

    Final Outlook for XRP in 2026

    The rest of 2026 could become one of the most important periods for XRP. The $1 support level now stands at the center of market attention. If buyers keep control of this area, XRP could slowly recover toward $1.20 and later move into the $1.30 to $1.45 range if the broader cryptocurrency market improves. A clear break below $1 would weaken the technical outlook and may open the door for a decline toward $0.80. Ripple continues to report strong business growth, higher network activity, and rising institutional interest through XRP ETFs. These positive developments support the long-term outlook. However, short-term price movement still depends on investor confidence and the direction of the overall cryptocurrency market.

    Frequently Asked Questions

    1. Why is the $1 price mark so critical for XRP right now?

    The $1 mark is a major psychological and technical support line. Holding above it keeps a recovery toward $1.20 alive, whereas closing underneath it risks triggering mass stop-loss selling orders.

    2. How have the newly launched spot XRP ETFs impacted the market?

    Spot ETFs have pulled in $1.48 billion in net inflows since late 2025. These investment funds provide solid underlying structural demand by giving large institutional investors direct exposure to XRP.

    3. Is Ripple’s real-world business adoption actually expanding?

    Yes. Independent of price, the XRP Ledger averages nearly three million daily transactions. This operational growth is driven by automated market maker pools, tokenized real-world assets, and RLUSD stablecoin settlements.

    4. What happens from a technical standpoint if the $1 support level breaks?

    Consecutive daily closes below $1 would invalidate the current market structure. This technical failure would give short-sellers total control, likely exposing the cryptocurrency to a deeper correction toward $0.80.

    5. What macro factors are keeping XRP from staging a major breakout?

    XRP remains tied to the broader crypto market. Digital assets face persistent selling pressure amid global economic uncertainty, and cautious interest rate expectations have reduced capital flowing into riskier assets.

  • Indian Stock Market Outlook: Nifty 50 Targets 24,500, Sensex Holds Key Support at 76,700

    Indian Stock Market Outlook: Nifty 50 Targets 24,500, Sensex Holds Key Support at 76,700

    Indian stock markets are expected to open on a muted note Monday amid mixed global cues. GIFT Nifty is trading at 24,332.5, indicating a flat start with a discount of 22.5 points from the previous Nifty futures close.

    On Friday, the Sensex rose 261.79 points (0.34%) to settle at 77,763.91, while the Nifty 50 advanced 95.15 points (0.39%) to finish at 24,270.85. Broader indices underperformed, with the Nifty midcap index ending marginally lower and the smallcap index flat.

    The Indian rupee opened flat at Rs. 95.23 per dollar on Monday against Friday’s close of Rs. 95.22. Foreign institutional investors (FIIs) turned net buyers on July 3, purchasing shares worth Rs. 1,355.33 crore, while domestic institutional investors (DIIs) were net sellers to the tune of Rs. 1,953.89 crore.

    Sensex Outlook

    Technically, the Sensex rose around 1% last week, forming a bullish candle on weekly charts with a higher bottom formation—a largely positive sign. “The short-term market texture is positive, but the ideal strategy for traders would be to buy on dips and sell on rallies. On the downside, 77,300 and 76,700 are key support zones, while 78,400-79,000 are key resistance areas. Below 76,700, sentiment could change, potentially retesting 76,100-75,900,” said Amol Athawale, VP Technical Research, Kotak Securities.

    Nifty 50 Outlook

    Nifty 50 has strengthened its short-term trend after closing above last month’s high. The index advanced for three consecutive sessions and finished above the critical 24,261 level. Although Friday’s trading formed a bearish candle as the market gave up some gains, the broader short-term trend remains positive.

    Bajaj Broking Research noted that “the index during the current week generated a bullish crossover of the 20- and 50-day EMA, highlighting continuation of positive momentum. In the coming session, Friday’s gap area will act as immediate support; holding above that signals an extension of the up move toward 24,380 and 24,500.” The brokerage expects Nifty to gradually move toward the 24,500-24,600 zone in the near term. A decisive break above 24,600 could target 24,800. Immediate support is near 24,050, with stronger support between 23,800 and 23,900.

    Bank Nifty Outlook

    On Friday, Bank Nifty declined 93.15 points (0.16%) to close at 57,938.50, forming a small bearish candle. For the week, the index ended with a loss of 0.41% and formed a small bearish candle on the weekly timeframe with a long lower shadow, highlighting indecisiveness.

    Bajaj Broking Research said, “A move above last week’s high of 58,400 will open further upside toward 59,200 and 60,000 in the coming weeks, being the 138.2% and 150% external retracement of the previous decline from 57,456 to 52,783. Failure to move above last week’s high is likely to keep the index consolidating within the 57,000-58,400 range.” The brokerage identified the 57,000-56,800 region as key support for Bank Nifty, adding that the broader outlook for banking stocks remains positive and any short-term consolidation could offer accumulation opportunities.

    Disclaimer: This article is for informational purposes only and does not constitute investment advice. Readers should conduct their own research before making any investment decisions.

  • Leveraging Crypto Market News for Smarter Trading Decisions

    Leveraging Crypto Market News for Smarter Trading Decisions

    In the fast-paced world of cryptocurrency, traders require timely and accurate information to make informed decisions. Crypto market news provides critical insights into price movements driven by economic indicators, institutional flows, and shifting sentiment. By integrating fundamental and technical analysis with robust risk management, traders can reduce impulsive behavior and improve their overall strategy.

    Why Crypto Market News Matters

    All crypto market movements are influenced by supply and demand, investor confidence, and the broader economic outlook. While technical charts reveal price patterns, crypto market news explains the underlying factors driving those patterns. Positive developments such as institutional adoption, blockchain upgrades, regulatory clarity, and strategic partnerships foster investor optimism, leading to buying pressure. Conversely, negative events like exchange violations, fraud investigations, restrictive regulations, or economic weakness can trigger selling. Since the crypto market operates 24/7, new information is absorbed almost instantly, making up-to-date news essential for identifying opportunities as sentiment shifts.

    Macroeconomic Events Have a Growing Impact

    Cryptocurrencies are no longer isolated from the global economy. Digital asset prices are increasingly sensitive to central bank decisions, employment data, interest rates, and inflation. For example, the U.S. Core Personal Consumption Expenditures (PCE) inflation report for September remained unchanged at 3.4%, allowing the Federal Reserve to maintain a restrictive policy. Higher interest rates can reduce liquidity and make investors less willing to risk capital on assets like cryptocurrencies. Institutional activity also plays a role: Bitcoin ETFs have experienced net outflows as some investors reduce holdings amid a strengthening economy. These macroeconomic signals help traders gauge whether the market is being fueled by institutional buying or selling.

    Market Sentiment Can Reveal Trading Opportunities

    Investor psychology is a key driver of crypto price movements. The Crypto Fear and Greed Index is a simple tool that measures overall market confidence. Low readings indicate widespread fear, while high readings suggest optimism. However, sentiment indicators are most useful when combined with market news. For instance, headlines about positive economic data, rising trading volume, and ETF inflows provide stronger confirmation than isolated news. Traders should evaluate multiple indicators to get a more accurate picture before entering or exiting trades.

    Combine Fundamental and Technical Analysis

    Successful traders know that no single indicator tells the whole story. Fundamental analysis involves studying economic trends, regulations, blockchain improvements, and institutional adoption. Technical analysis examines support and resistance levels, trend direction, volume, and momentum. These two approaches complement each other, making trading decisions more reliable. For example, a favorable announcement accompanied by volume growth and a confirmed breakout is much more significant than either signal alone. This combination also helps traders avoid relying on rumors or market volatility.

    Choose Reliable Sources for Crypto Market News

    Not all news is created equal. Accurate information is critical for crypto trading. Trustworthy sources include established financial publications, official blockchain announcements, exchange updates, economic reports, and institutional research. Platforms like X, Reddit, Telegram, and Discord may break news first, but traders should always verify facts before making investment decisions. Using credible sources helps differentiate important news from mere speculation.

    Risk Management Should Never Be Overlooked

    Even the most thorough market analysis cannot eliminate uncertainty. Risk management is a cornerstone of profitable trading. Strategies such as position sizing, diversification, leverage control, and stop-loss orders protect trading capital during volatile periods. When major news breaks, it is often best to wait for confirmation before reacting to rapid price changes.

    Conclusion

    Cryptocurrency remains in its developmental stage, and market updates are vital for traders. Economic indicators, institutional capital flows, government regulations, blockchain innovation, and investor sentiment all influence the direction of the crypto market. By pairing timely news with disciplined risk management, fundamental analysis, and technical analysis, traders can better navigate changing conditions and identify opportunities while remaining mindful of the inherent risks.

  • Bitcoin Price Analysis: Q2 2026 Decline and Q3 Outlook Amid Fed Rate Fears and ETF Outflows

    Bitcoin Price Analysis: Q2 2026 Decline and Q3 Outlook Amid Fed Rate Fears and ETF Outflows

    Bitcoin (BTC) entered the third quarter of 2026 under significant pressure after a weak first half of the year. The cryptocurrency dropped 14.20% in Q2 and declined 22.2% in the first quarter, ending the first half with back-to-back losing quarters for the first time since 2022. A combination of macro factors, ETF sell-offs, and technical breakdowns weighed on the market.

    Q2 Recap: From Strength to Weakness

    Q2 started on a strong note, with Bitcoin trading around $68,000 and surging over 20% to a May high of $82,833. The rally coincided with strength in the Nasdaq 100 and renewed interest in technology stocks. However, Bitcoin failed to maintain momentum and could not break through resistance between $81,000 and $83,500. The bull market ended near the trend-channel resistance at $83,000 as well as the 200-day moving average.

    Inflation and Fed Shift Hit Bitcoin

    The more significant turnaround occurred following stronger-than-expected April US CPI and PPI data, which cast doubt on whether inflationary pressures were still persistent. This changed market sentiment from rate cuts to possible rate hikes and negatively affected Bitcoin, gold, and silver. Bitcoin subsequently succumbed to leveraged and institutional selling and dropped to approximately $59,100 in early June. A hawkish May meeting by Fed Chair Kevin Warsh helped push Bitcoin below $58,000, just near $57,735 early in Q3.

    US Jobs Data Provides Some Breathing Room

    Softer US labor market data has now slightly eased rate-hike expectations. Nonfarm payroll figures for April and May were revised down by a combined 74,000 jobs. June nonfarm payroll growth was expected at 110,000 but came in at just 57,000. Private jobs also increased by 98,000, less than the anticipated 118,000, according to ADP data.

    “The lower-than-expected jobs number portends less likelihood of potential rate hikes later this year. As we know, gold tends to perform better in lower interest rate environments,” said David Meger, director of metals trading at High Ridge Futures. The CME FedWatch Tool now reflects almost a 50% probability of a September rate hike, down from 60% before the data.

    Why This Matters

    For the first time since 2022, Bitcoin has opened the year with back-to-back losing quarters. This technical breakdown, cemented by a newly hawkish Federal Reserve under Chair Kevin Warsh and severe ETF outflows, threatens to flip 2026 into a structural bear market unless macro liquidity provides a rapid turnaround.

    Technical Outlook for Q3

    BTC closed below the 200-week moving average near $62,444 for the first time since October 2023. This has raised the chances of a further decline toward the $50,000-$52,000 support zone. The initial test of strength for bulls would be pushing above the mid-June $67,253 level. If BTC is to make a recovery, a break above $75,203 is required, where its 200-day moving average is located.

    The 2018-2022 period is the only other cycle in which Bitcoin began the year with two consecutive losing quarters. Both became bear market years. It does not guarantee it will repeat in 2026, but sluggish demand from ETFs, soft on-chain activity, a strengthening dollar, and capital flow toward AI stocks mean Q3 could be difficult unless Bitcoin gets a strong start.

    Key Levels to Watch in Q3

    • Downside support: $50,000–$52,000
    • First resistance: $67,253
    • Major resistance: $75,203 (200-day moving average)
    • 200-week moving average: $62,444 (now acting as resistance)

    Frequently Asked Questions

    Why did Bitcoin fall in Q2 2026?

    Bitcoin fell 14.20% in Q2 after failing to sustain gains near the $81,000-$83,500 resistance zone. Stronger US inflation data, Fed rate-hike fears, ETF outflows, and leveraged selling added pressure.

    What was Bitcoin’s highest level in Q2?

    Bitcoin started Q2 near $68,000 and rallied more than 20% to a May high of $82,833. However, the rally stalled near trend-channel resistance and the 200-day moving average.

    Why did US inflation data hurt Bitcoin?

    Stronger-than-expected US CPI and PPI data reduced hopes of Federal Reserve rate cuts. That pushed markets toward rate-hike expectations, hurting risk assets such as Bitcoin, gold, and silver.

    Is Bitcoin entering a bear market in 2026?

    Bitcoin has posted back-to-back quarterly losses in Q1 and Q2, a pattern previously seen in difficult bear-market years like 2018 and 2022. This does not confirm a repeat, but weak ETF demand, soft on-chain activity, and a strong dollar keep Q3 risks elevated.

  • Dogecoin Struggles Below Key Averages as Weekly Death Cross Looms

    Dogecoin Struggles Below Key Averages as Weekly Death Cross Looms

    Dogecoin traded lower on July 5 as bearish technical signals weighed on market sentiment, even as network activity showed signs of growth. DOGE was down 1.37% over 24 hours at $0.0758, trailing a slightly positive Bitcoin market. Traders now focus on whether the meme coin can hold nearby support or face another move lower.

    Dogecoin Price Weakens Below Key Moving Averages

    Dogecoin traded below major moving averages as short-term momentum stayed weak. The token remained under its 30-day simple moving average at $0.0809 and its 200-day simple moving average at $0.1032. Its 14-day RSI stood at 41.65, showing that sellers still controlled near-term direction.

    The key level for traders is the daily pivot near $0.0778. A move back above that mark may ease immediate selling pressure. However, failure to reclaim it keeps attention on the 7-day SMA near $0.0742. A break below that area could put the $0.072 to $0.074 zone back in focus.

    Weekly Death Cross Raises Market Caution

    Dogecoin’s weekly chart is drawing attention as its 50-week moving average moves closer to the 200-week moving average. If the 50-week average crosses below the 200-week average, the chart would confirm a weekly death cross. This setup has not appeared on DOGE’s weekly chart since February 2023.

    Market watchers often view a death cross as a sign of weaker momentum. Still, the past reaction was mixed. After the February 2023 death cross DOGE did not record a sharp collapse. Instead, the price moved sideways for months. That history has made traders cautious about treating the signal as a direct price call.

    Analysts have also pointed to earlier weekly crossovers. Dogecoin saw a golden cross in February 2021 before its major rally to an all-time high near $0.74. Another golden cross appeared in late 2024 before DOGE reached $0.48 in December that year. Even so, those past moves do not confirm how the current setup will play out.

    Active Addresses Rise, but Price Response Stays Unclear

    Meanwhile, Dogecoin’s on-chain data showed stronger network activity. Analyst Ali Martinez said Dogecoin active addresses rose to nearly 50,000, adding, ‘something is brewing.’ Glassnode data shared in the post showed active addresses rising from about 36,000 on June 24 to nearly 48,000 on July 1.

    The figure later eased but held near 44,000, showing that network use remained above late-June levels. Active addresses measure unique wallets taking part in transactions or transfers. A rise in this metric can show broader network use, but it does not always lead to price gains.

    The data from Martinez drew attention, yet the market response remained cautious. “Something is brewing” points to rising activity, but it does not confirm accumulation or a trend reversal. Traders still need price confirmation especially while DOGE trades below key moving averages.

    Derivatives data also added pressure. A $723,000 long liquidation on Binance showed that leveraged buyers faced stress as DOGE moved lower. At the same time, Dogecoin ETFs logged a third straight week of net outflows, suggesting softer demand for meme coin exposure.

    For now, Dogecoin’s near-term path depends on the $0.0778 pivot and the $0.0742 support area. Holding support may keep the price inside its current range. A close below support, along with a confirmed weekly death cross, could extend bearish pressure in the DOGE market.

  • XRP Price Outlook for July 2026: Key Levels, ETF Inflows, and Regulatory Hurdles

    XRP Price Outlook for July 2026: Key Levels, ETF Inflows, and Regulatory Hurdles

    July 2026 has become a pivotal month for XRP as the cryptocurrency attempts to recover from a sharp June decline. Currently trading between $1.04 and $1.09, XRP is holding above the critical $1.00 support level. Market analysts are closely watching whether the token can break resistance at $1.10 to open a path toward $1.40–$1.60.

    June Correction and Market Pressure

    June was a difficult month for XRP holders. The token fell from around $1.30 to nearly $1.04, a 22% loss, and now sits about 70% below its 2025 peak near $3.65. Historically, July has been a positive month for XRP, with average gains close to 10%, offering some hope for a recovery if sentiment improves.

    Institutional Demand Remains Strong

    Despite the price drop, institutional investors continue to pour money into XRP-focused exchange-traded funds. XRP spot ETFs have recorded eight consecutive weeks of positive inflows, totaling approximately $1.47 billion. This sustained institutional buying signals confidence in XRP’s long-term value, even amid short-term weakness.

    Whale Accumulation and Network Activity

    On-chain data reveals that large XRP holders, or whales, have been quietly accumulating. Exchange outflows jumped nearly 200% in late June, indicating that investors are moving tokens to private wallets rather than selling. Additionally, new wallet creation has hit a three-month high, suggesting fresh market interest. Lower exchange supply often supports price recovery when demand rises.

    Regulatory Developments in Focus

    The proposed CLARITY Act in the United States could be a game-changer for XRP. This legislation aims to provide clear legal treatment for digital assets, including XRP. A positive outcome would boost institutional confidence and attract capital, while delays or negative decisions could trigger volatility. Regulatory uncertainty has long weighed on XRP, making this month’s developments crucial.

    Technical Levels to Watch

    The immediate support floor is $1.00; losing this level could lead to a decline toward $0.93 or even $0.80. On the upside, breaking above $1.10 is the first hurdle, followed by $1.25. If bullish momentum returns, analysts see potential for a move to $1.50.

    Price Scenarios for July 2026

    • Neutral: XRP trades in the $1.00–$1.20 range without a strong catalyst.
    • Bearish: A break below $1.00 could push the token to $0.85–$0.90.
    • Bullish: Successful breakout above $1.10 could lead to $1.40–$1.60.

    Broader forecasts still suggest XRP could finish 2026 between $2.00 and $2.80 if the crypto market recovers in the second half of the year.

    Final Outlook

    July 2026 is a make-or-break month for XRP. While retail fear lingers after June’s drop, relentless institutional ETF inflows and aggressive whale accumulation indicate that major players are betting on a rebound, especially with potential regulatory clarity from the CLARITY Act. The next few weeks will determine whether XRP can rally or face further correction.

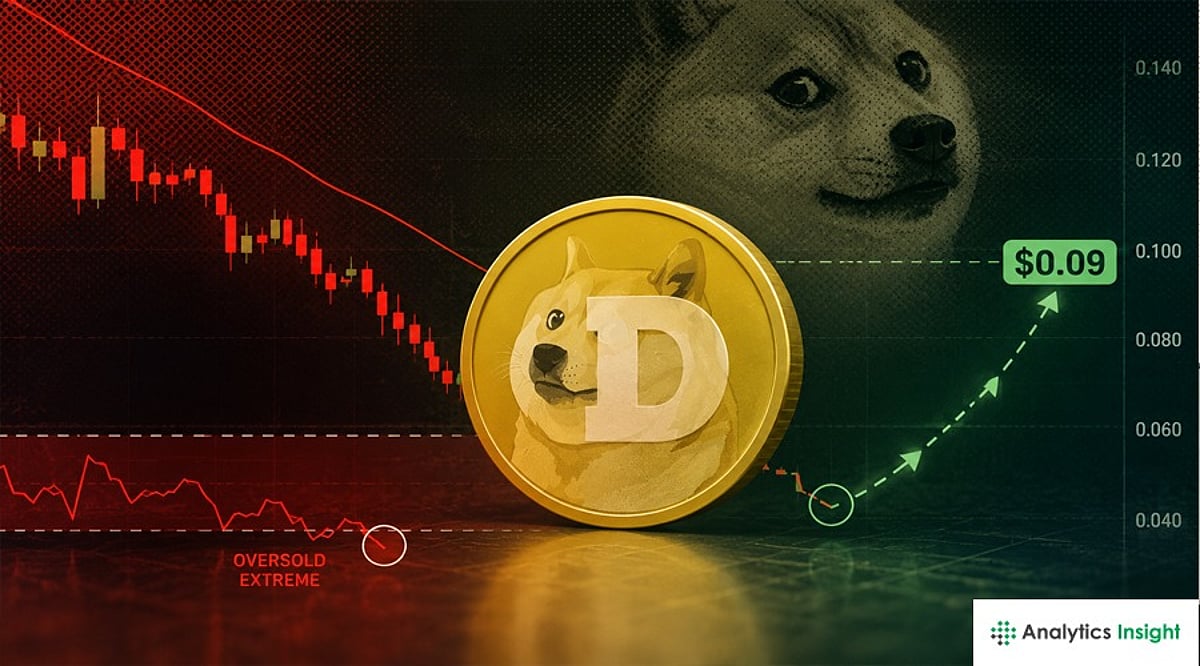
  • Dogecoin Approaches Make-or-Break $0.069 Support as Oversold Signals Intensify

    Dogecoin Approaches Make-or-Break $0.069 Support as Oversold Signals Intensify

    Dogecoin (DOGE) traded near $0.0714 on Tuesday, with sellers keeping the meme coin below every major moving average while oversold readings suggest downward momentum may be losing steam. The $0.069 support level now stands as the key threshold for a near-term recovery or a deeper slide.

    DOGE Remains Trapped Below Key Averages

    DOGE stayed below its 7-day, 20-day, 50-day, and 200-day moving averages, which sat near $0.07, $0.08, $0.09, and $0.10, respectively. This orderly sequence keeps the broader trend firmly bearish rather than sideways. The price has remained under the 20-day average for several weeks, limiting evidence of a sustained reversal.

    Meanwhile, the Relative Strength Index (RSI) dropped to 21.67, while stochastic readings hit 11.85 (%K) and 9.48 (%D). Bollinger %B stood at 0.12, placing the price close to the lower band. The MACD histogram moved to zero, signaling that downward momentum has started to decelerate.

    Thin Volume Exposes the Rebound Setup

    The latest intraday high reached $0.0725, marking the first recovery hurdle. Technical levels in the supplied analysis placed the 20-day average and Bollinger midline near $0.08. At the same time, Binance spot volume hovered near $53 million, while open interest declined 1.85% over 24 hours — indicating limited new leverage entering the market.

    Immediate order flow remained bearish. Sellers executed about $167 million against $128 million from buyers during the latest hour, producing a taker ratio of 0.77. Positioning data showed 68.9% of retail traders and 73.7% of top traders holding long exposure. The analysis identified this concentration as a risk if another decline triggers forced liquidations.

    Funding remained near neutral at 0.0090%. The absence of negative funding suggests the leverage reset has not yet reached full capitulation.

    $0.069 Close Shapes DOGE Recovery Targets

    CoinCodex projects DOGE at $0.1090 by year-end in a forecast published June 27 — representing a 46% increase from the stated market price. Still, the near-term setup depends on DOGE maintaining a daily close above $0.069.

    The stated entry range stands between $0.070 and $0.072, with $0.08 as the primary target. If DOGE reclaims $0.08 with stronger volume, the $0.09 (50-day average) becomes the next technical target. That move would strengthen the forecast recovery path.

    A daily close below $0.069 would invalidate the near-term bounce setup. The next cited support zone would then sit between $0.060 and $0.062.

    What’s Next?

    Dogecoin remains under bearish pressure below its major moving averages, but oversold indicators suggest selling momentum may be easing. The $0.069 support level now determines whether DOGE can rebound toward $0.08 or fall toward $0.060. Traders should monitor daily closes and maintain disciplined risk management.